Thermal History Comparison
The fit oh the phase diagram to the model:
\[T(\Delta) = T_0 \Delta ^{\gamma-1}\]Comparison of the evolution of the phase diagram for \(2048^3\) cell ( 50 Mpc/h ) boxes, using two different UV Backgrounds:
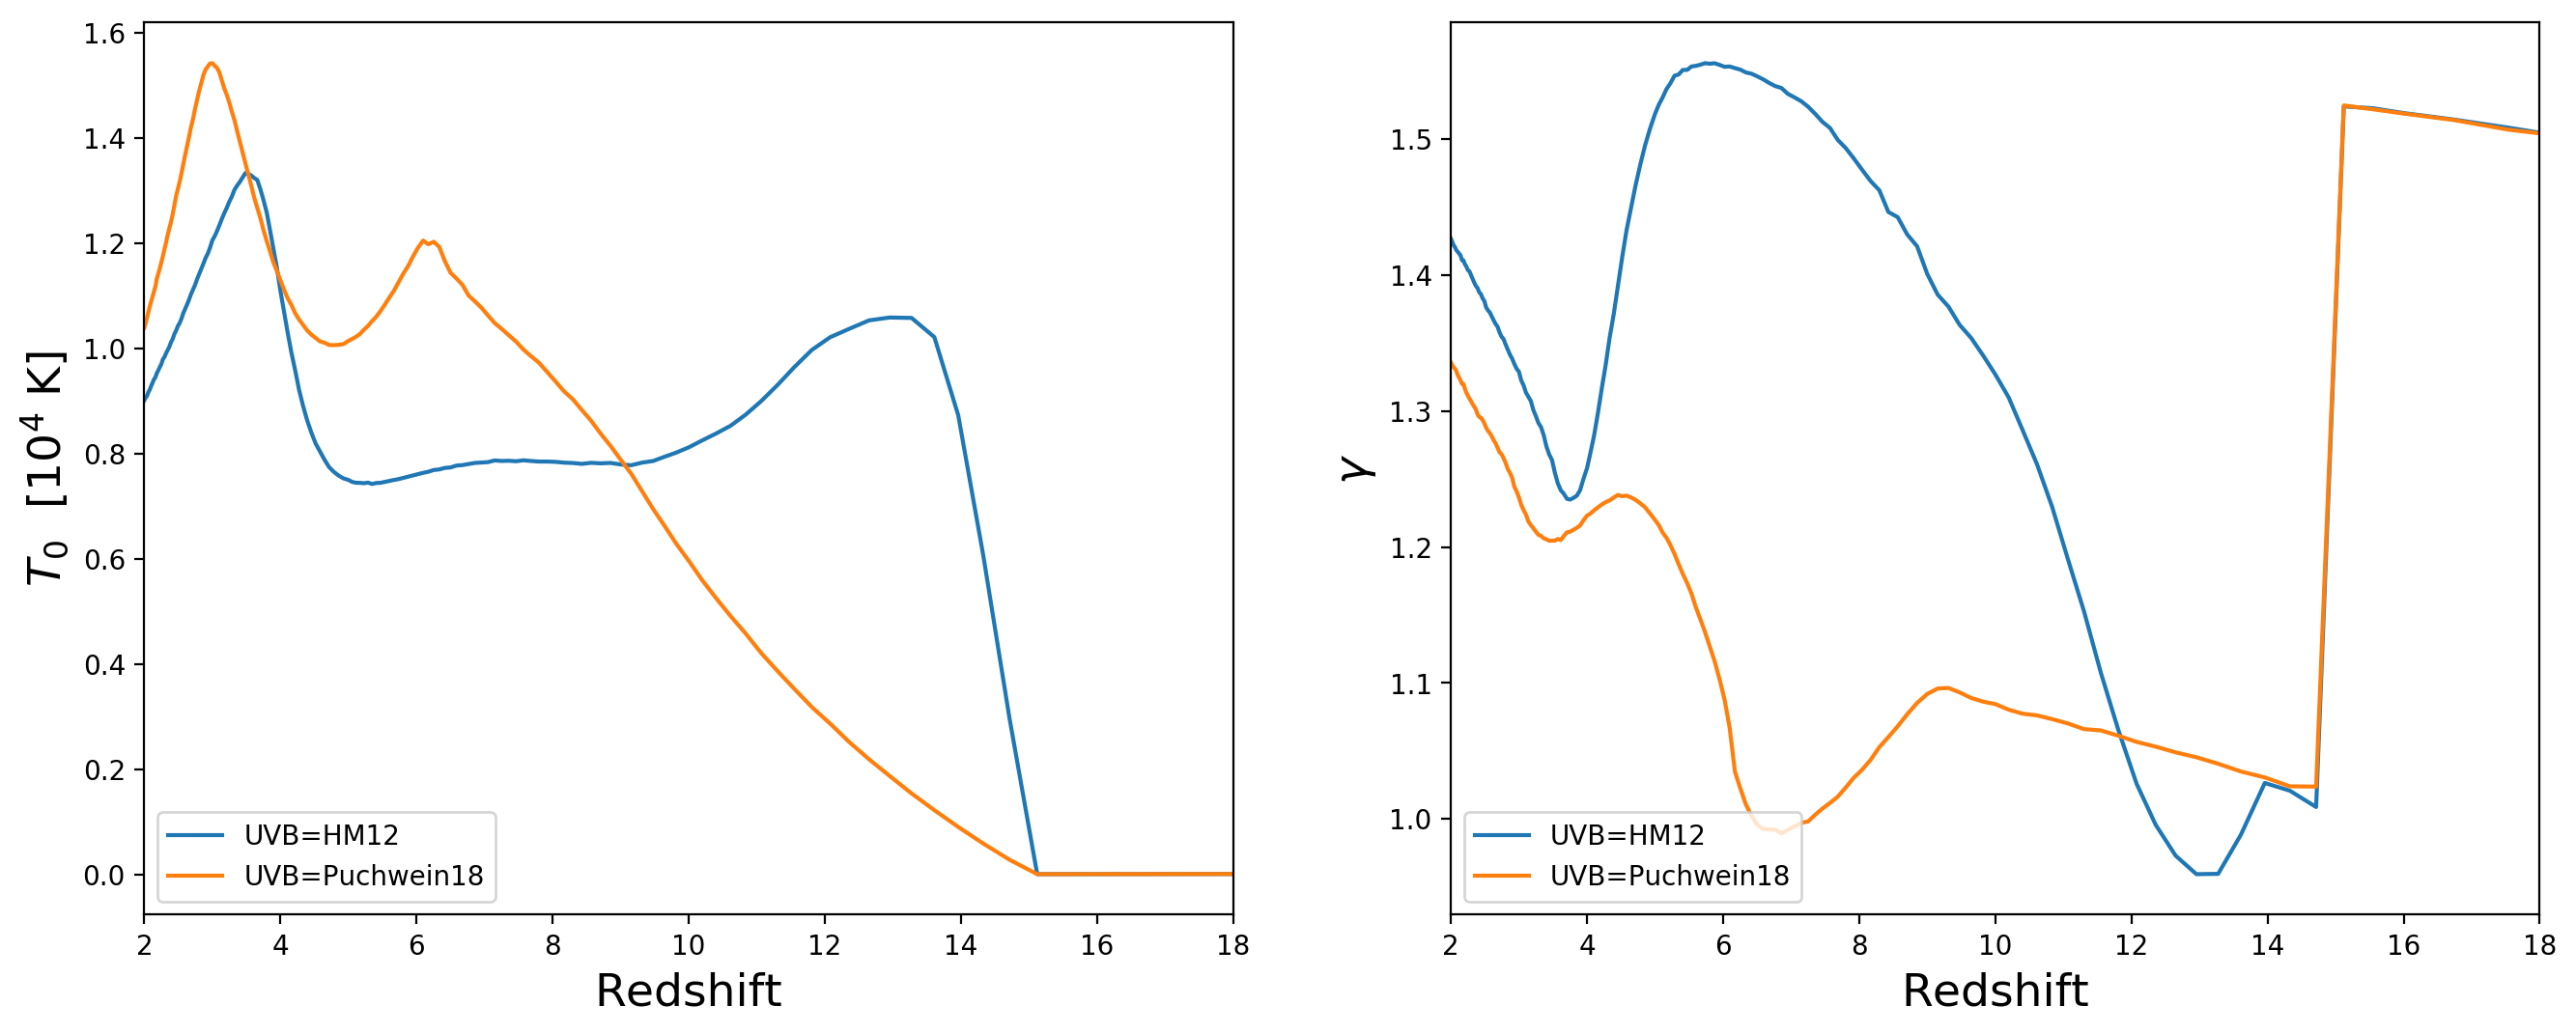
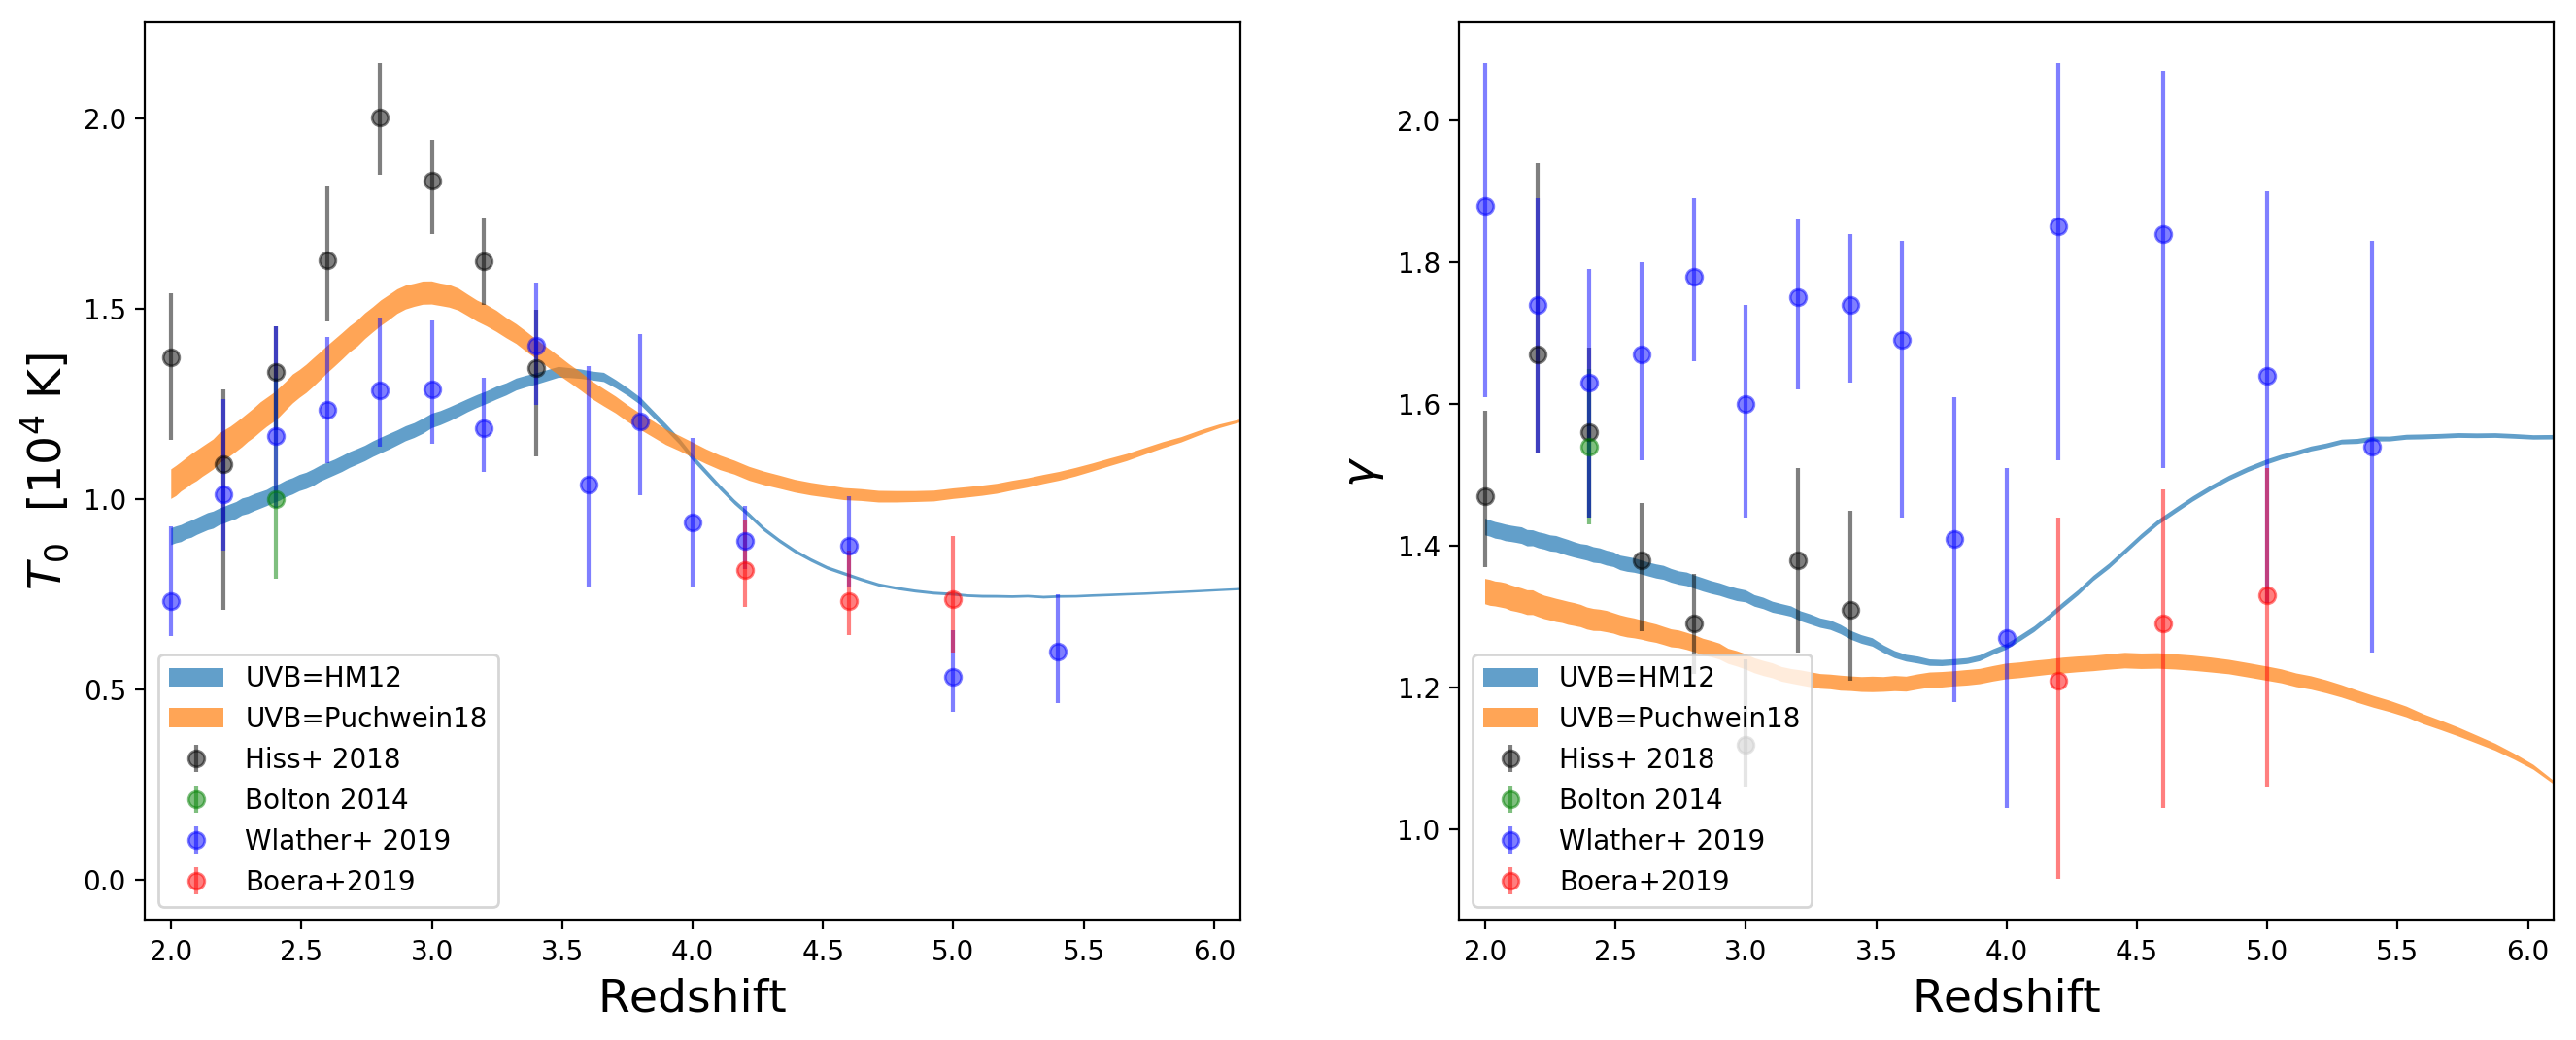
Now the values of [ \(T_0\), \(\gamma\) ] as a function of redshift
And Comparing to some of the data prsdented in Walther+2019
Cell trajectories on the phase diagram:
Top row: UVB = HM12 Bottom row: UVB = Puchwein18
Each panel shows trajectories for 10 cells, the cells shows are the same for both UVB.