Thermal History HM12
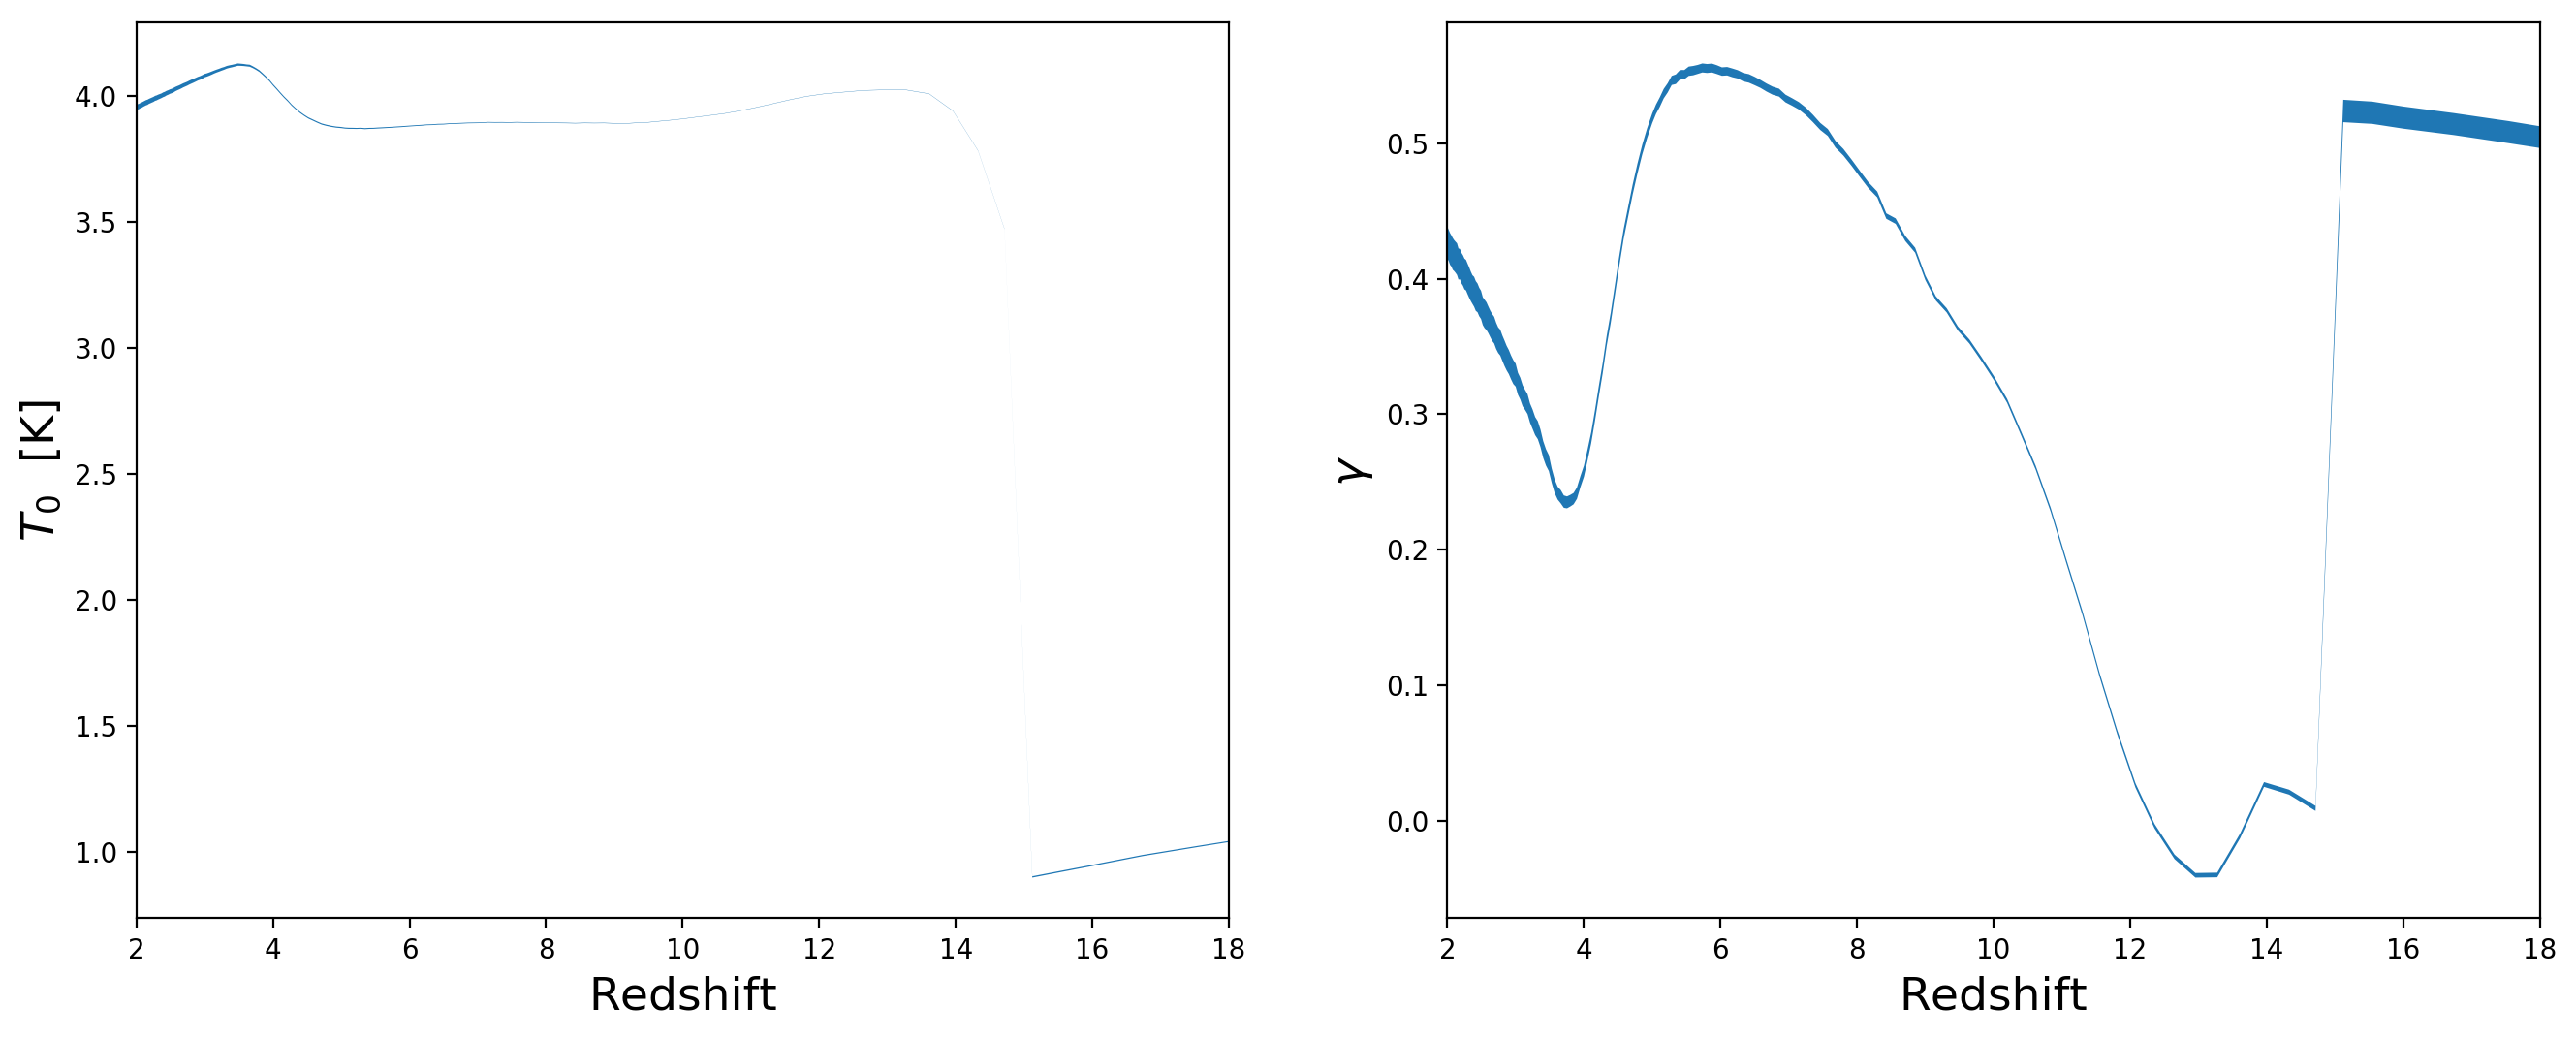
Thermal History for the 2048\(^3\) simulation with HM12 UV Background:
Here I show the bands for the measured values of \(T_0\) and \(\gamma\) and the with of the band is the uncertainty on the measurement.
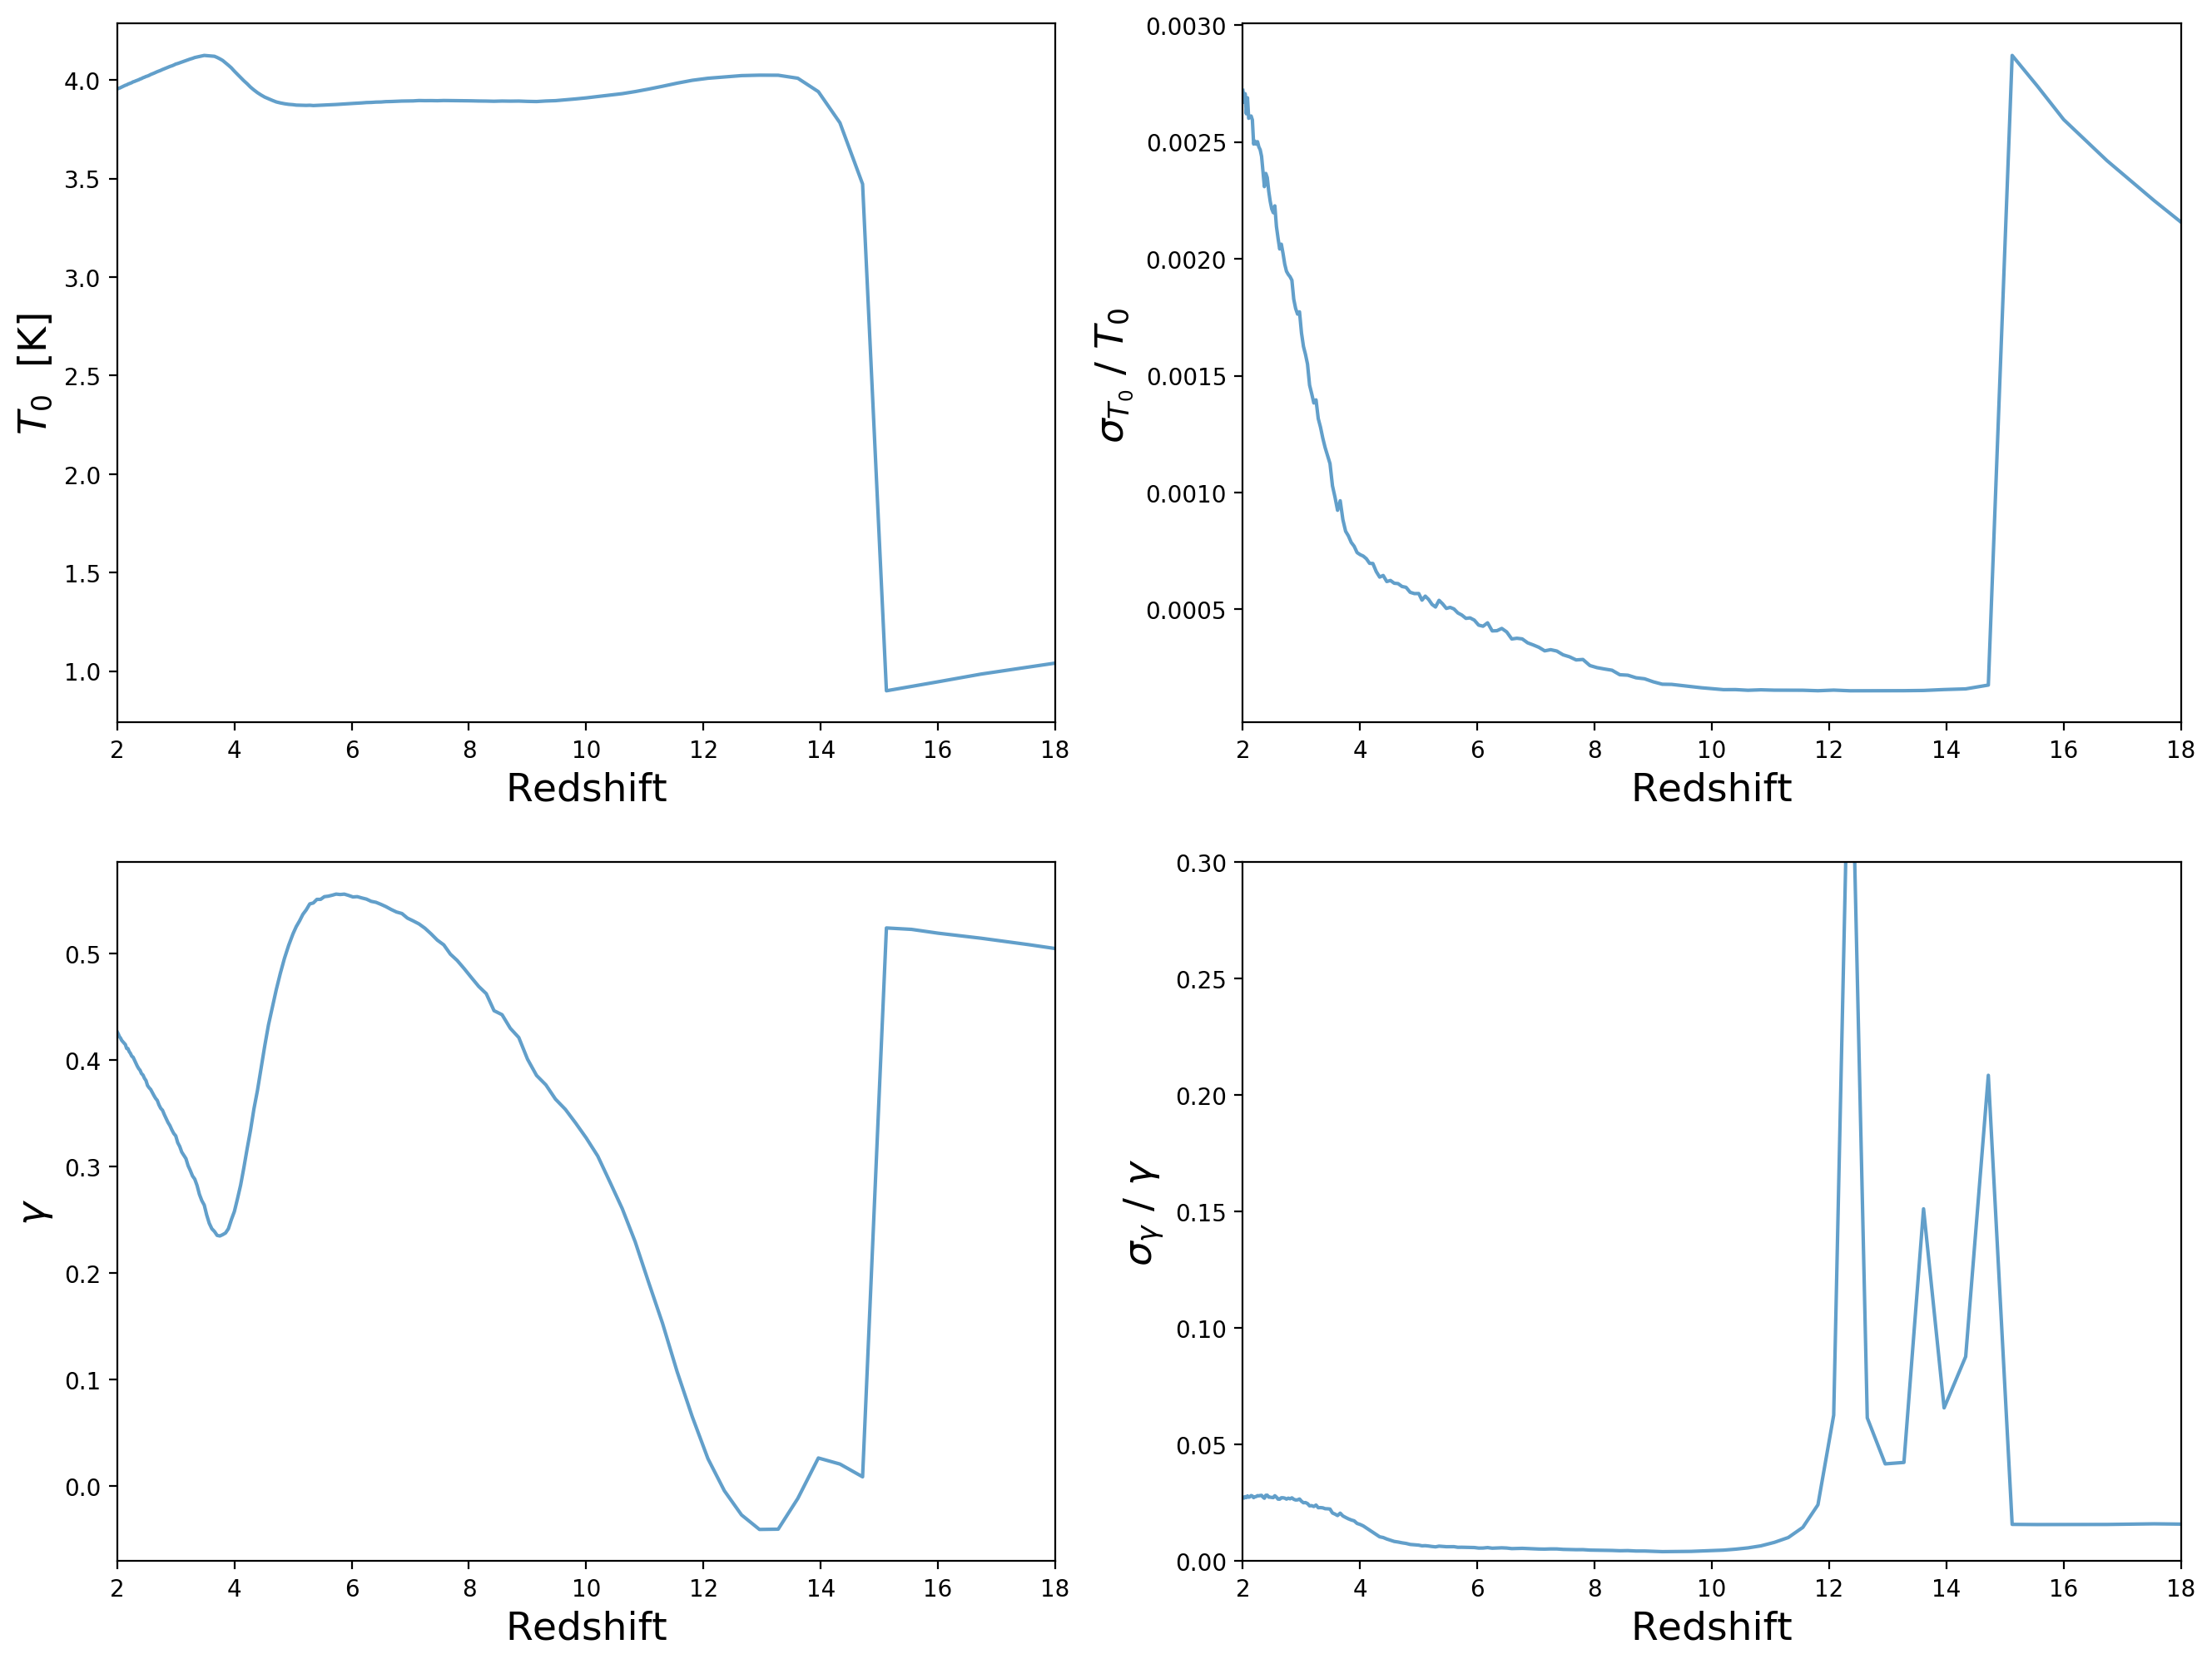
The uncertainties are very small, specially for \(T_0\), so instead I now plot separately the mean values of \(T_0\) and \(\gamma\) as a function of redshift on the left column and the fractional uncertainty on the right columns.