Equation of State Fitting Second Try
Here I fit the phase diagram to the model:
\[T(\Delta) = T_0 \Delta ^\gamma\]Now I take another approach, take slices of the phase diagram for a fixed overdensity, then locate the temperature for maximum probability and the temperature range that sums 90\% of the probability, this gives data points { \(T_i\), \(\sigma_i\) } for the region of interest in the phase diagram, this data points are shown in orange in the figure below.
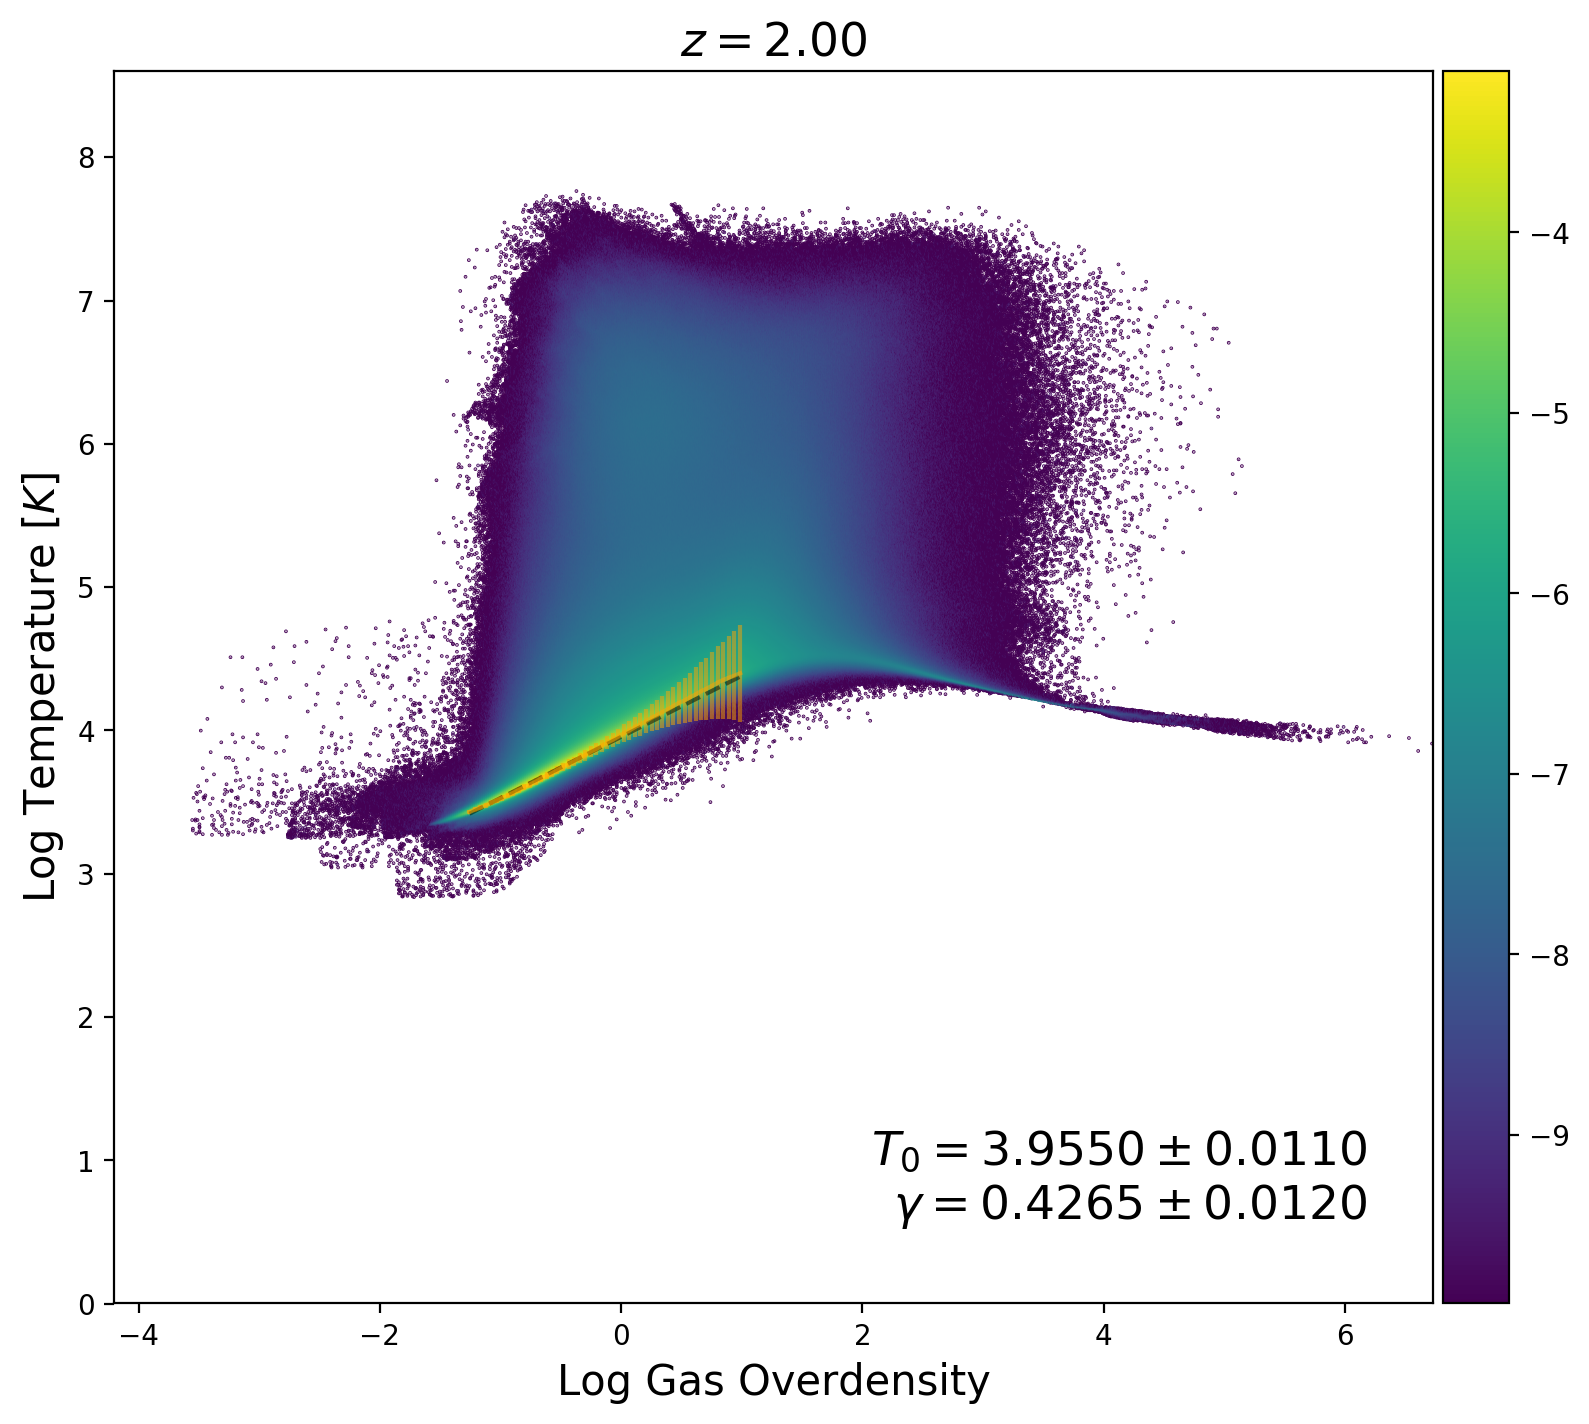
Now, I run the MCMC to find parameters {\(T_0\), \(\gamma\)} that maximize the likelihood:
\[P( T |T_0 , \gamma) = \exp \left(- \chi^{2} \right)\]where
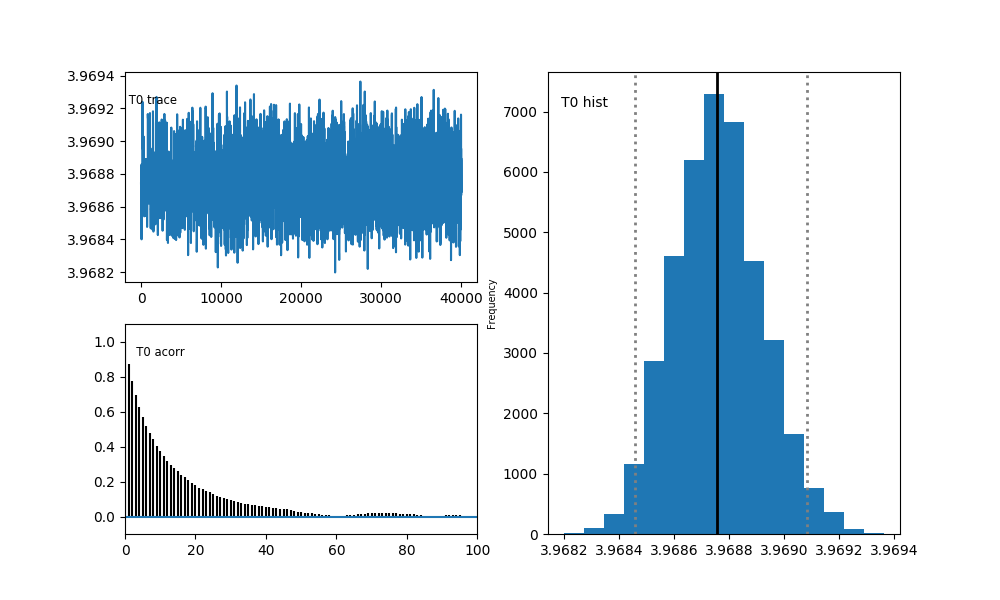
\[\chi^{2}=\sum_{i} \frac{\left(T_i- T\left(\Delta_{i} |T_0 , \gamma\right)\right)^{2}}{2 \sigma_i^{2}}\]Sampling for \(T_0\):
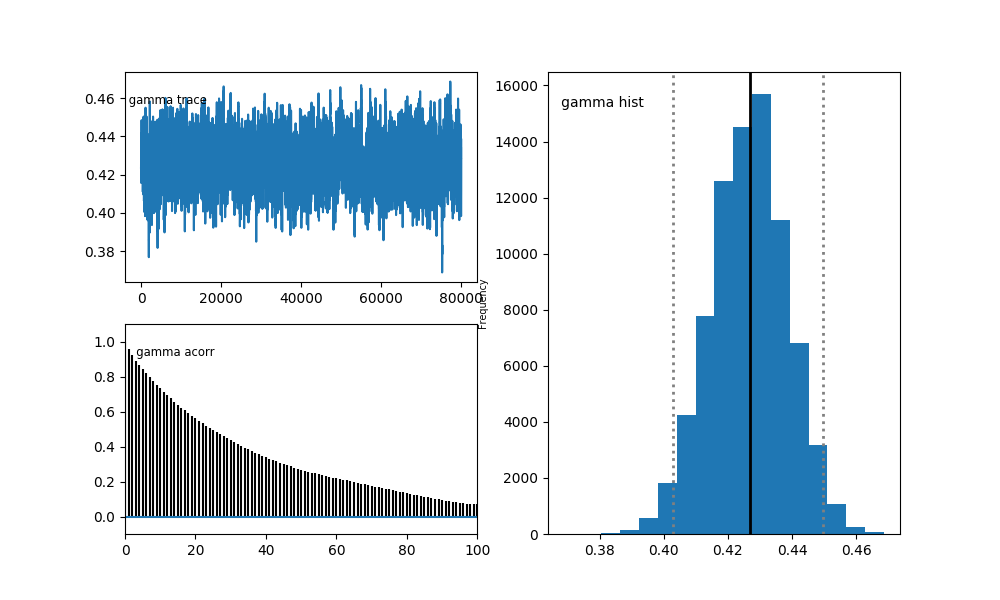
Sampling for \(\gamma\):