Equation of State Fitting
Here I fit the phase diagram to the model:
\[T(\Delta) = T_0 \Delta ^\gamma\]First I do it by minimizing \(- \sum log[ P(\Delta, T) ]\) with the help of scipy, this is the result:
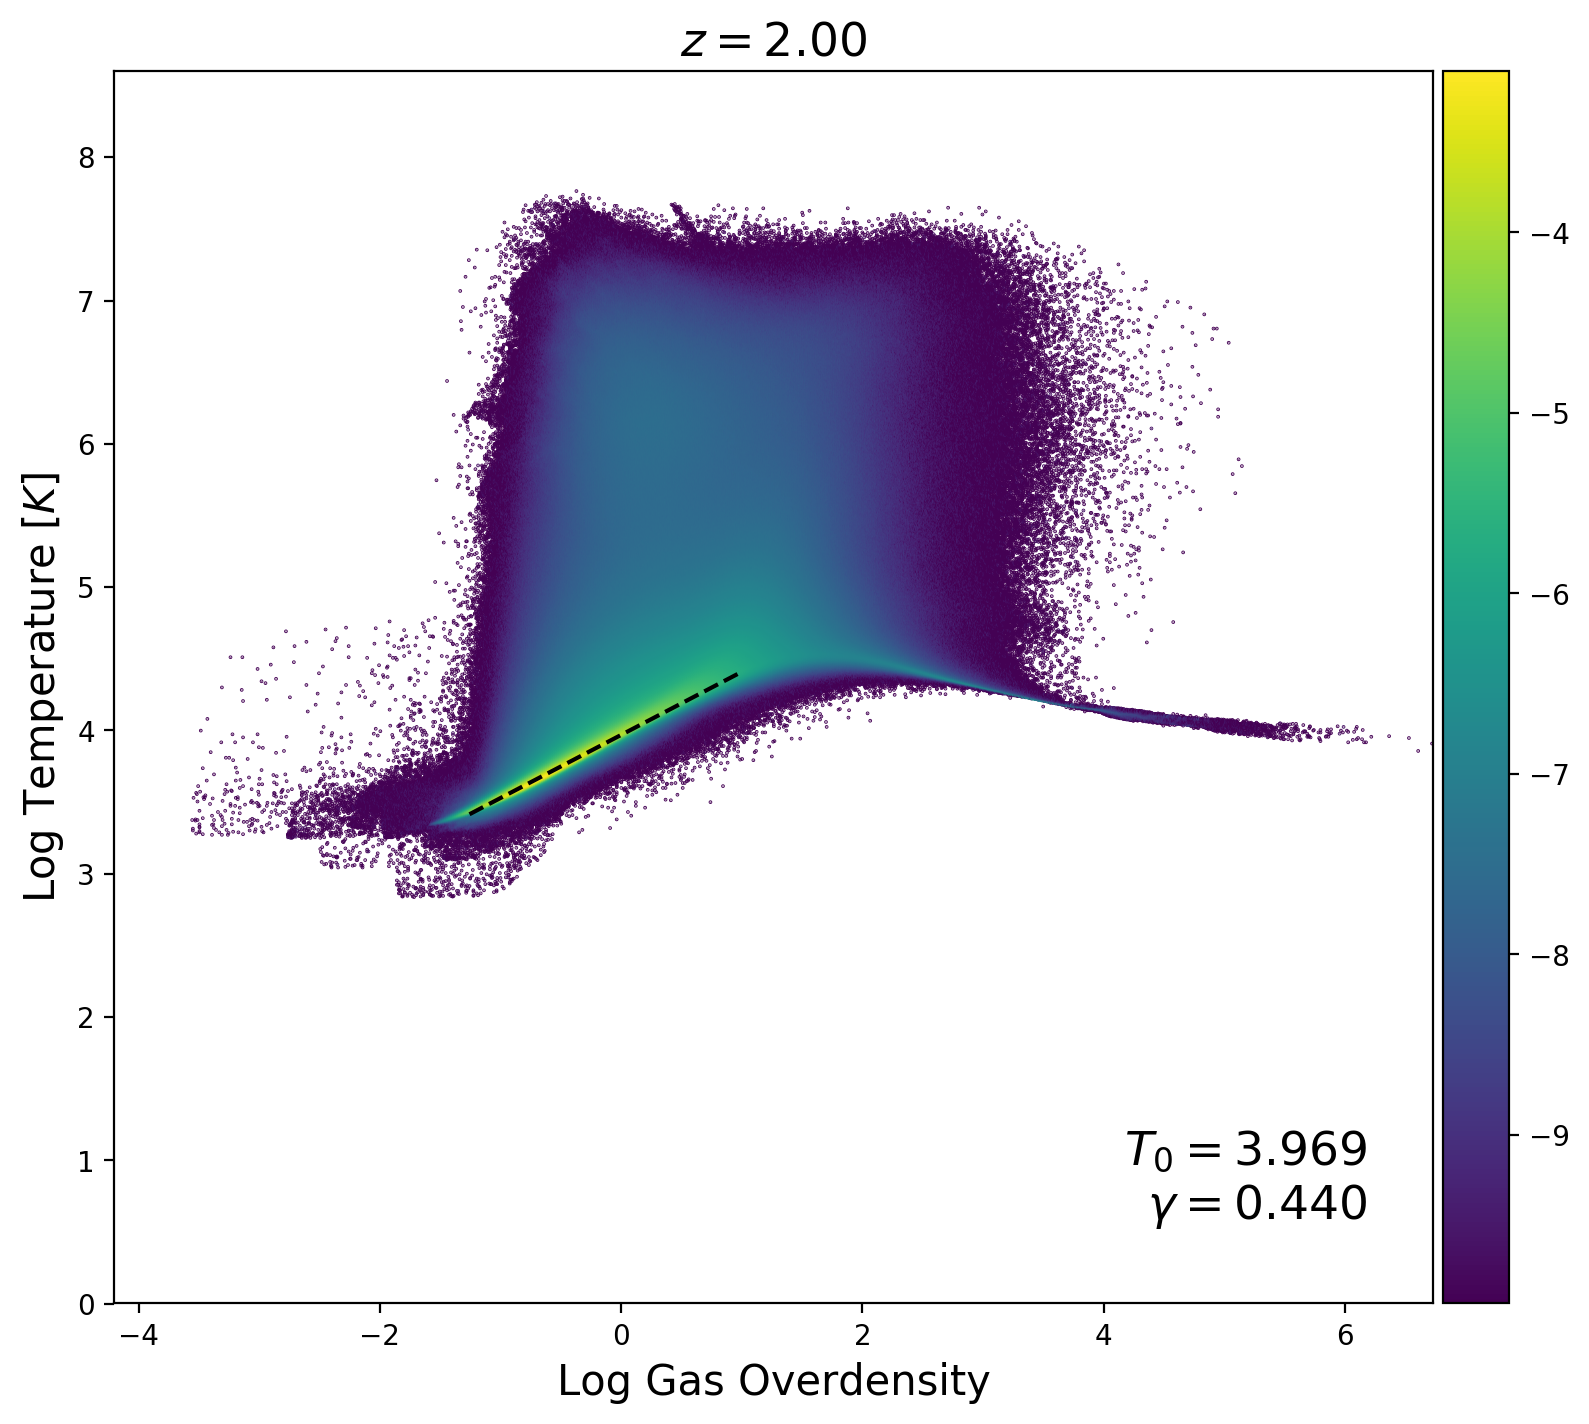
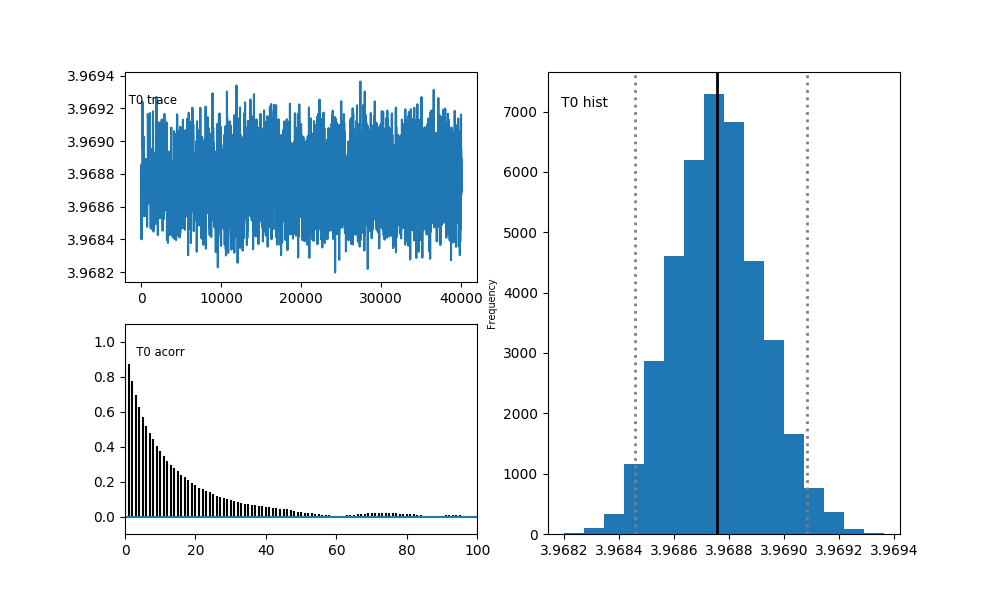
Now, I run an MCMC to sample the space of parameters {\(T_0\), \(\gamma\)} and maximize the probability \(\sum log[ P(\Delta, T) ]\), I use the pymc package to do so and from the sampling I get the posterior distribution for the parameters:
Sampling for \(T_0\):
Sampling for \(\gamma\):
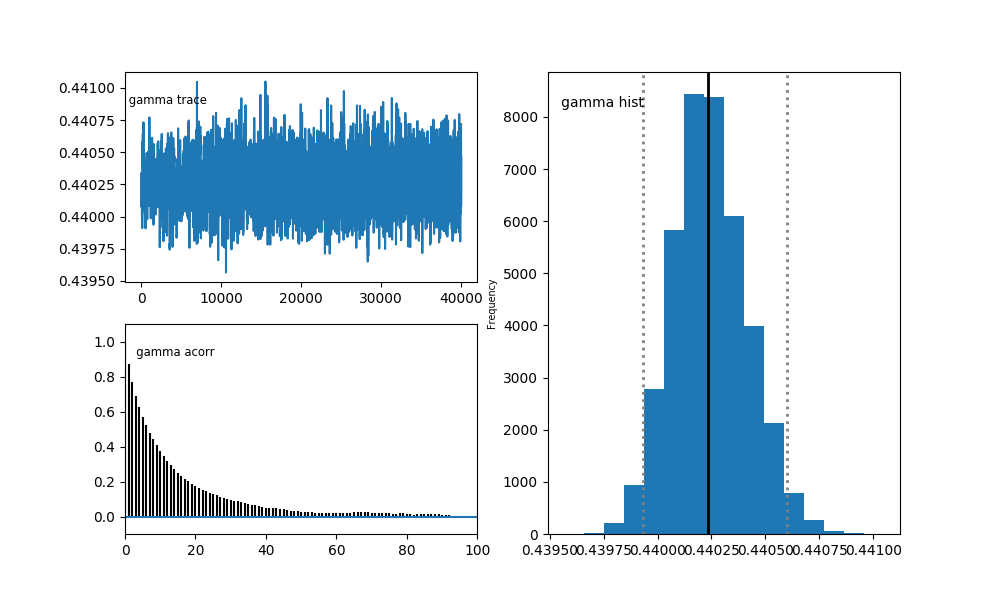
From the distributions I can get the mean and the standard deviation for the parameters:
\[T_0 = 3.96875 \pm 0.00016\] \[\gamma = 0.44024 \pm 0.00017\]