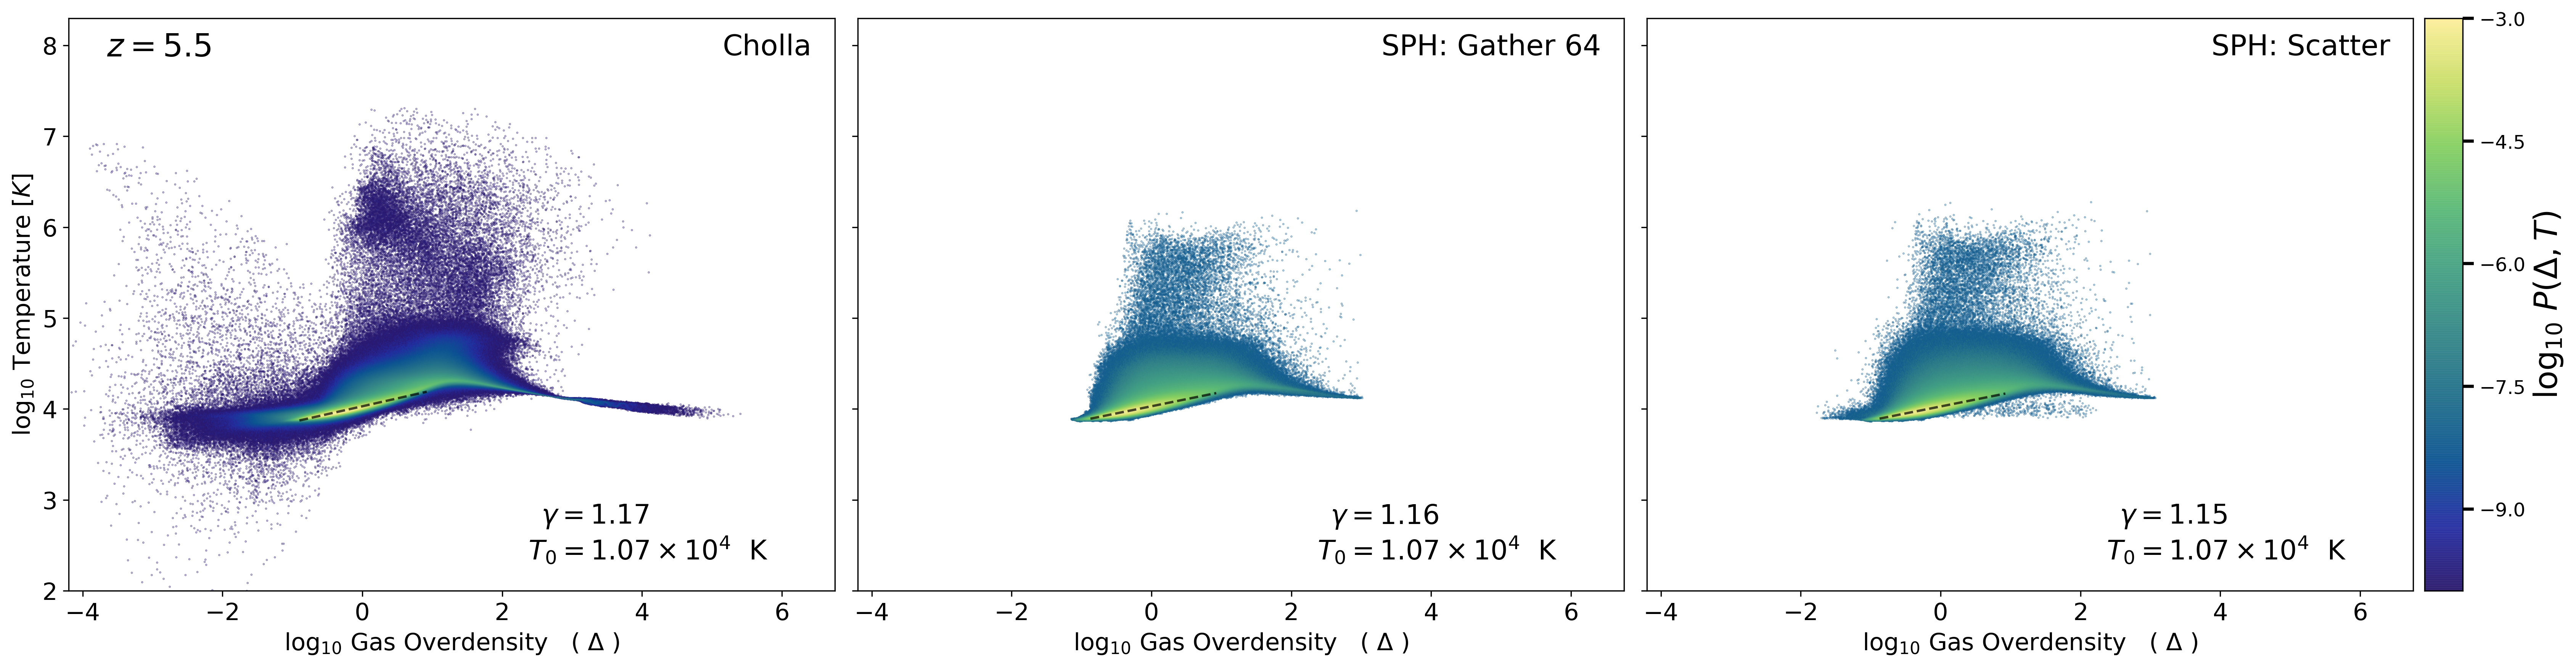
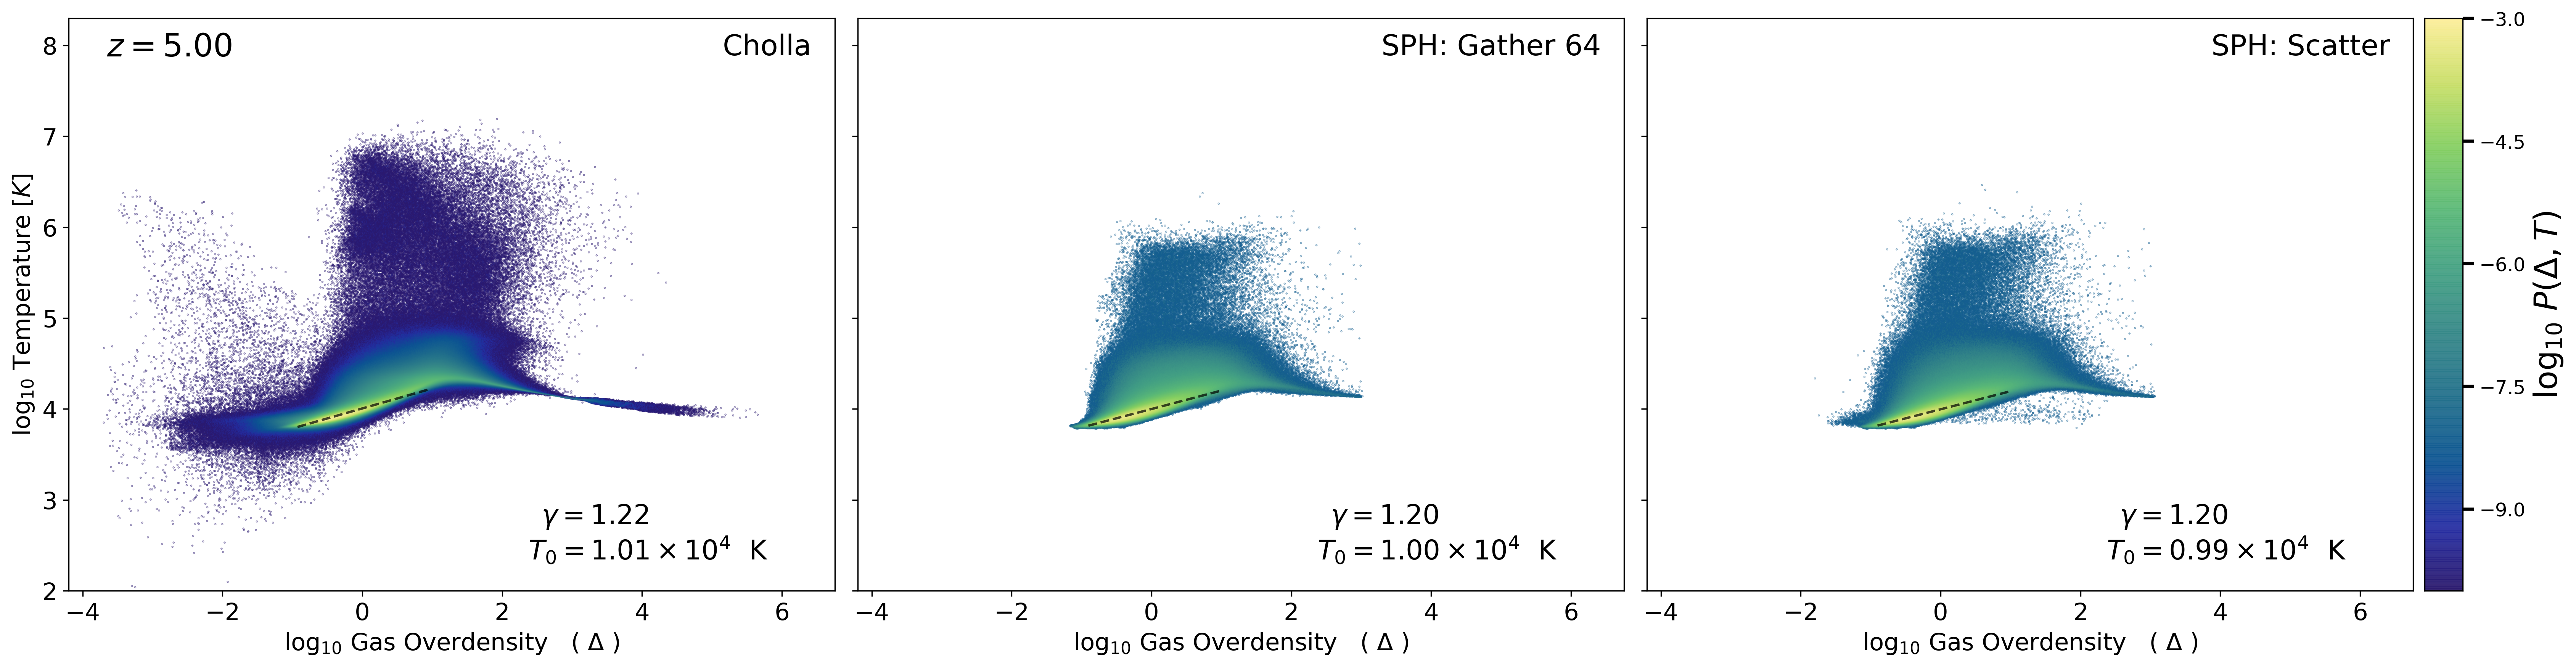
Phase Diagram from SPH Puchwein Simulations
For the SPH simulation, the phase diagram is computed from the gas density and temperature interpolated onto a grid ( \(512^3\) cells ). For the interpolation I used two different methods:
Gather 64: Measure the distance that encloses 64 neighboring particles and use that distance as the smoothing length when computing the kernel weights.
Scatter: Use the smoothing lengths of the neighboring particles when computing the kernel weights.
Below I show the phase diagram from the two interpolation methods and compare to the phase diagram from the Cholla simulation
z= 5
z= 5.5