CHOLLA_PM: Conserved Projections
The phase_diagram using a uniform initial velocity \(vx = vy = vz = 160 km/s\) and no gravity ( cooling is on ) and \(\eta=0\) (always using total internal energy):
Row 1: Normal pressure on the flux of E and momentum
Row 2: No pressure on the flux of E and momentum
No spurious heating of the gas!
To track the differences on the hydro conserved variables I plot projections ( 5 Mpc deep );
I used PPCM for the reconstruction and HLLC for the Reimann solver.
First using \(\eta = 0.001\) same as enzo:
Now using \(\eta =0.02\), here we are using more of the advected internal energy
Now using \(\eta=1\) always using advected internal energy and not synchronizing the total internal energy to see the independent evolution of the total internal energy.
Here is the phase diagram for the simulation using \(\eta=1\) (only advected internal energy )
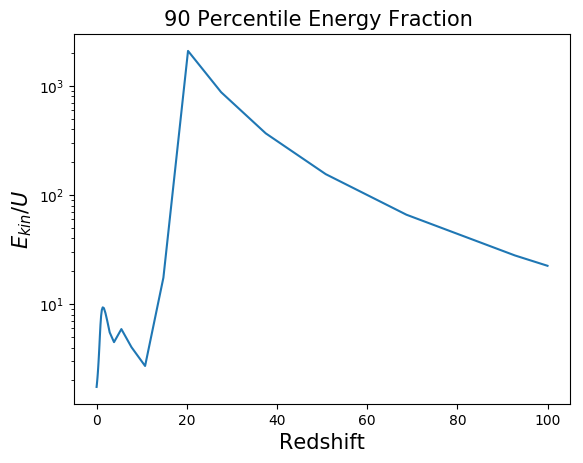
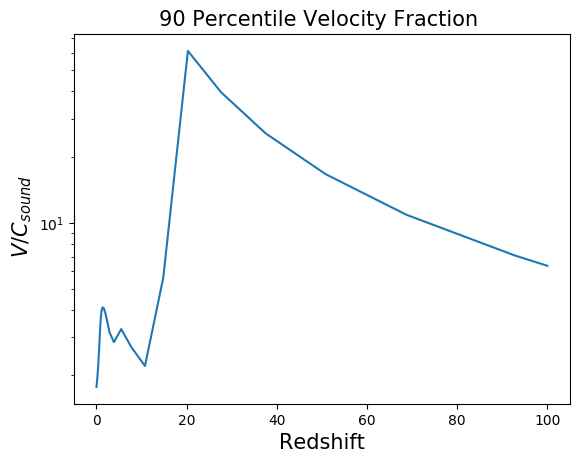
Here I show the fraction of the 90 percentile of the internal energy to the 90 percentile of the kinetic energy to show how small errors in the kinetic energy result in large errors on the internal energy.