WDM Simulations CIC vs. TSC
The simulations below are for L=25 Mpc/h and N=1024\(^3\) grids. Same as our simulation grid.
Matter Power Spectrum
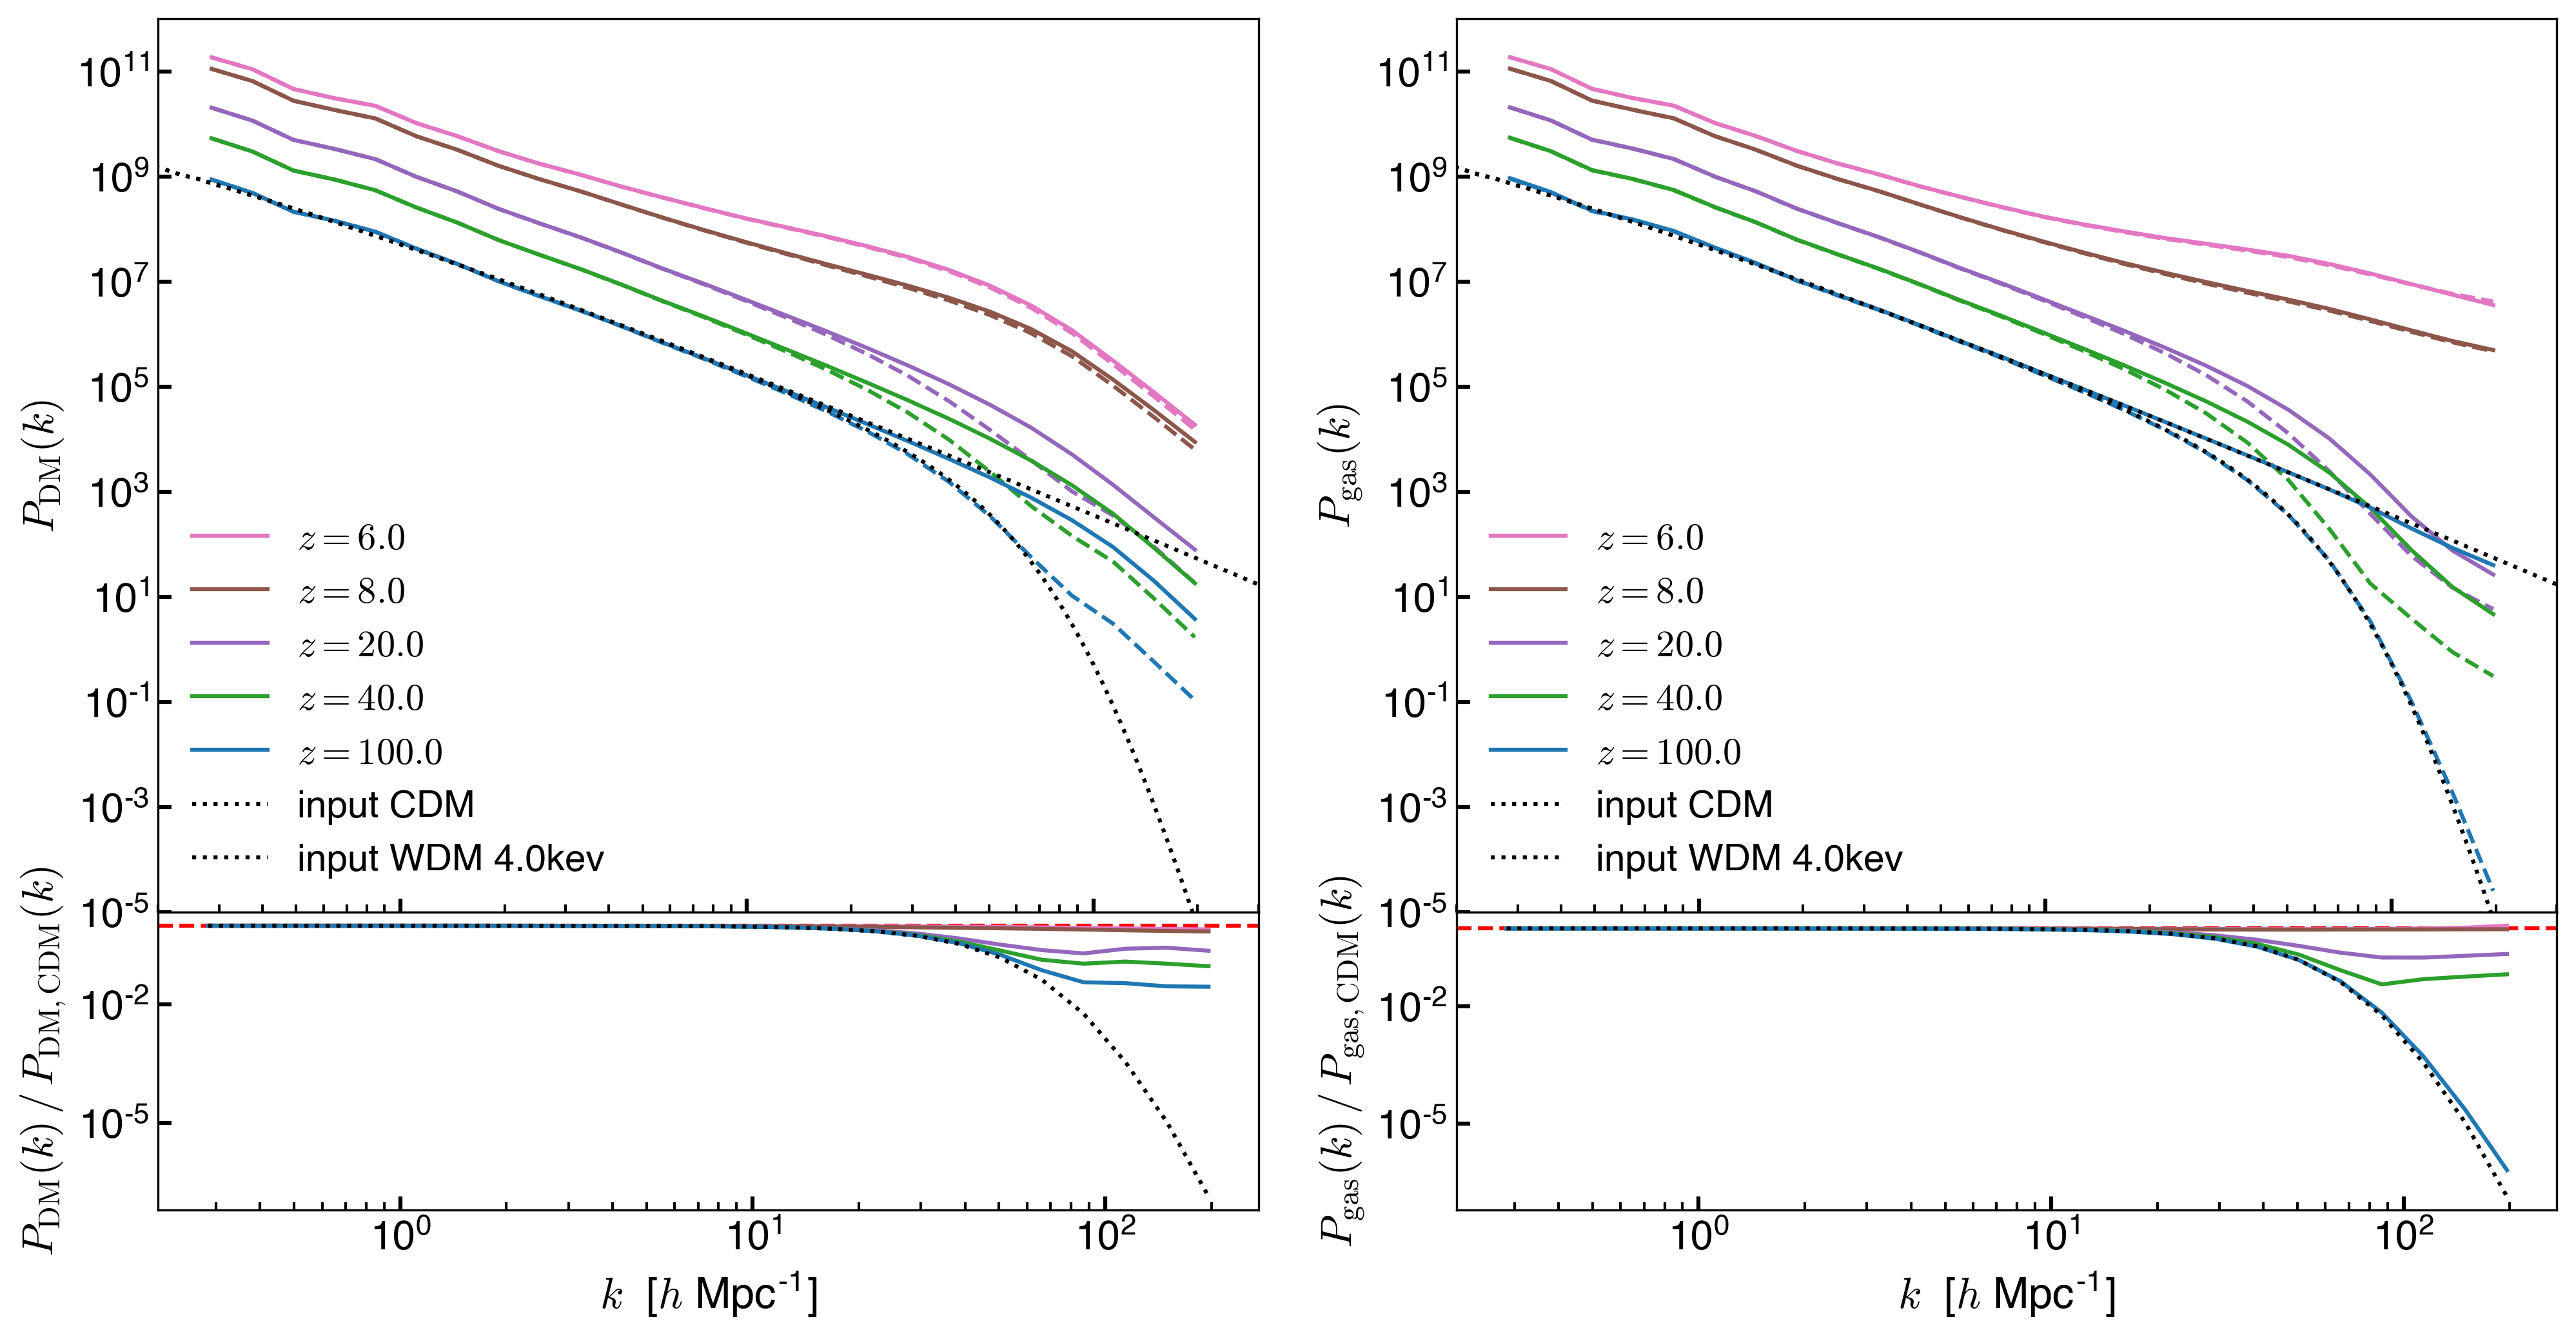
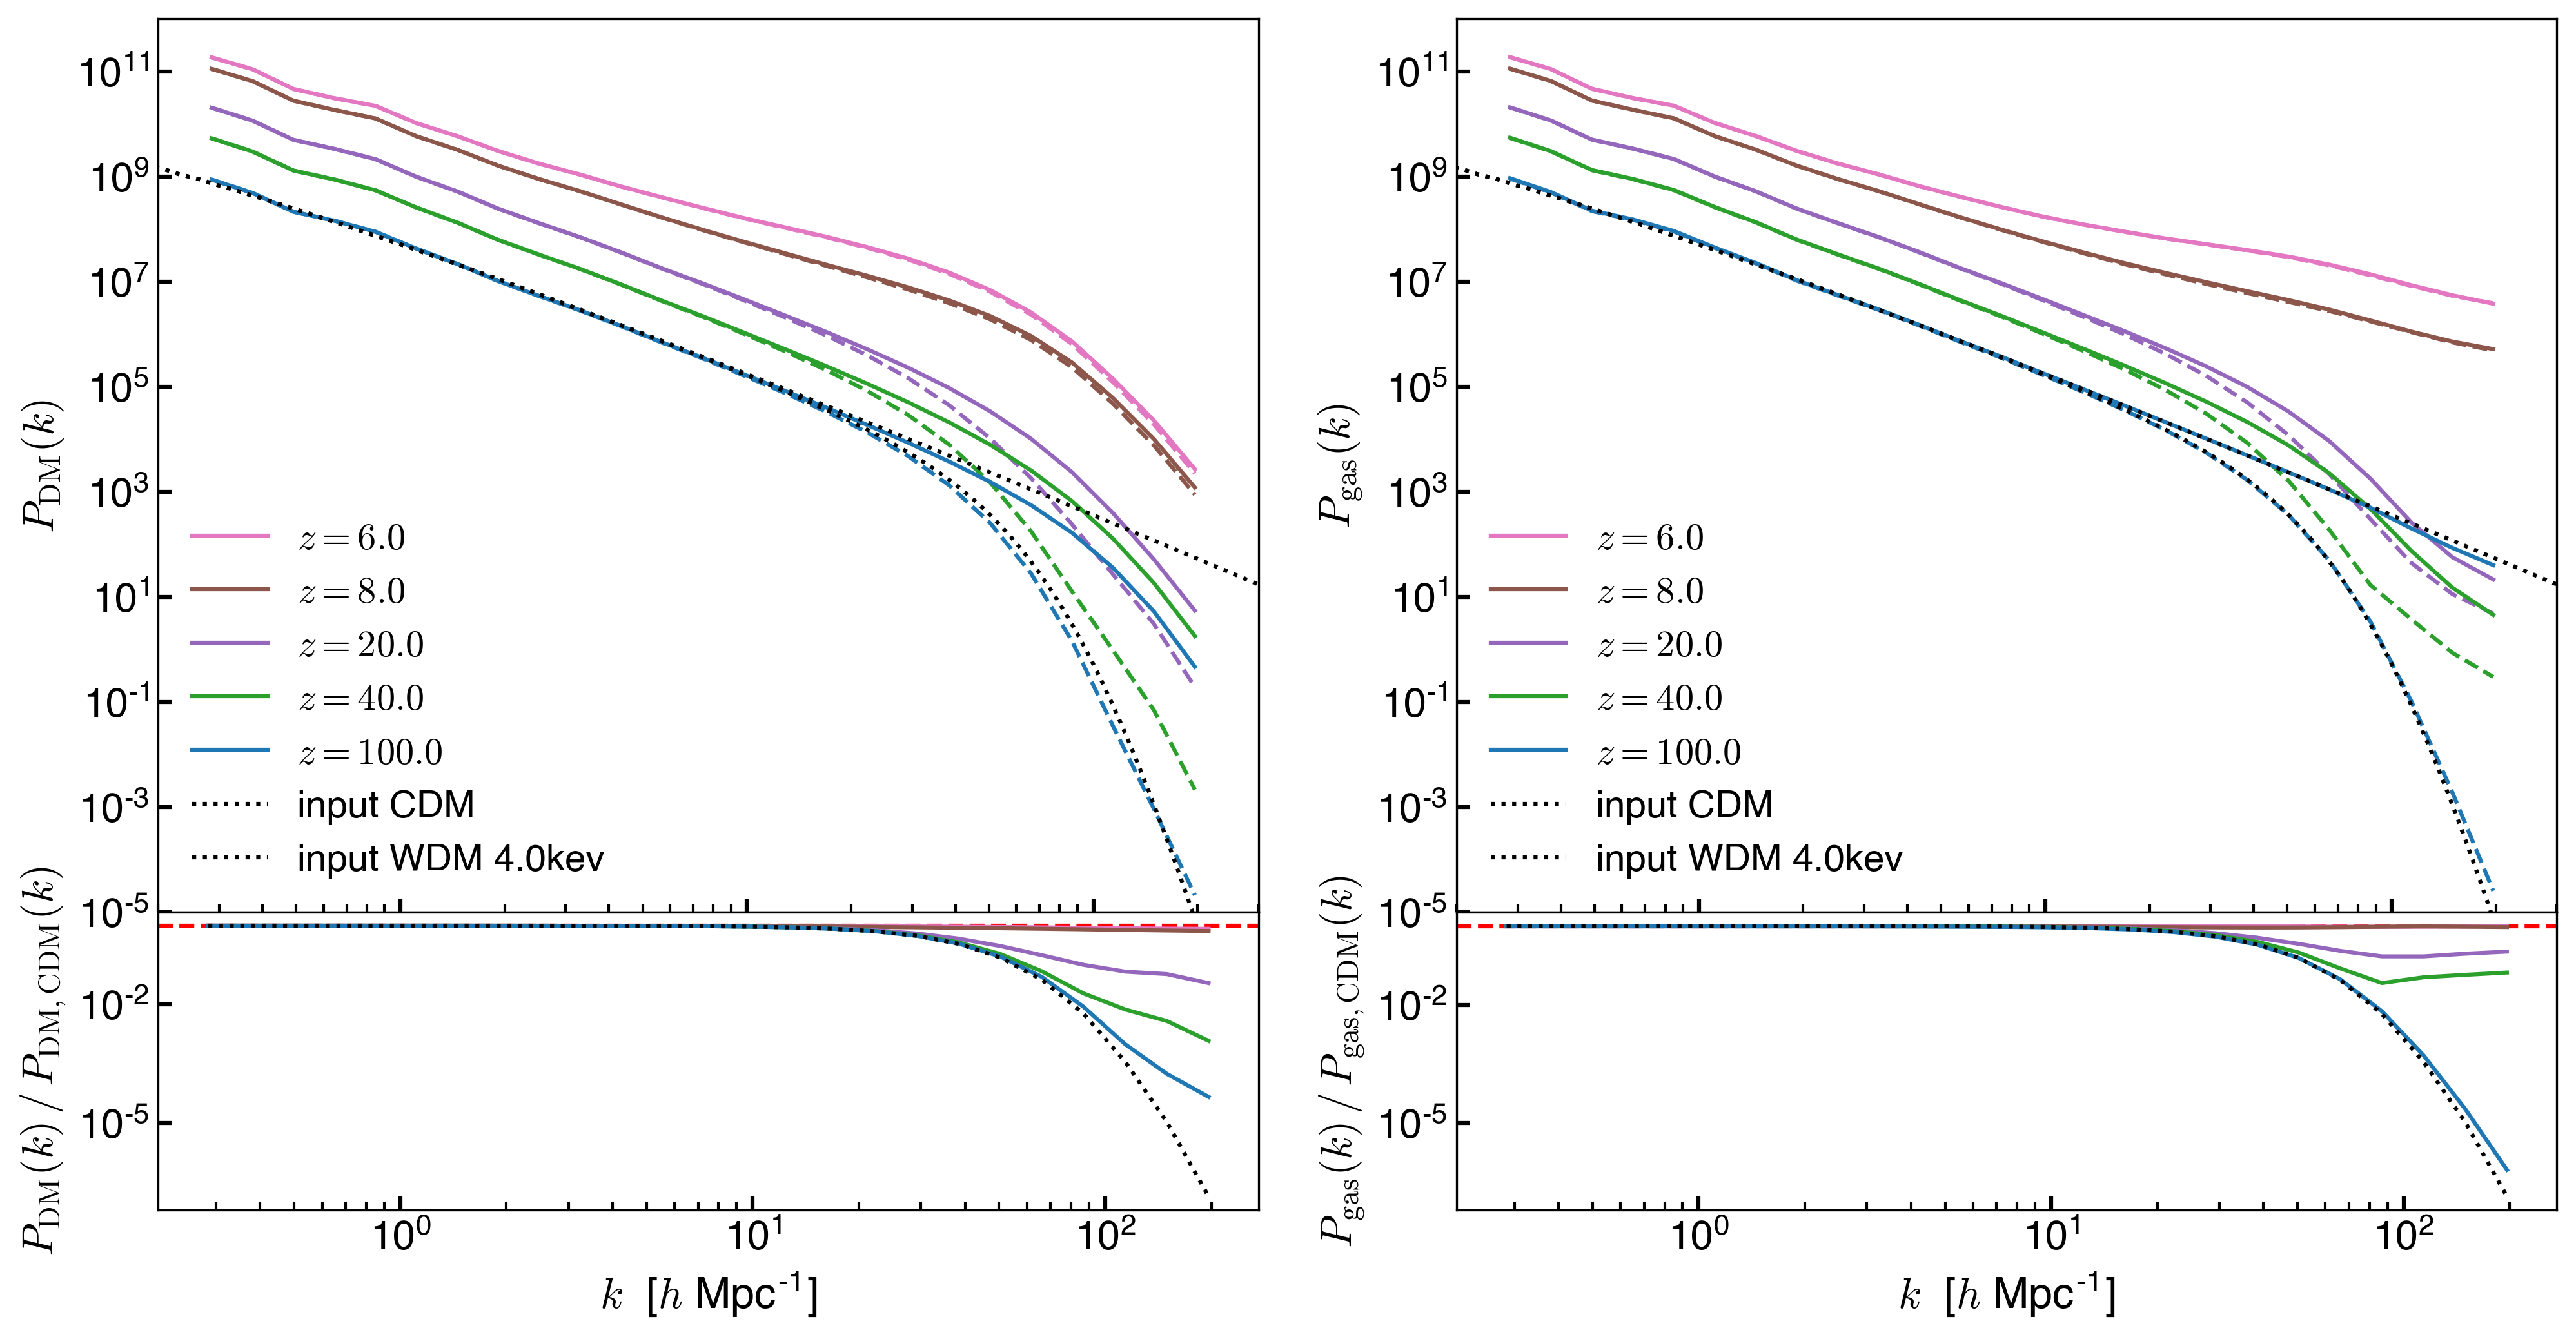
Evolution of the power spectrum for a CDM and a WDM=4kev simulations (DM on the right and gas on the left). Dashed lines correspond to the WDM simulation.
Bottom panels show \(P_\mathrm{WDM}(k) / P_\mathrm{CDM}(k)\) for DM and gas repectively.
The black dashed lines show the input power spectrum used to generate the initial conditions by MUSIC.
At the initial conditions CIC is closer to CDM but there is some suppression of small-scale power. This suppression is even larger for TSC, It might be that smearing the particles with the bigger kernel from TSC reduces the small-scale power more than CIC.
On the other hand TSC is closer the the WDM input power spectrum, it’s hard to tell if this is physical though.
CIC
TSC
Flux Power Spectrum
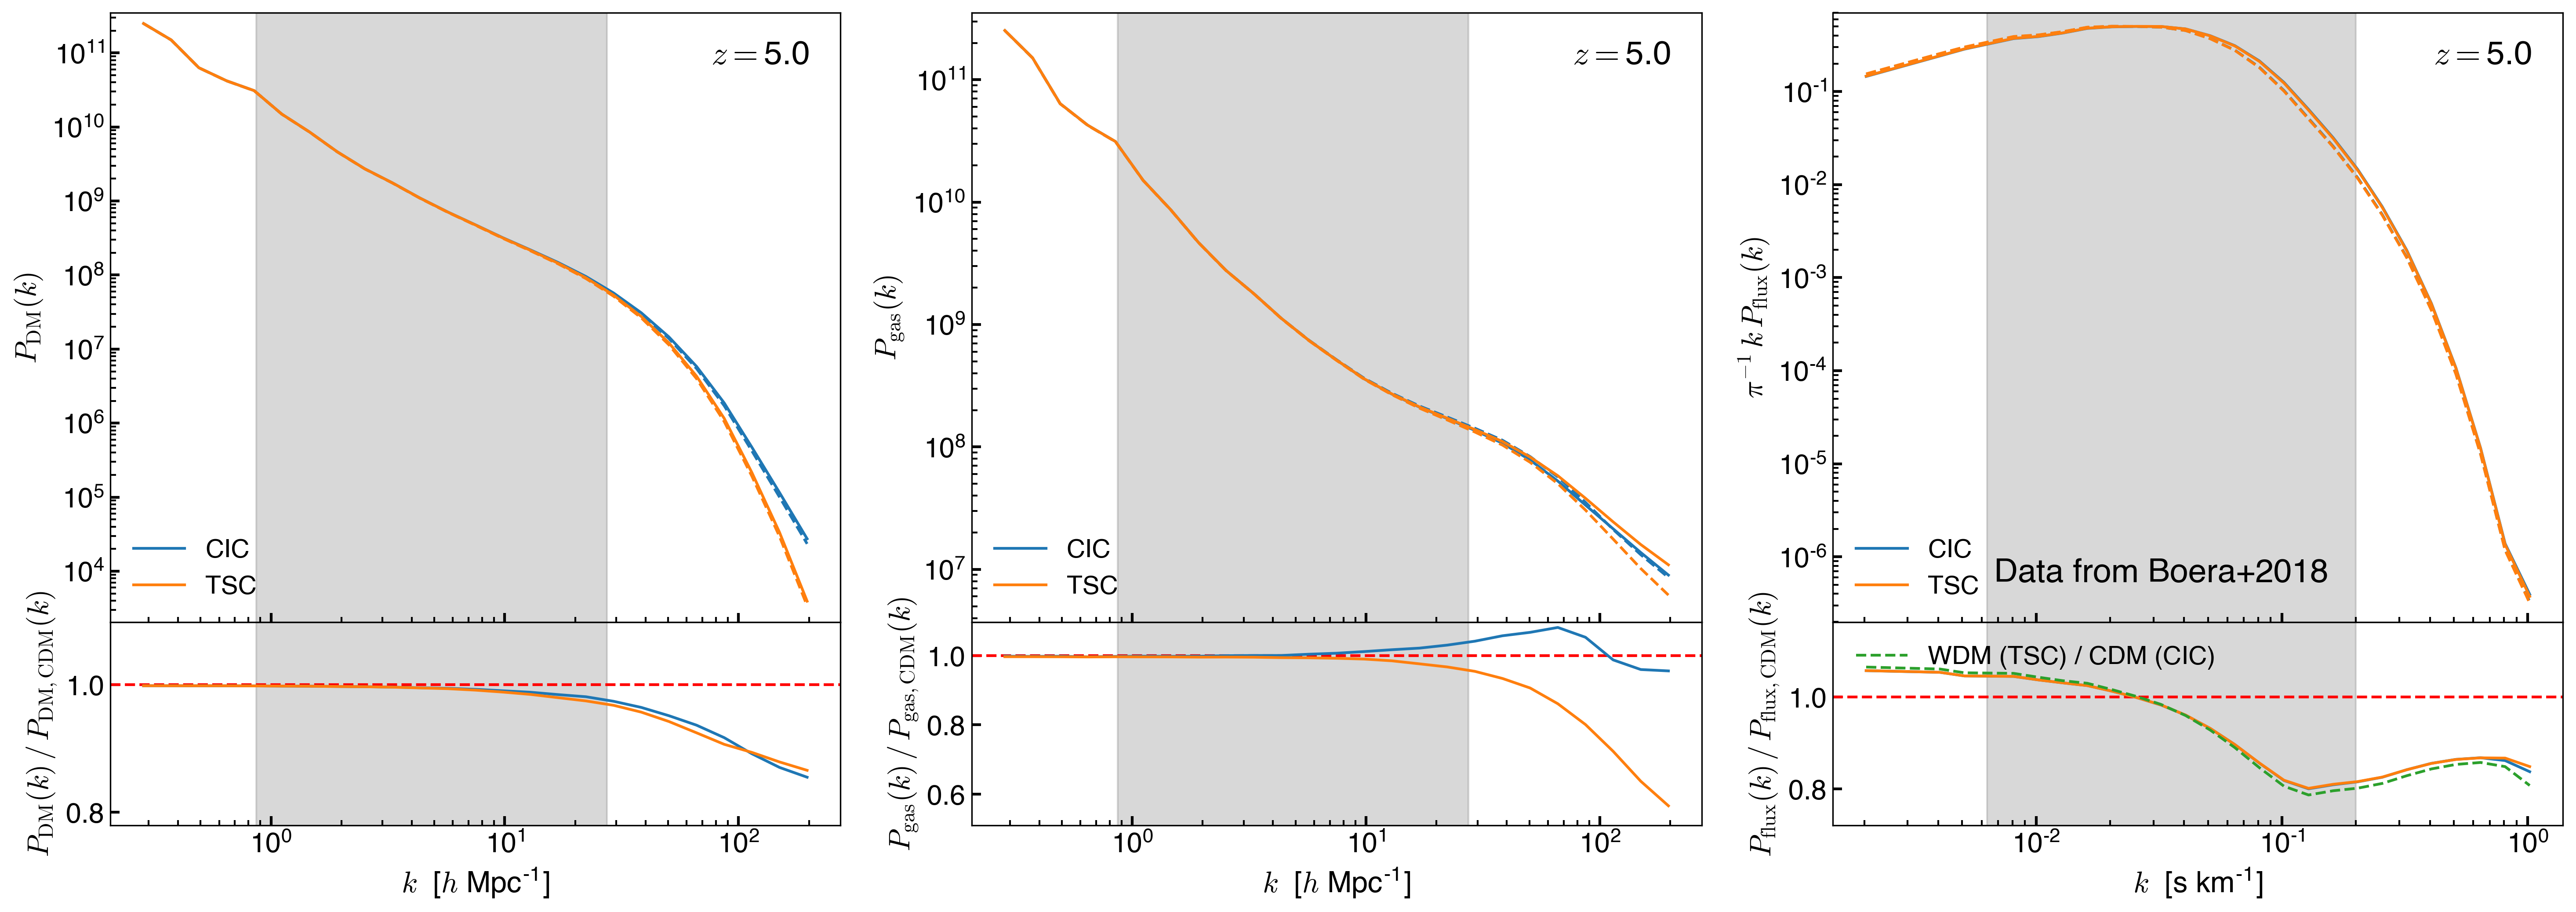
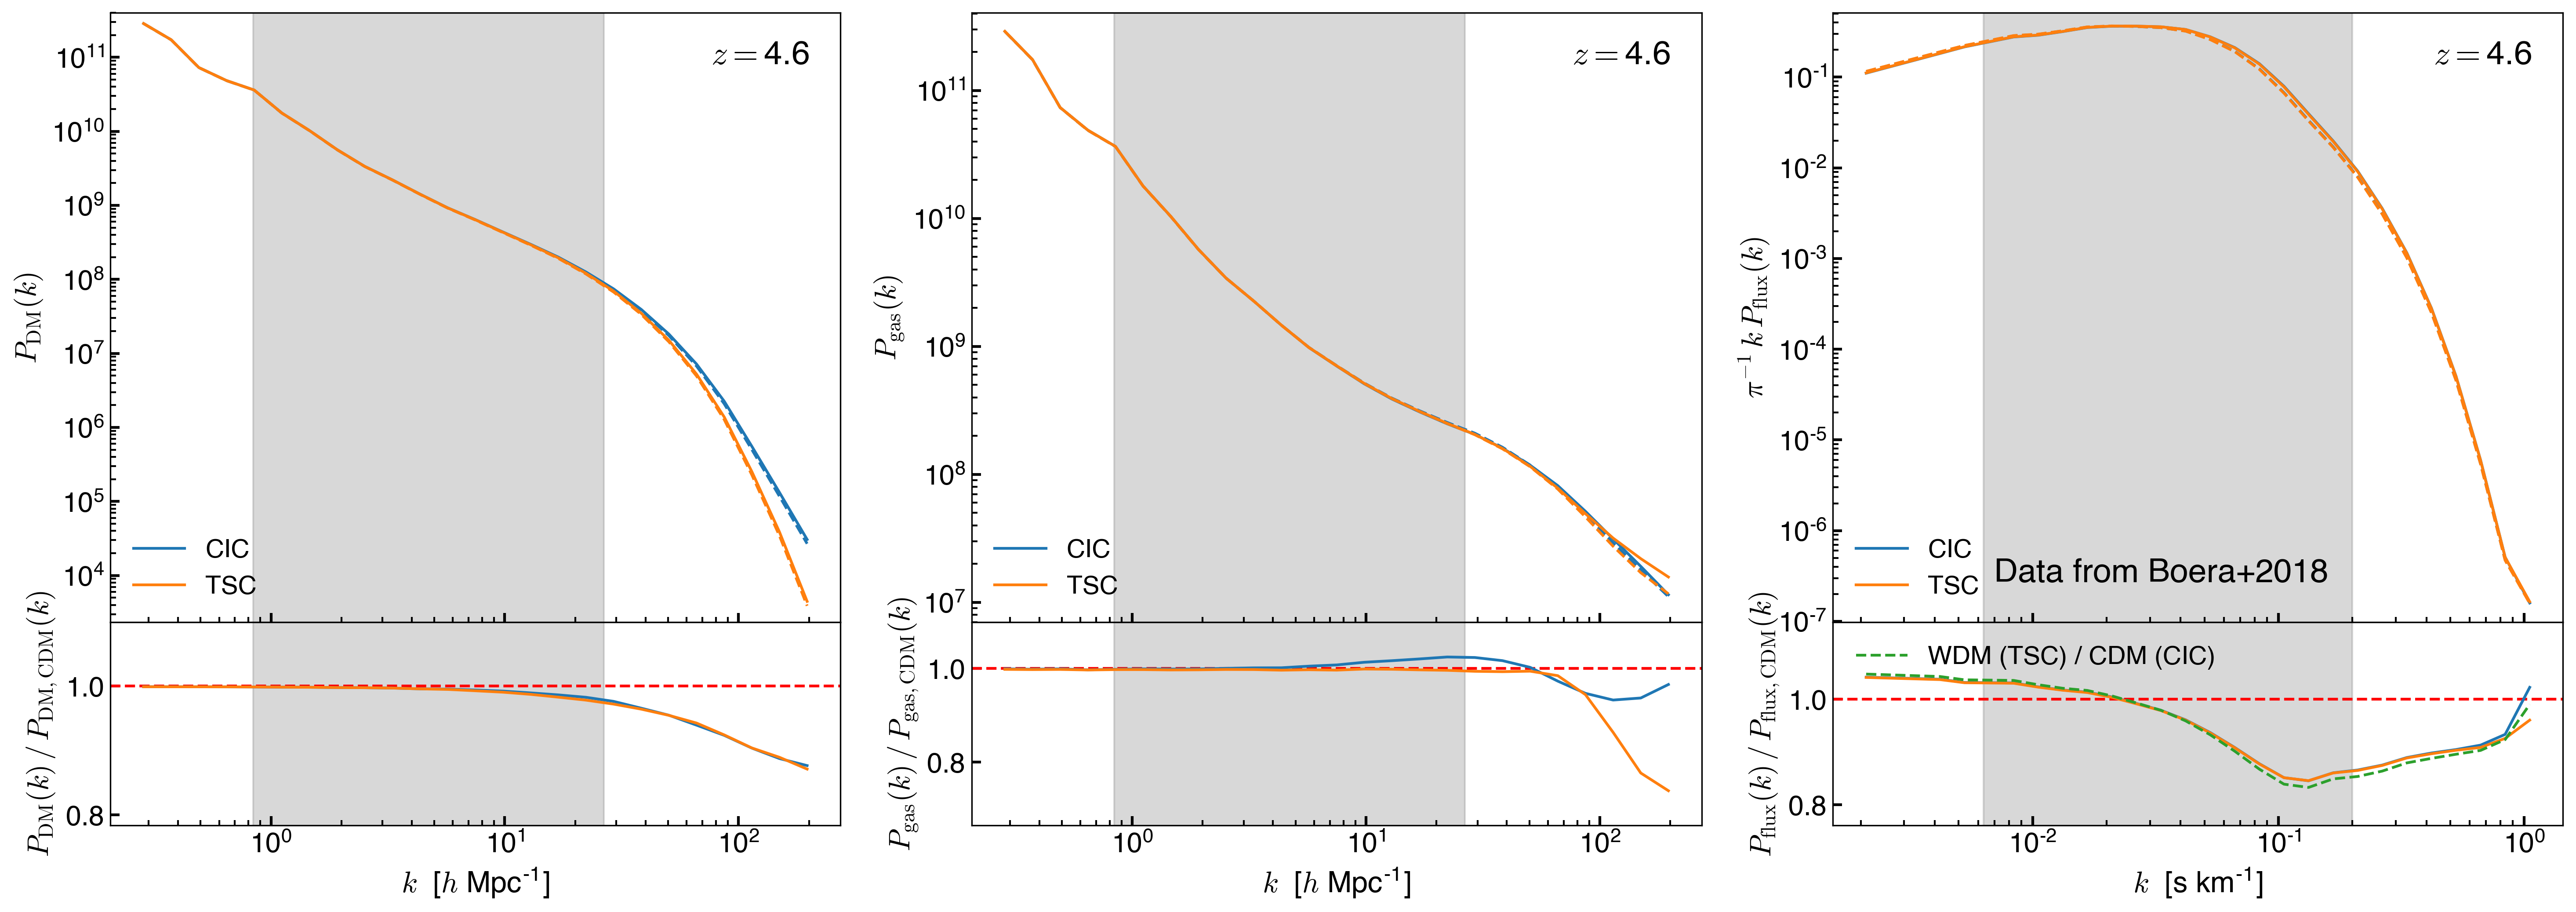
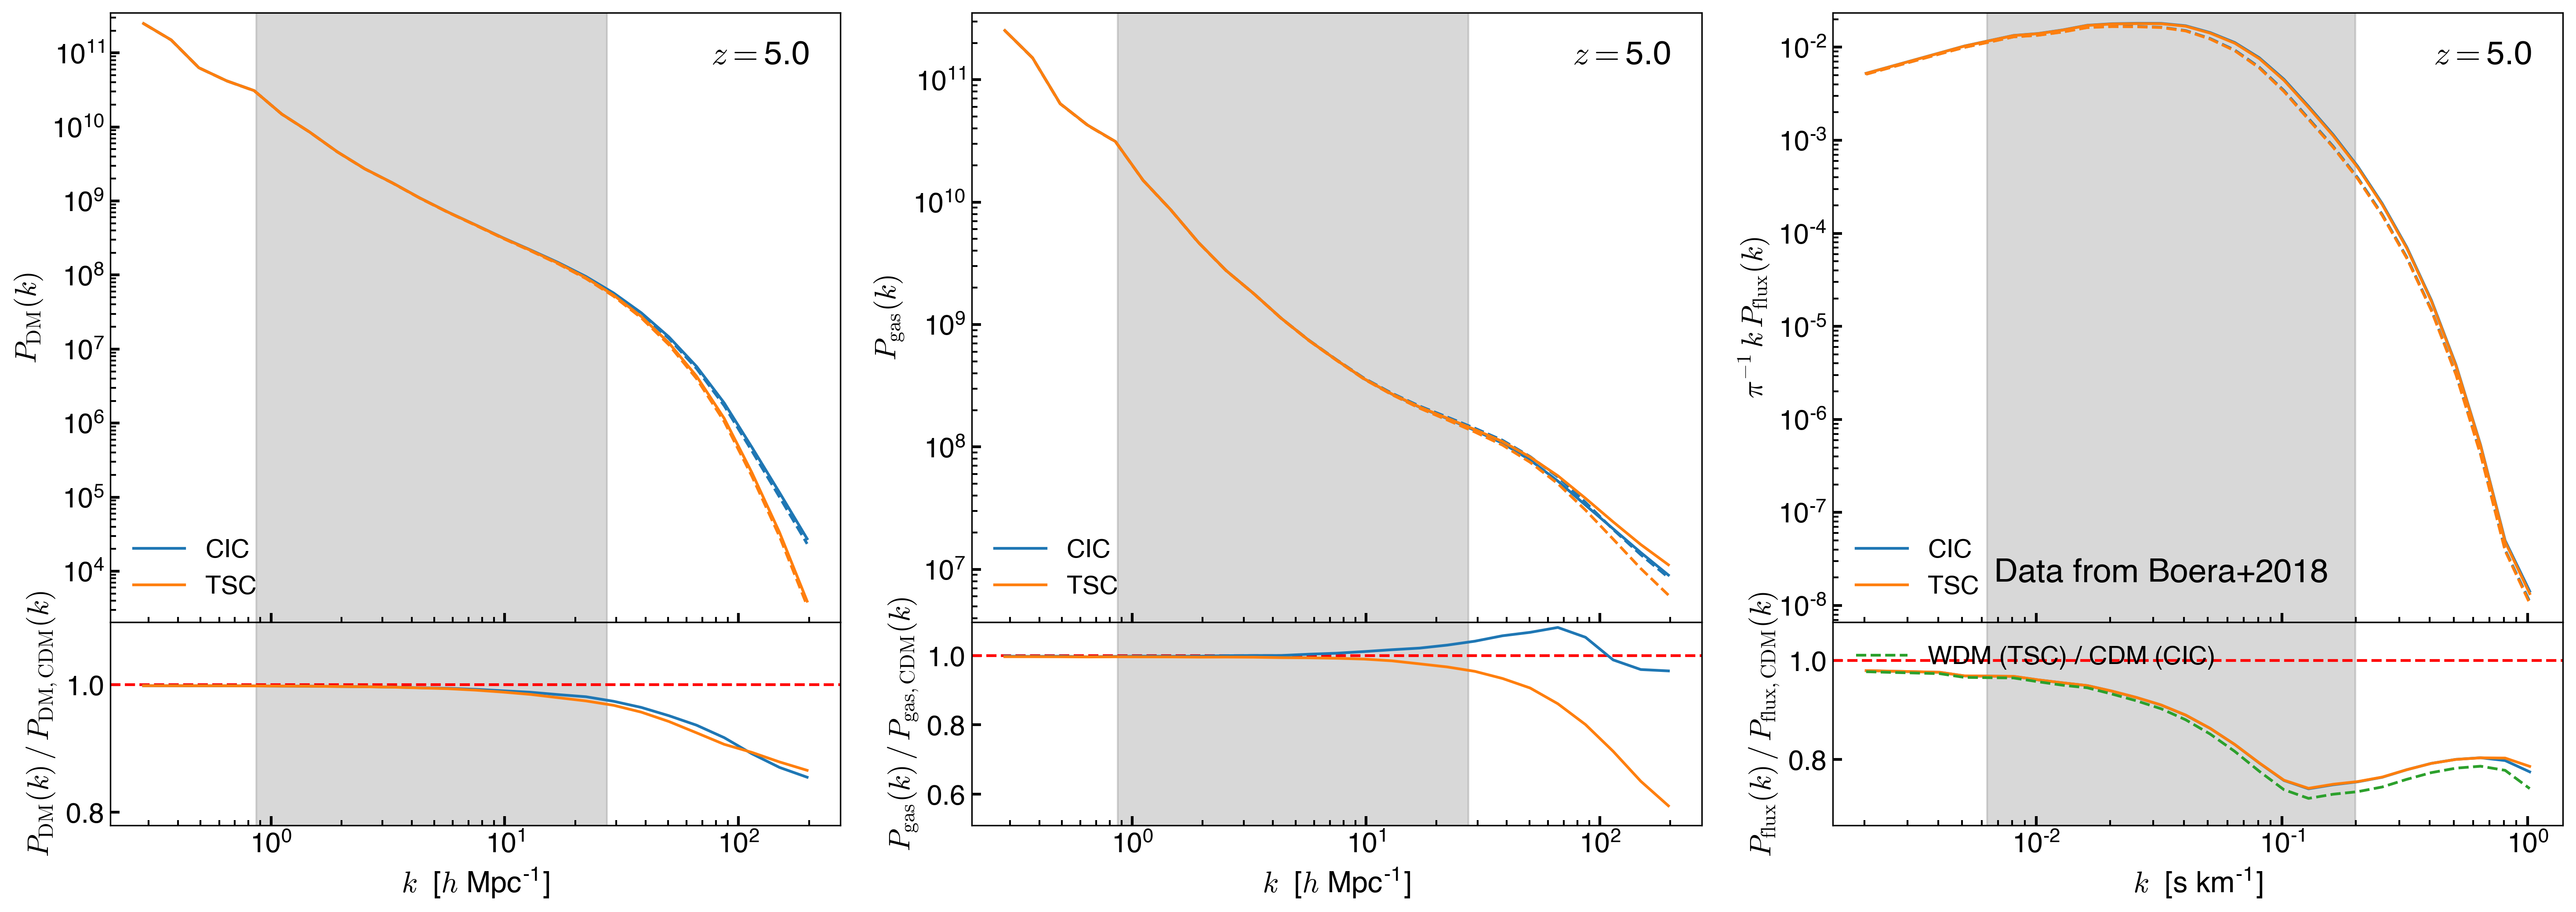
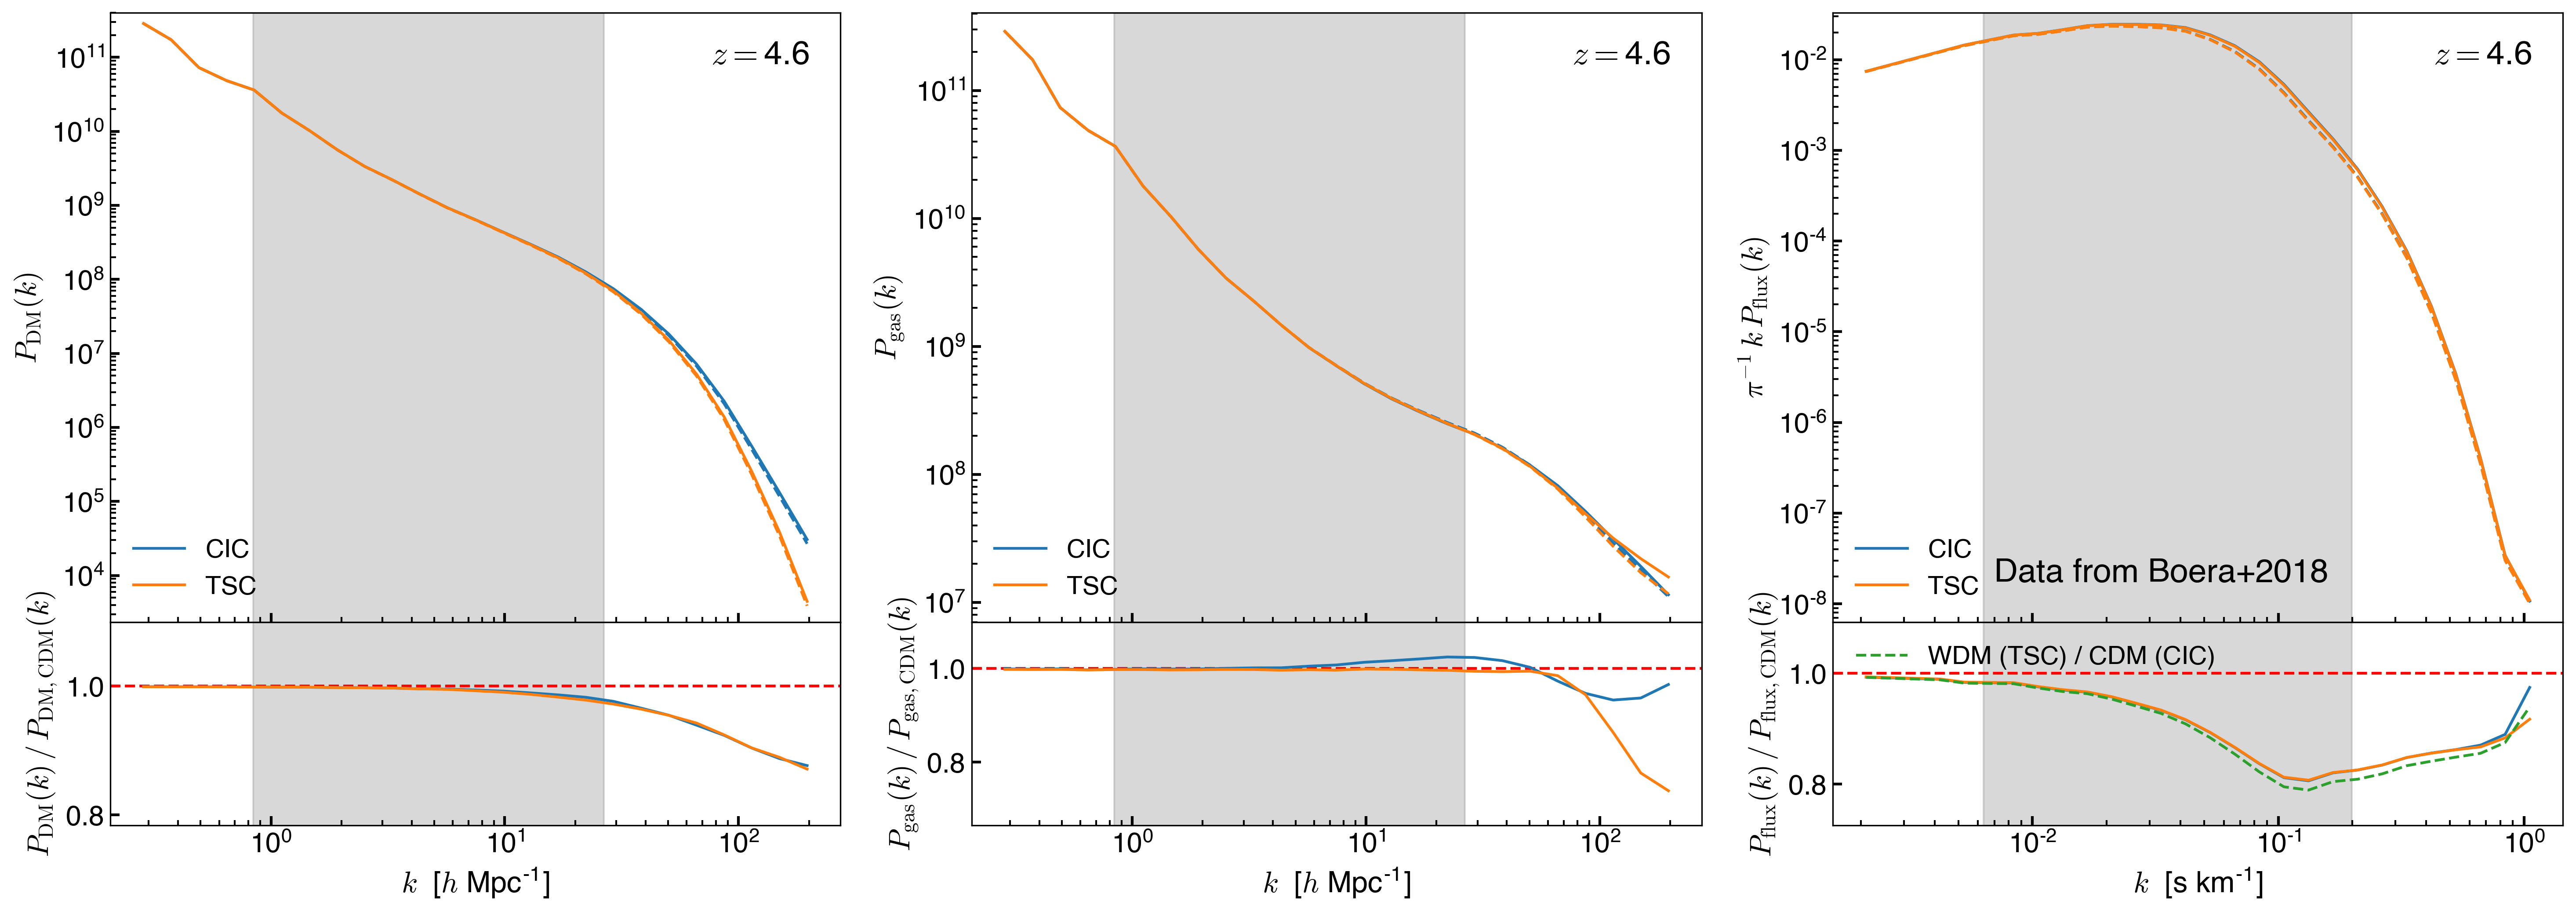
Now I compare the matter power spectrum ( DM and gas ) and also the Flux P(k) for the CIC and TSC simulations at the redshifts from the observations
The dashed lines correspond to the WDM Simulations of the CIC (blue) and TSC (orange) simulations. Full colored lines show the CDM simulations for CIC and TSC respectively.
The Bottom panels show \(P_\mathrm{WDM,\,CIC}(k) / P_\mathrm{CDM,\,CIC}(k)\) in blue and \(P_\mathrm{WDM,\,TSC}(k) / P_\mathrm{CDM,\,TSC}(k)\) in orange. The green dashed line corresponds the the ratio of the flux power spectrum \(P_\mathrm{WDM,\,TSC}(k) / P_\mathrm{CDM,\,CIC}(k)\) and it shows that the Flux power spectrum is not significantly sensible the the choice of CIC or TSC.
z= 5.0
z= 4.6
z= 4.2
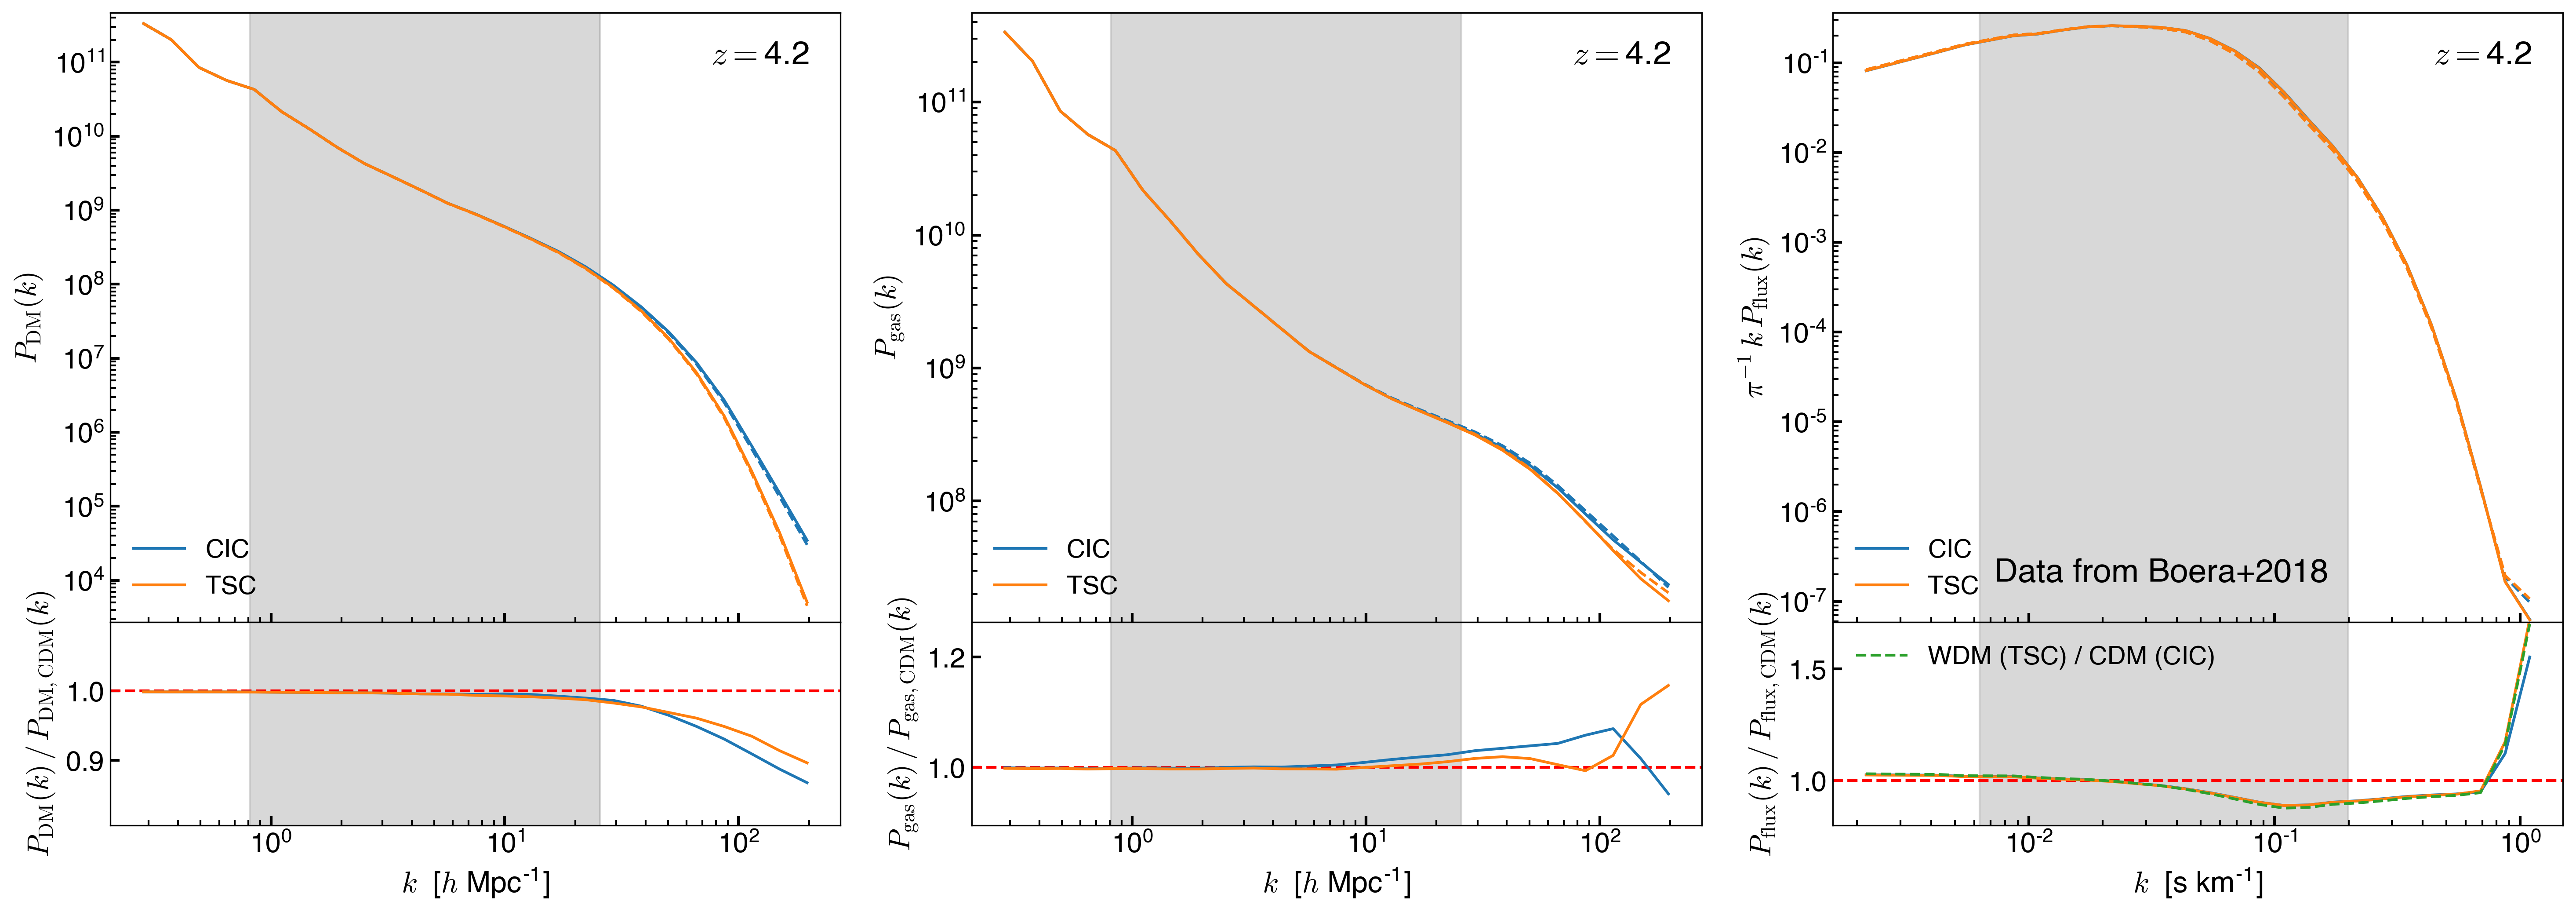
Despite some differences in the gas matter power spectrum between CIC and TSC, the flux power spectrum shows only small differences on the scales probed by the observations and the flattening for \(k>0.1 \mathrm{s / km}\) is still present even when comparing the TSC WDM simulation to the CIC CDM simulation. This shows that the flattening at \(k>0.1 \mathrm{s / km}\) might not be caused by the excess power due to the CIC deposition.
Power Spectrum of the Un-Normalized Flux
Here the flux power spectrum is taken directly from \(F\) instead of from \(F/\bar{F}\)
z= 5.0
z= 4.6
z= 4.2
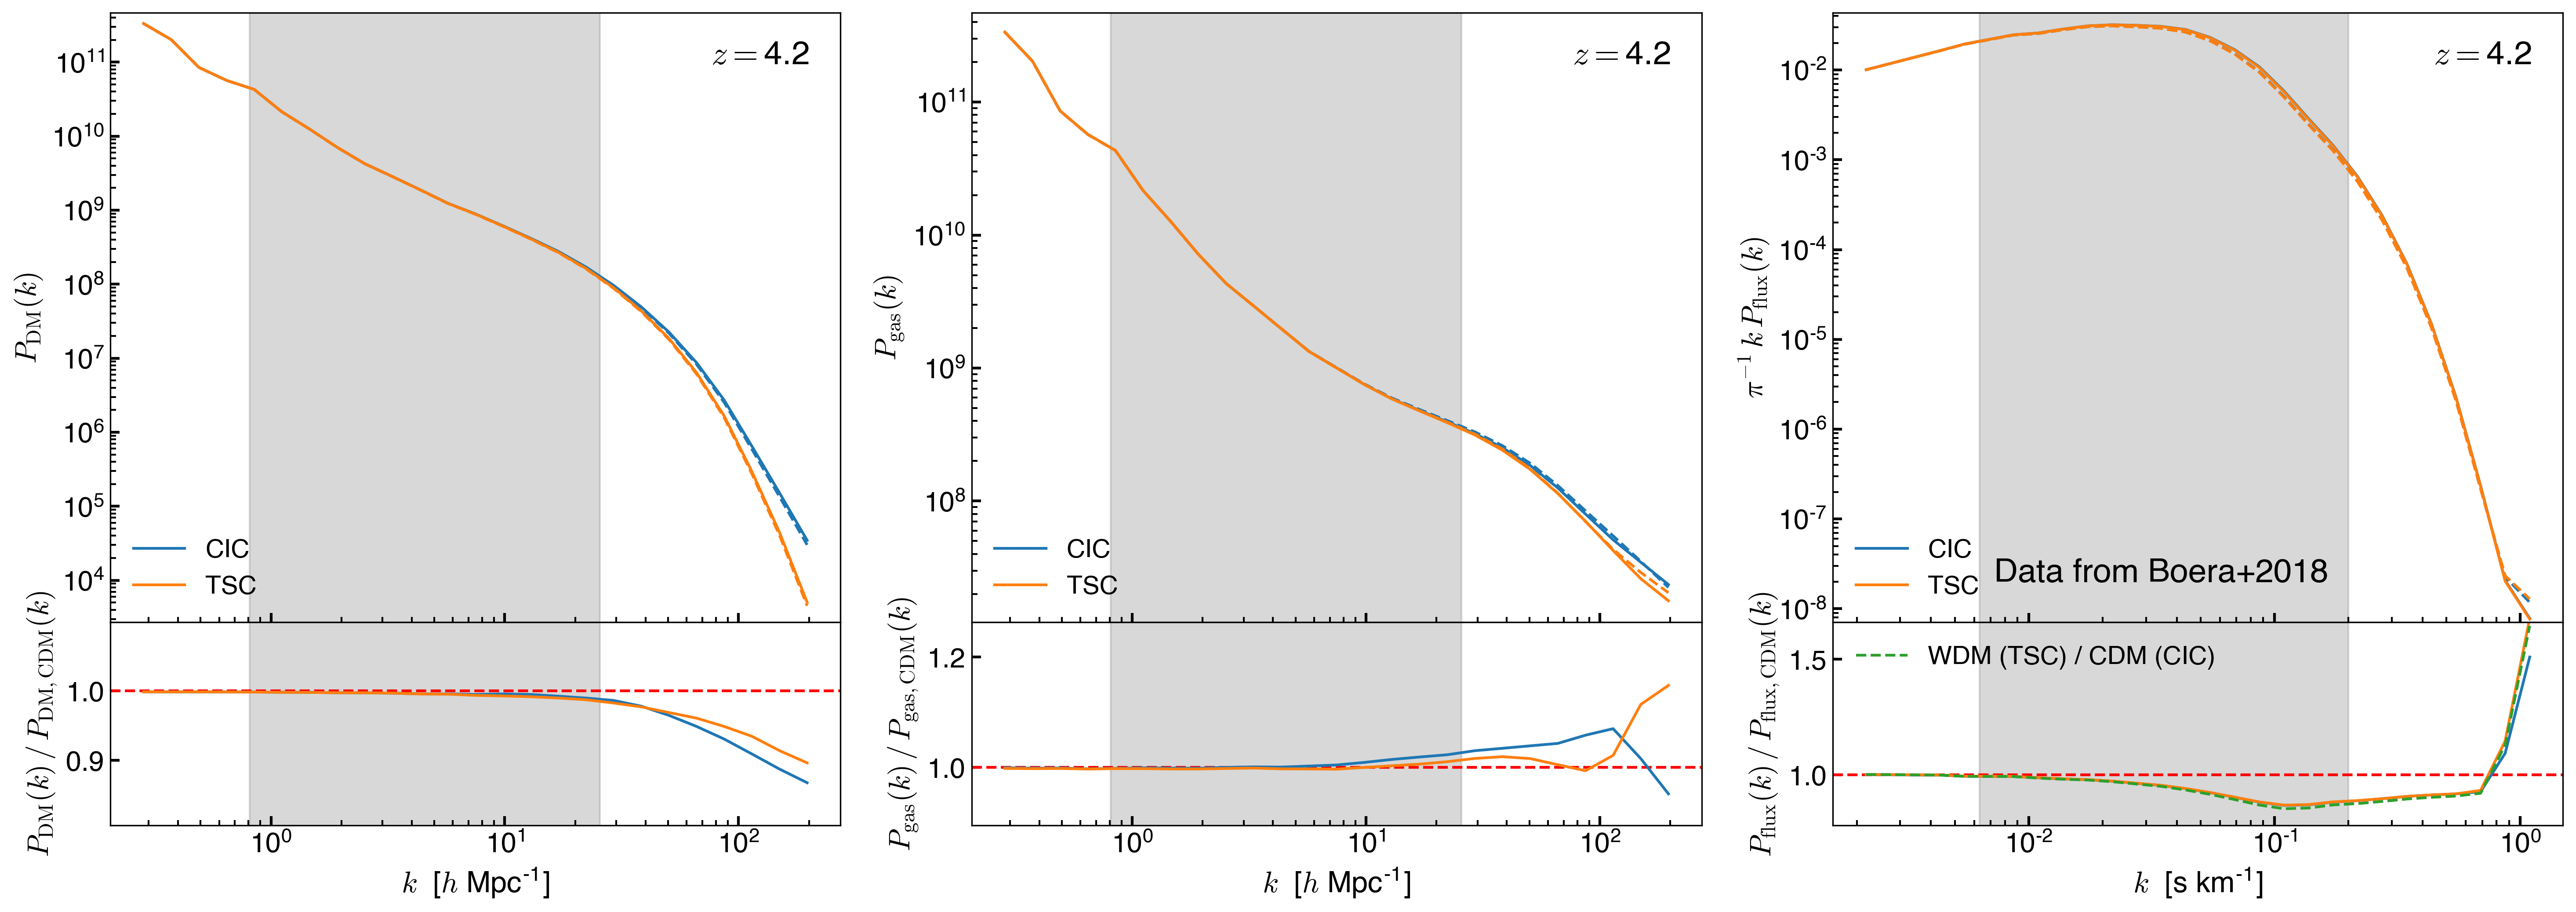
There are still differences on large scales from WDM respect to CDM