WDM Grid compared to Boera P(k) Revised
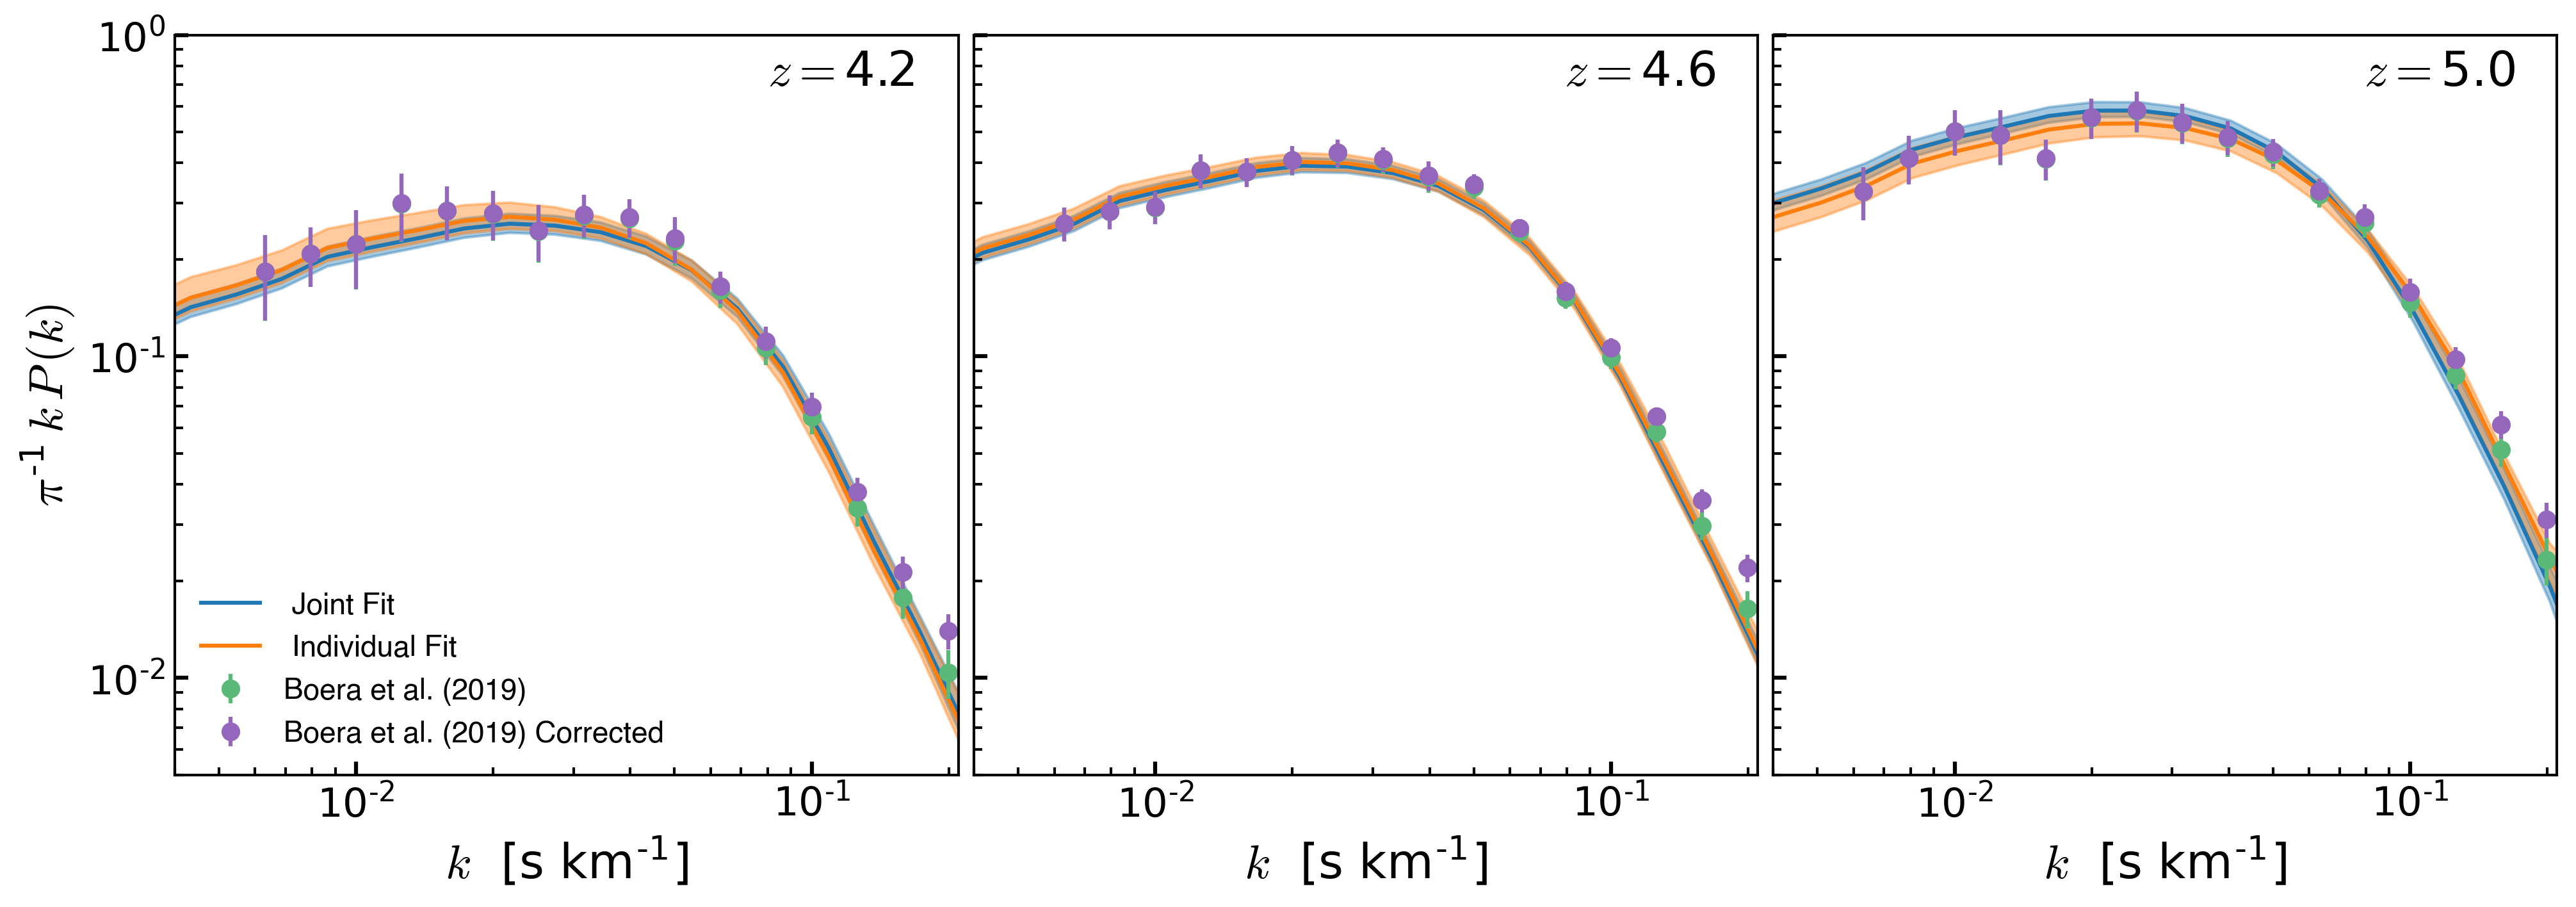
In her paper Boera reports two measurements of the powers spectrum, one of the is corrected for instrument resolution.
Using the corrected measurement to do the fit:
CDM Fit to Boera
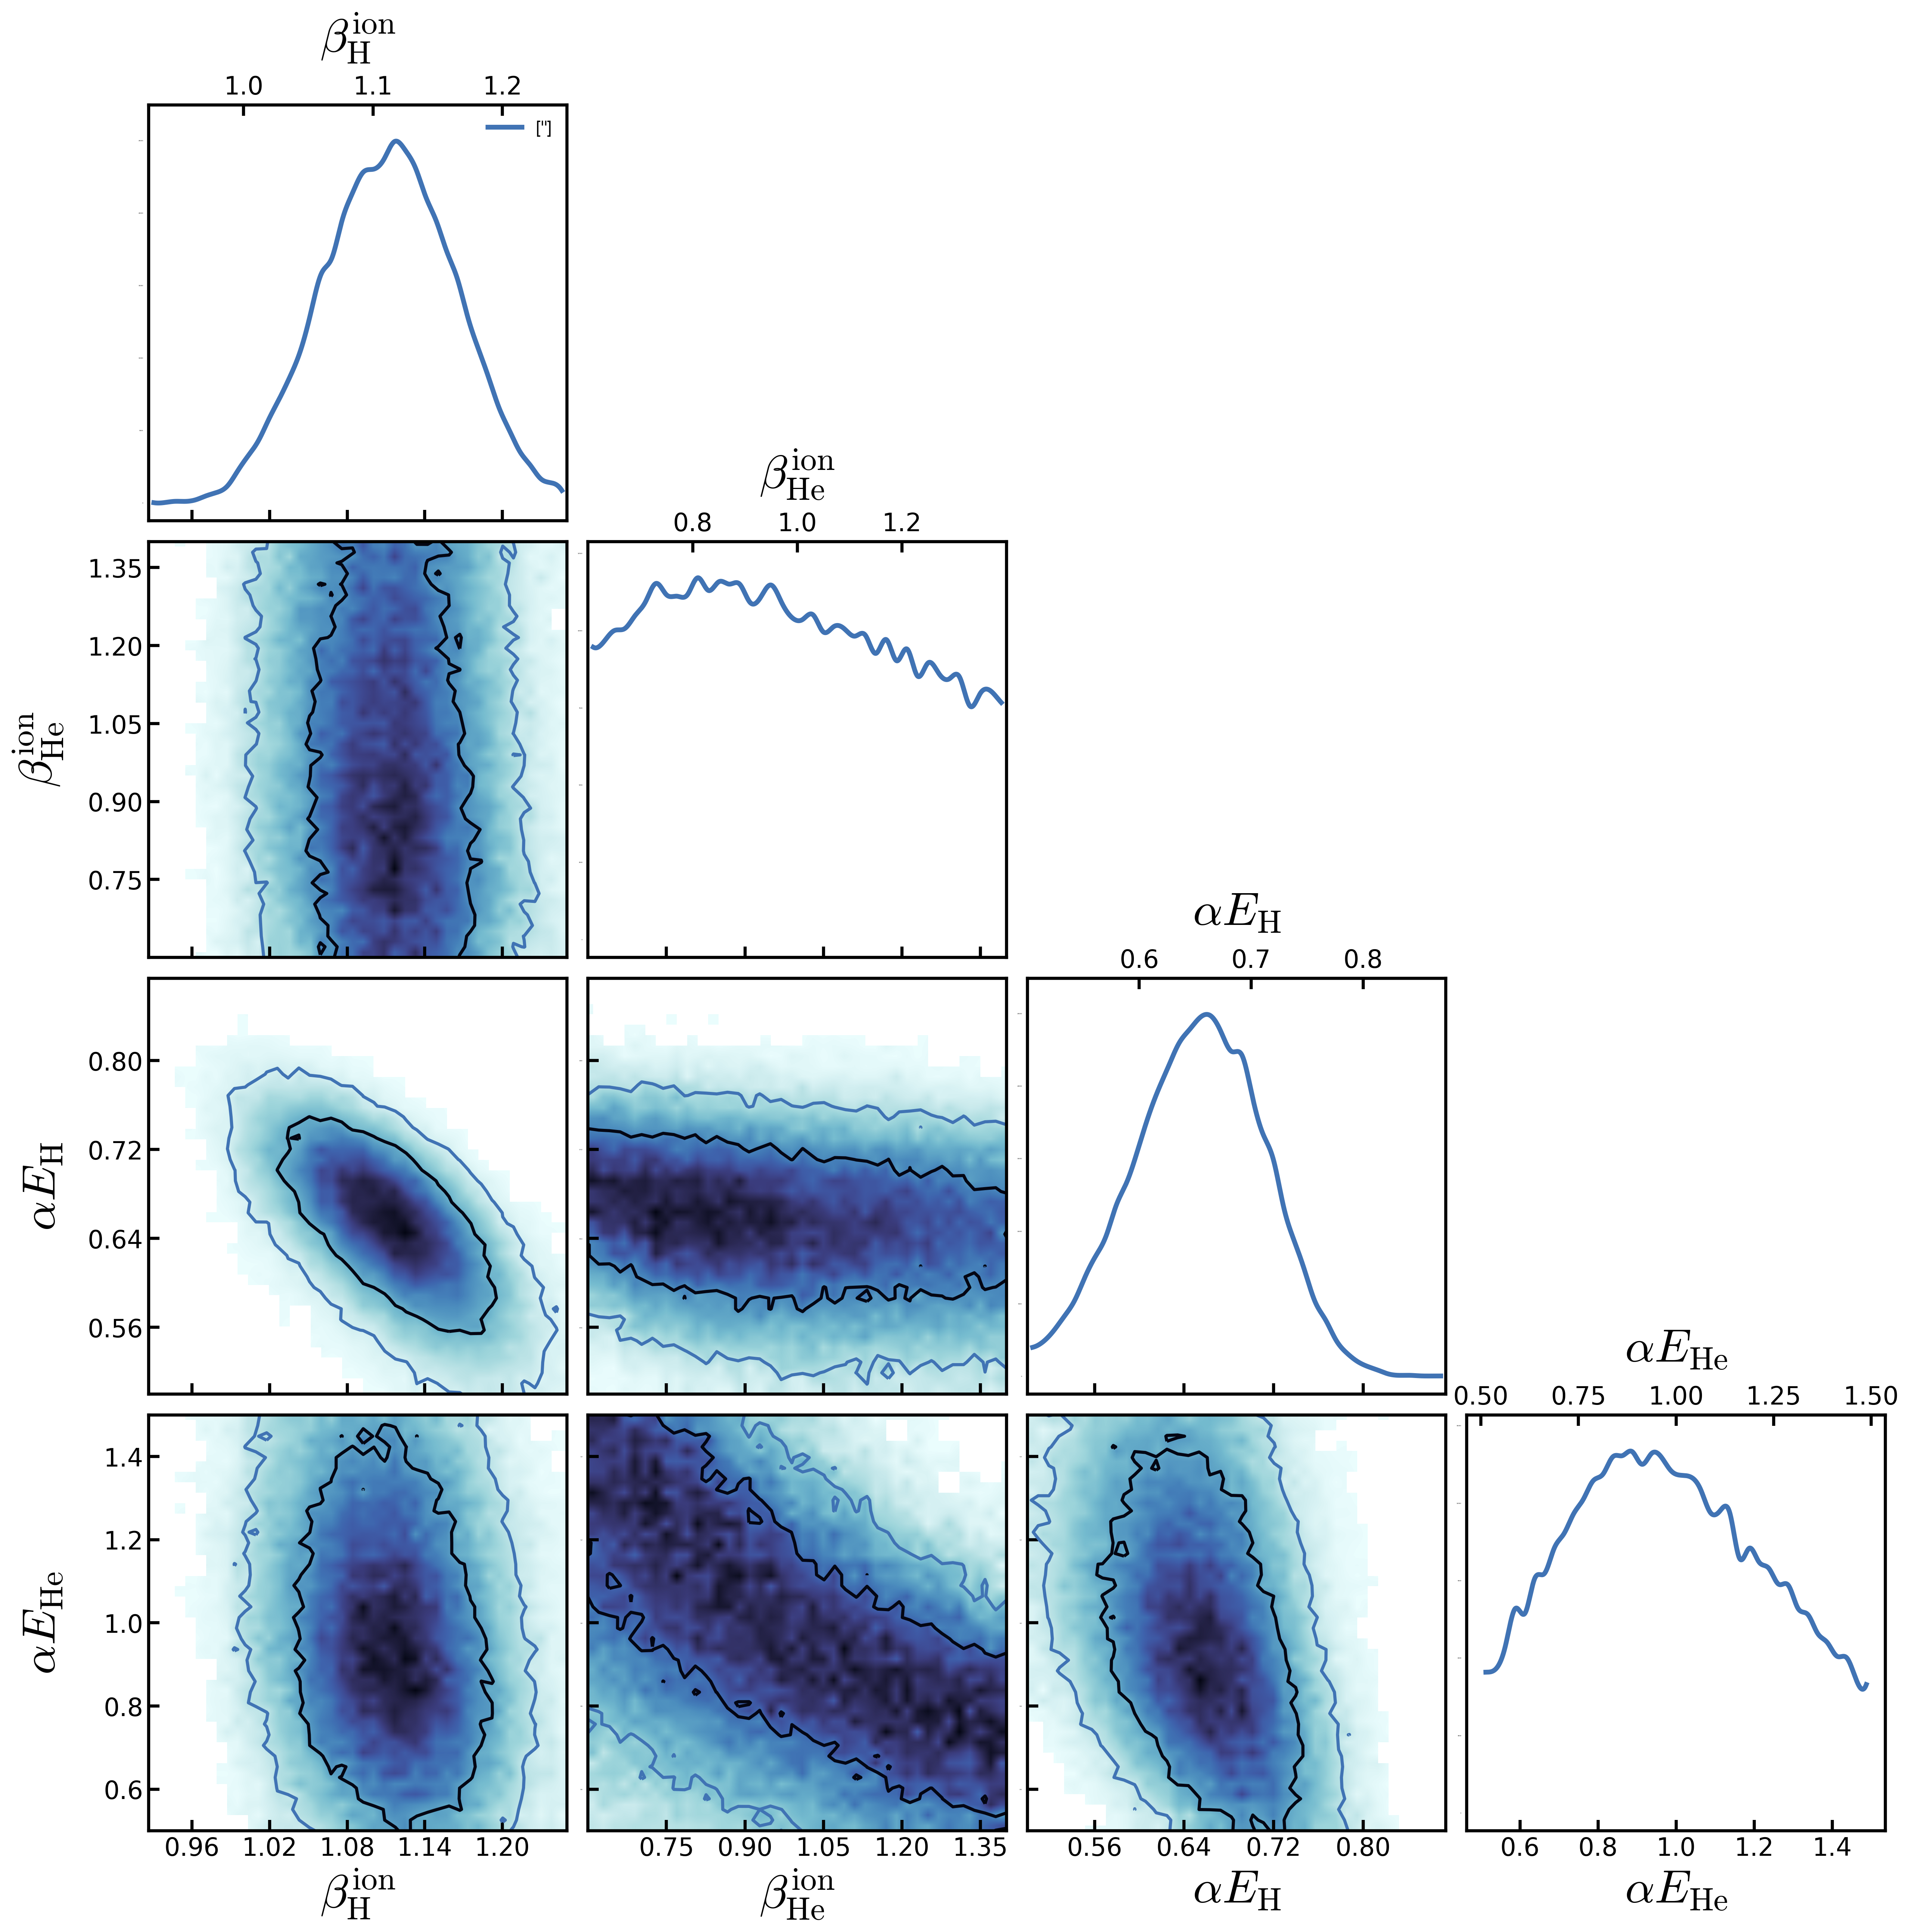
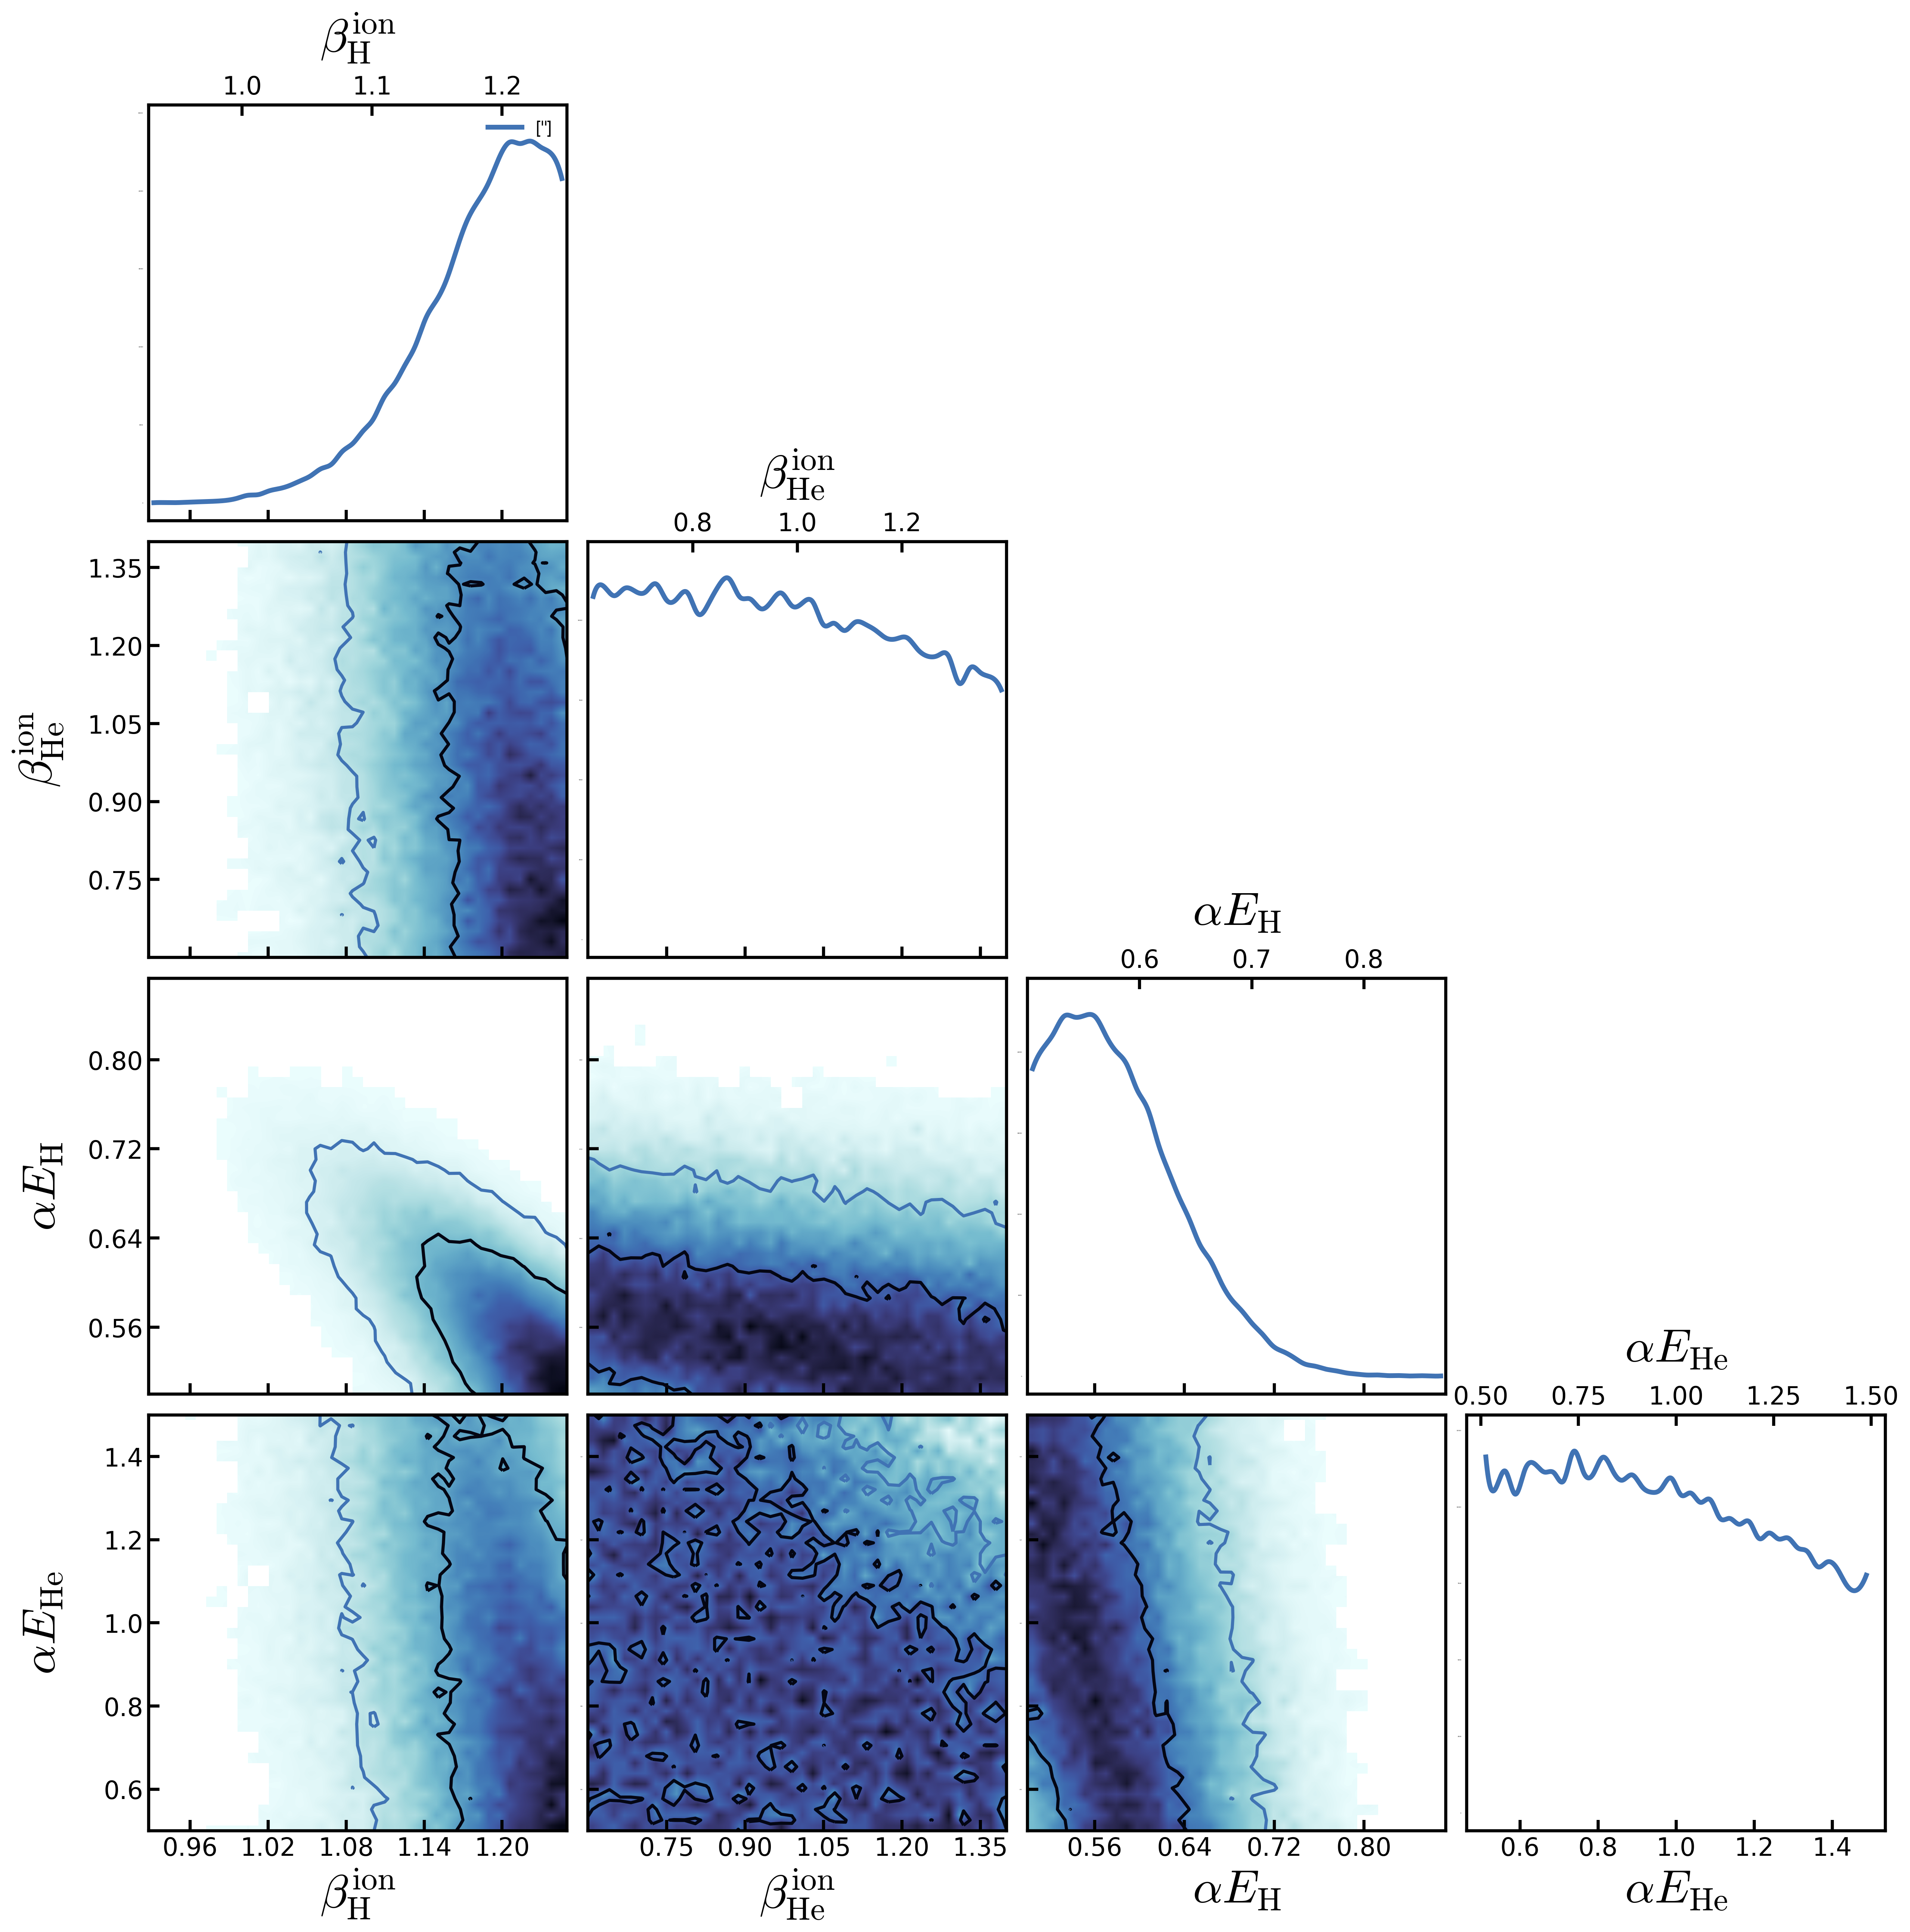
Parameters Distribution Joint Fit to all redshifts
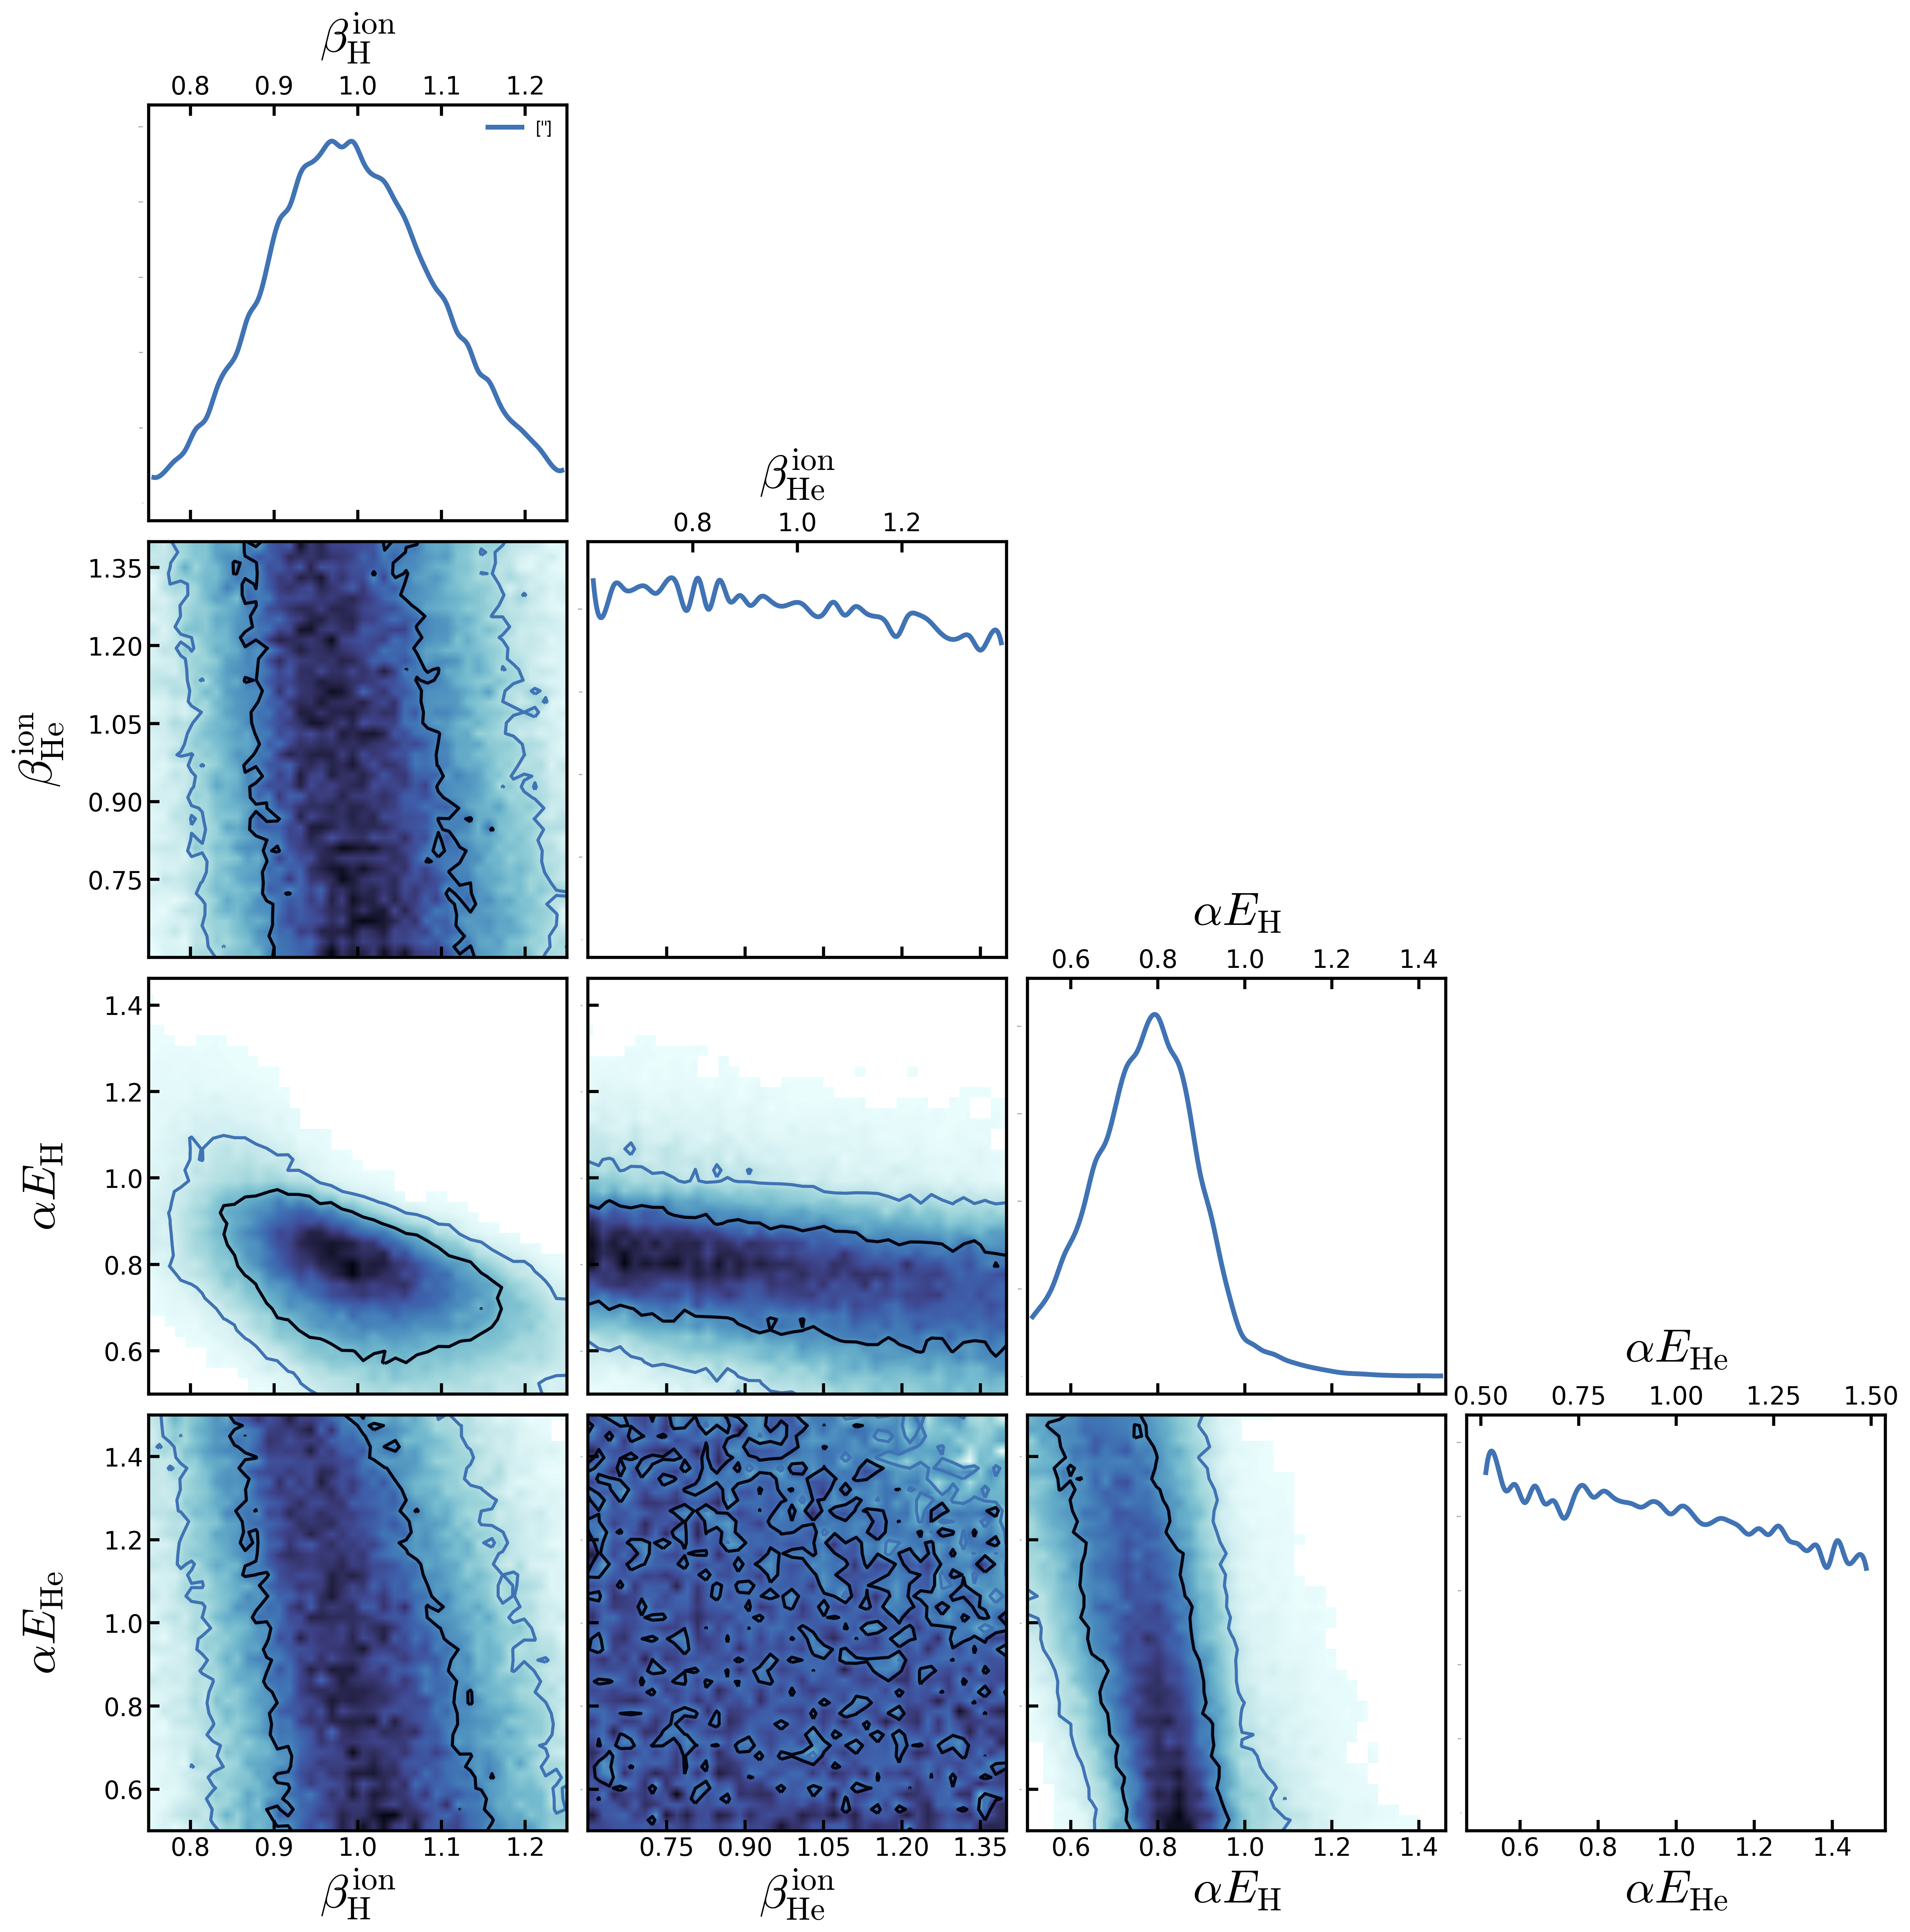
Parameters Distribution Fit to \(z=4.2\)
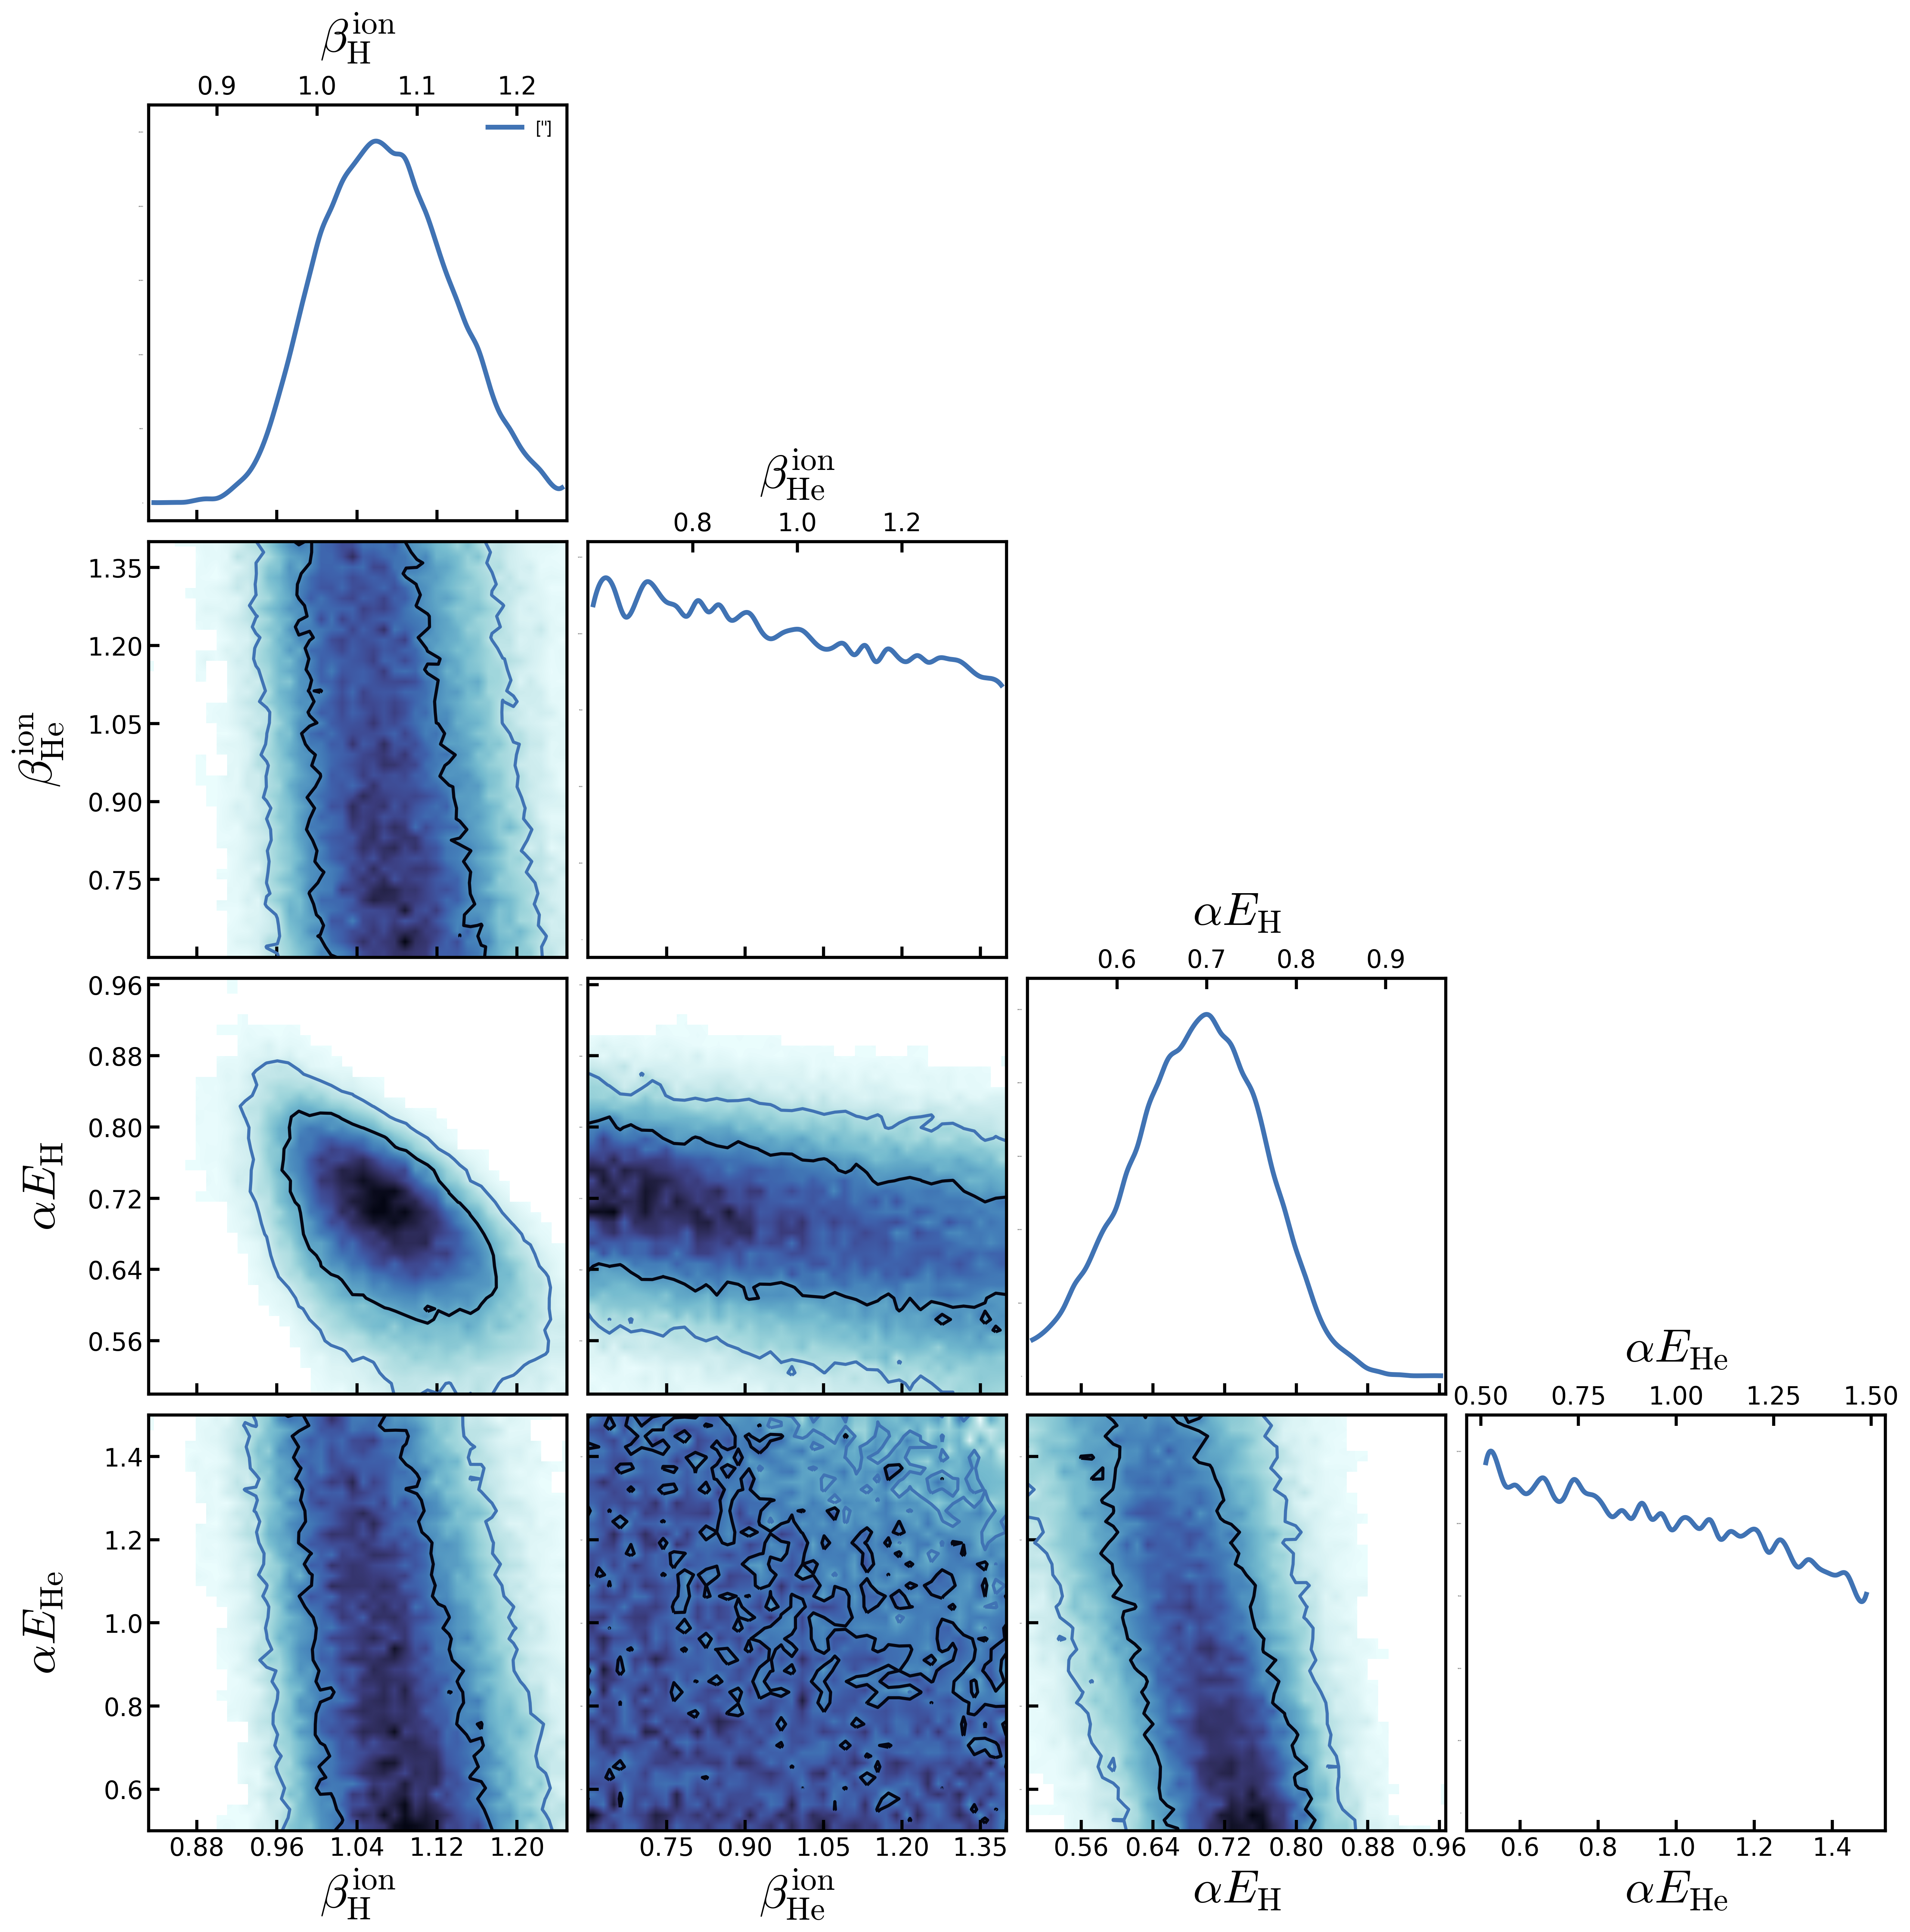
Parameters Distribution Fit to \(z=4.6\)
Parameters Distribution Fit to \(z=5.0\)
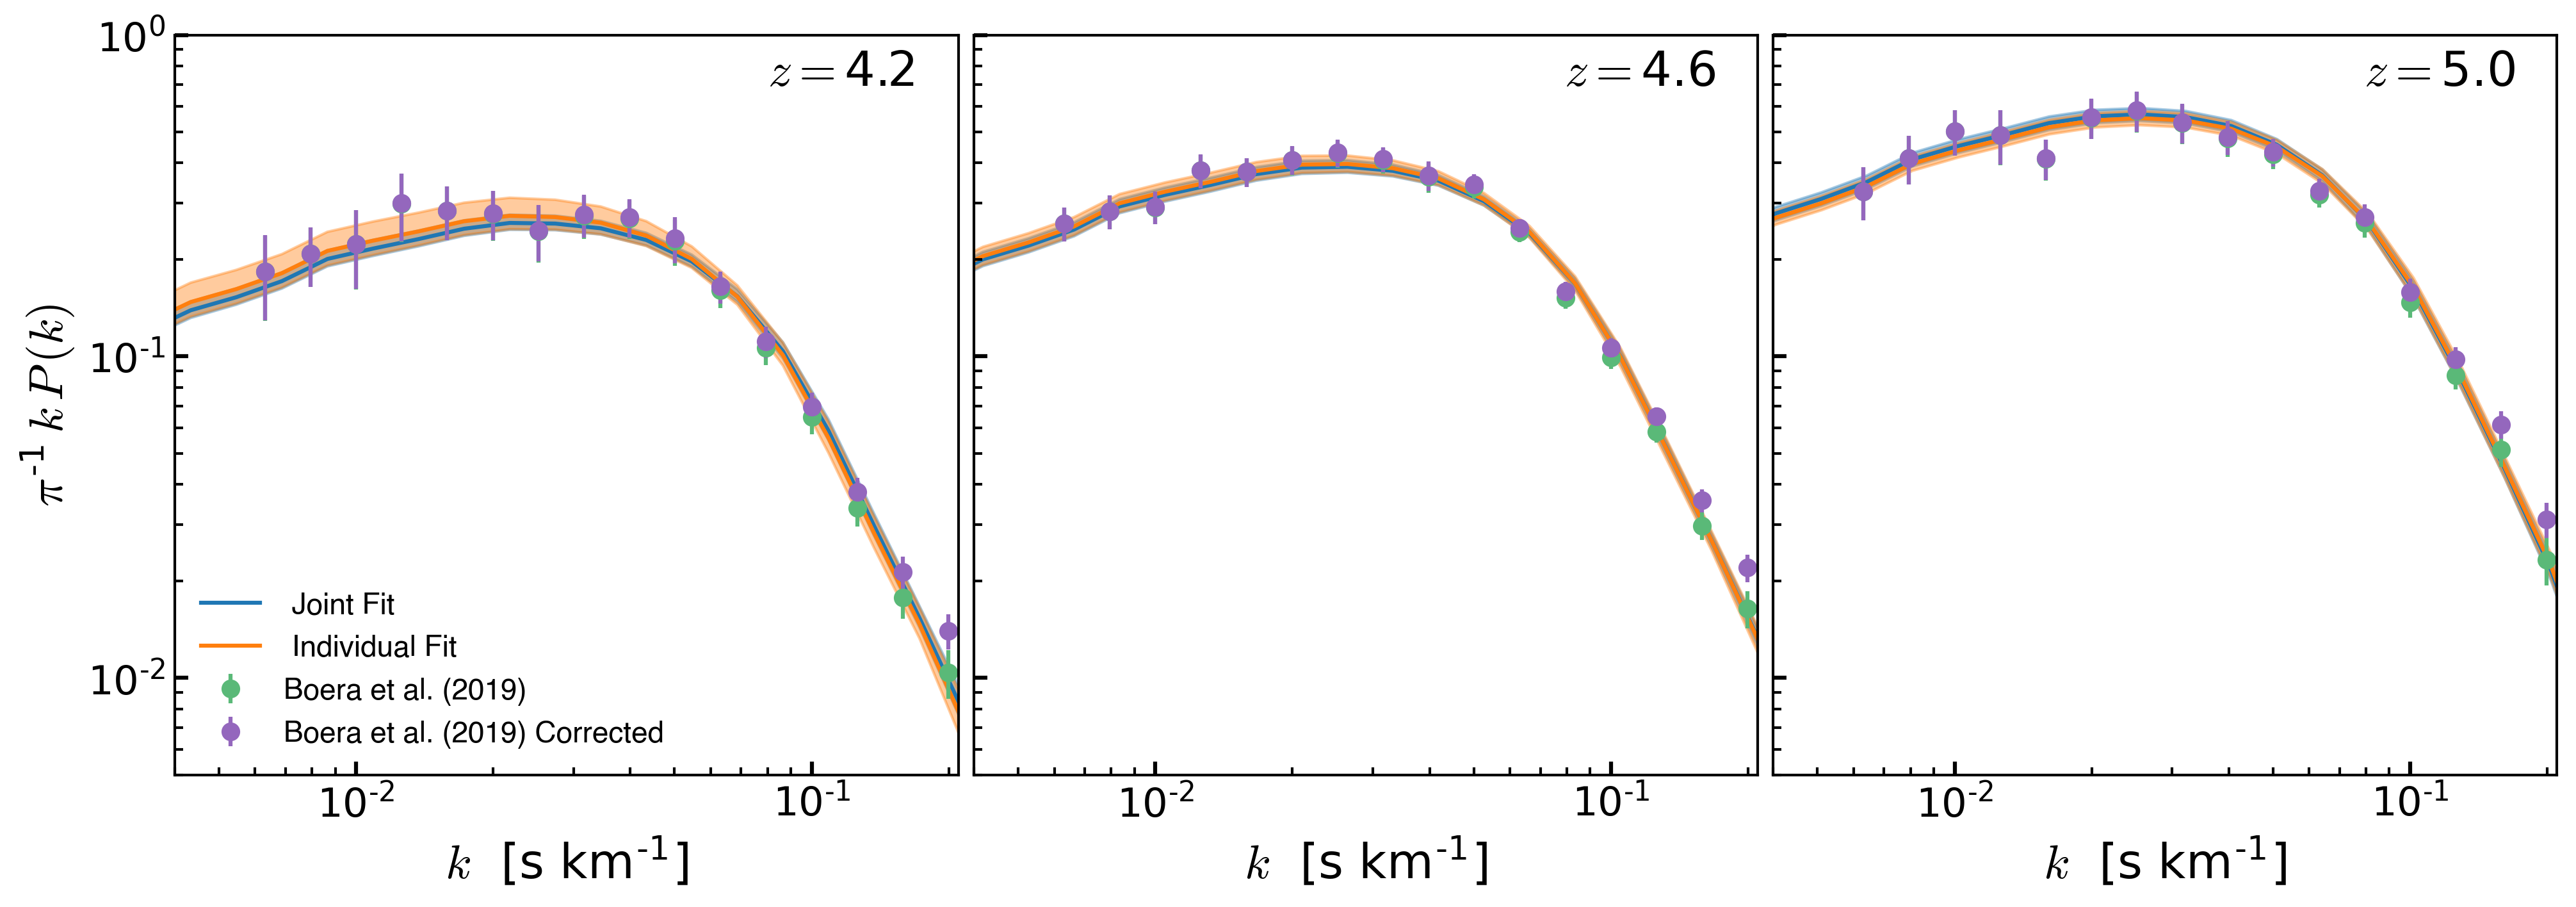
Power Spectrum
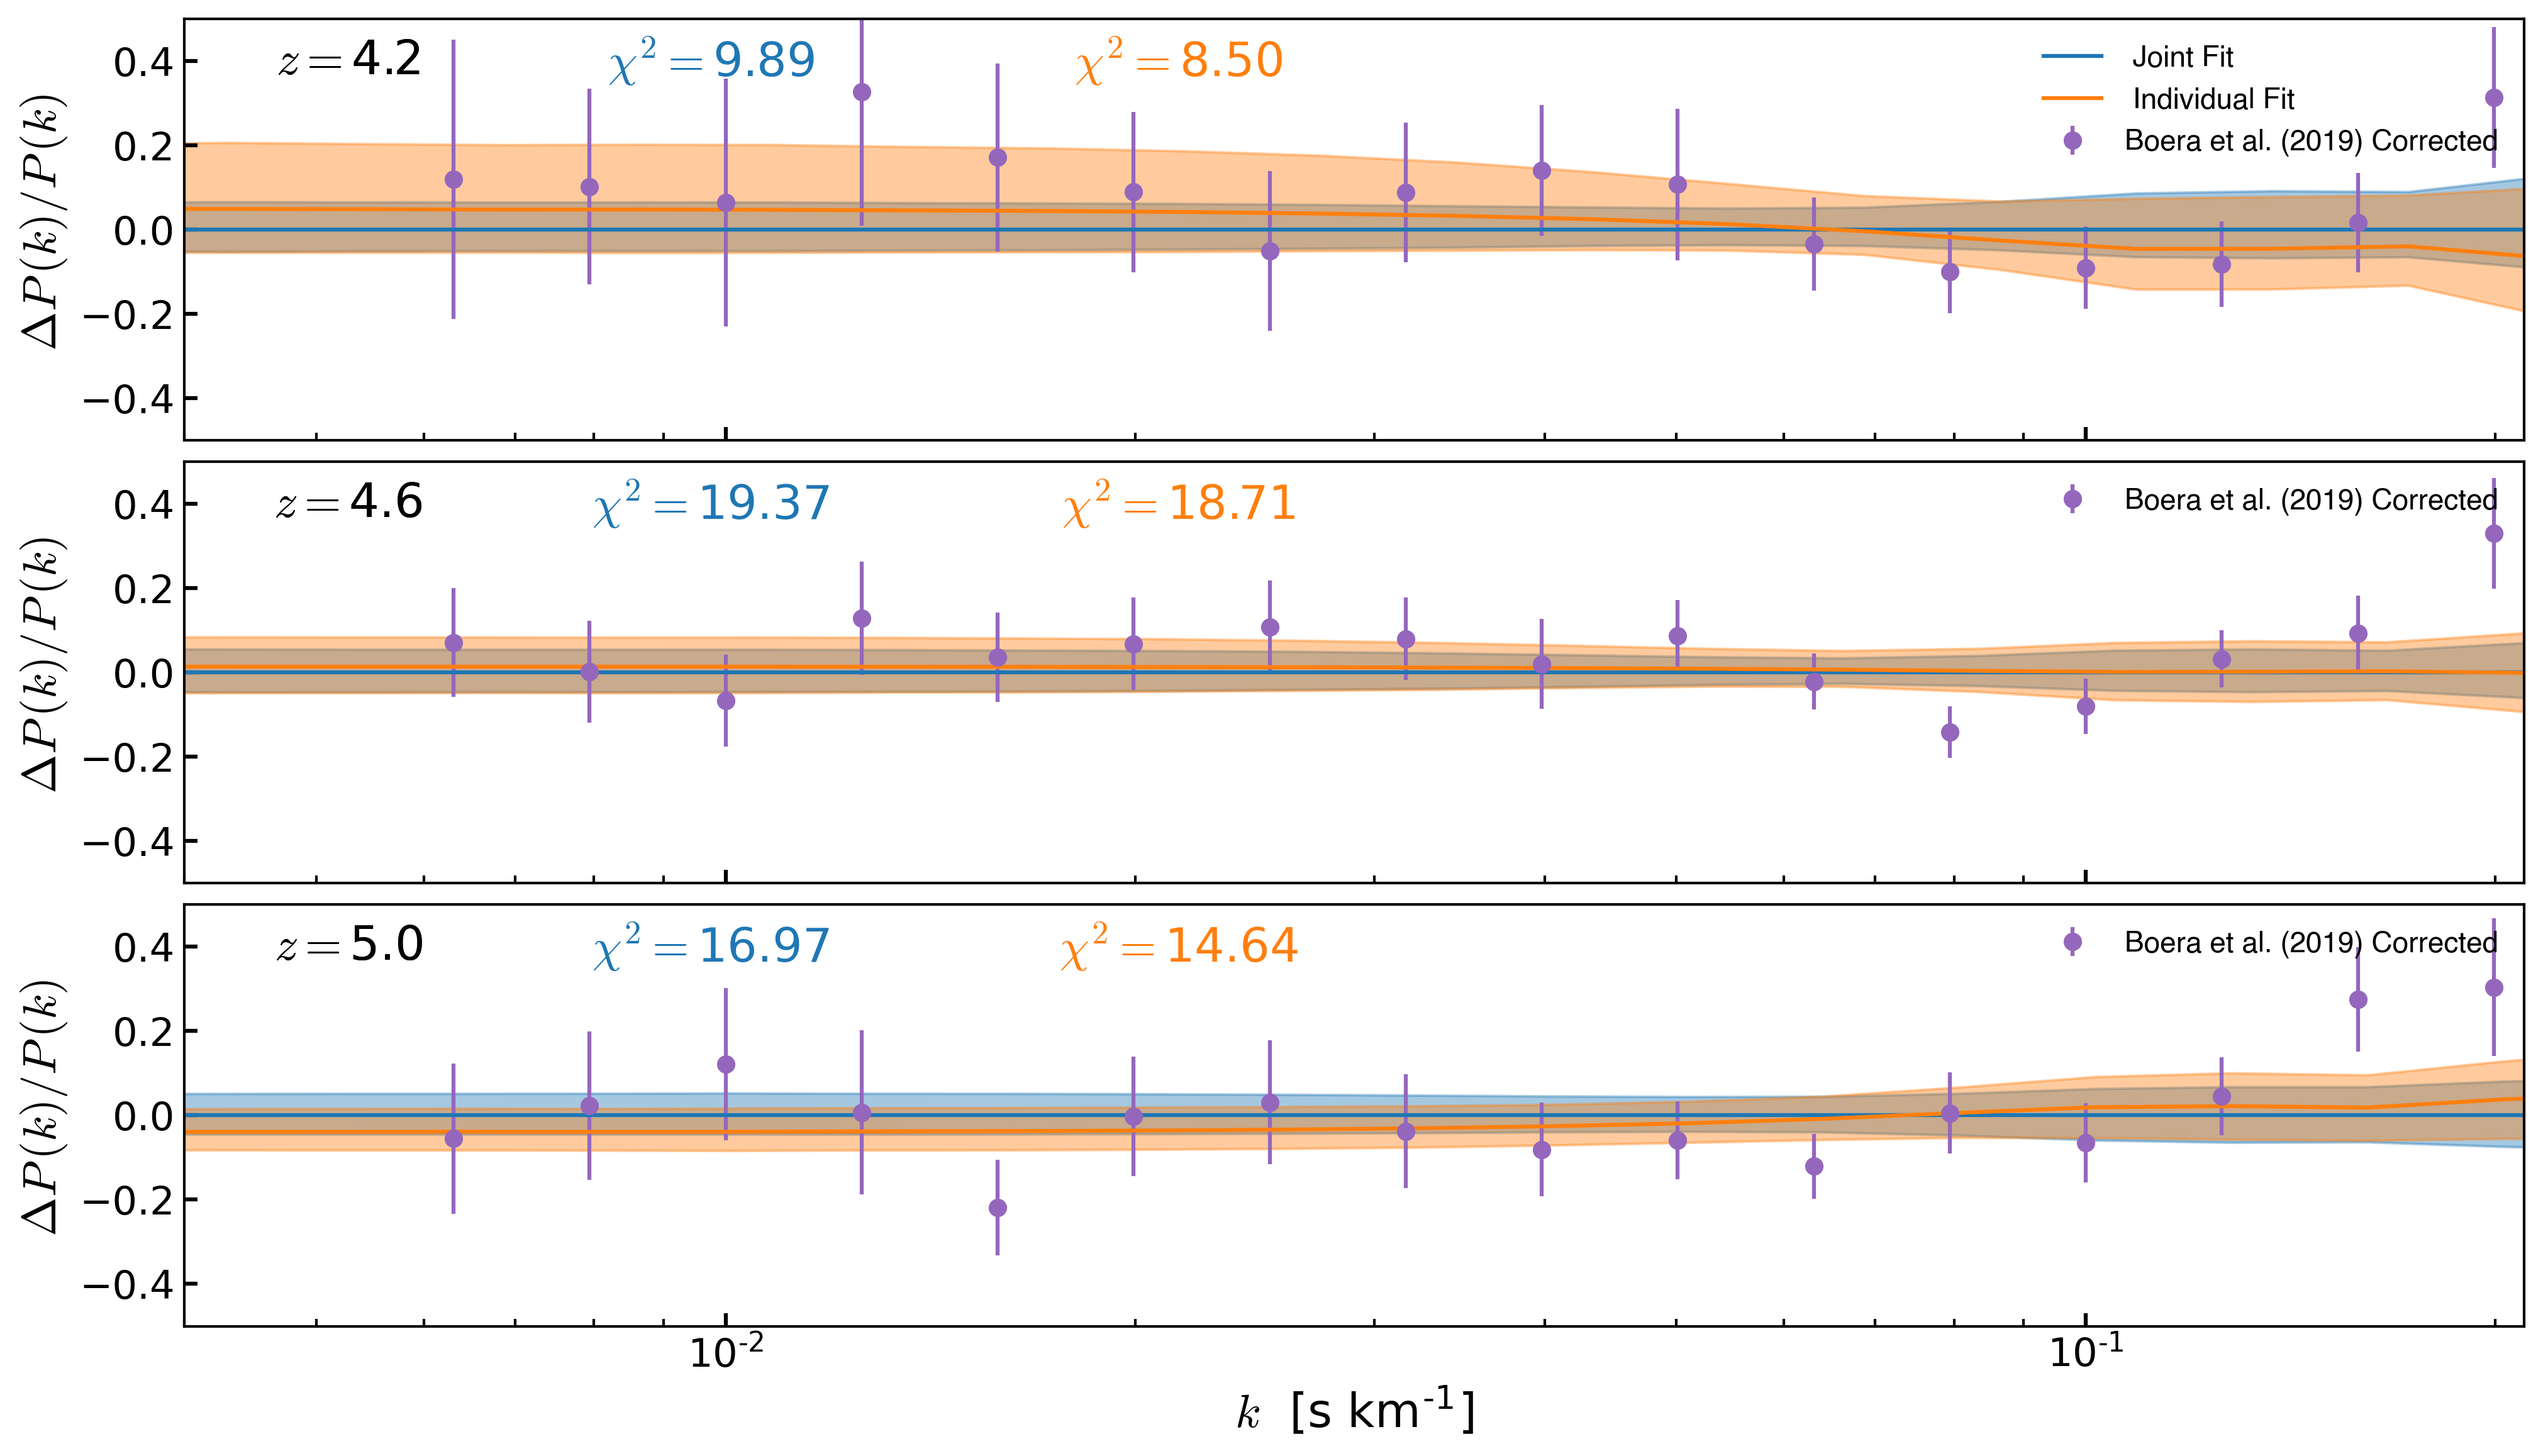
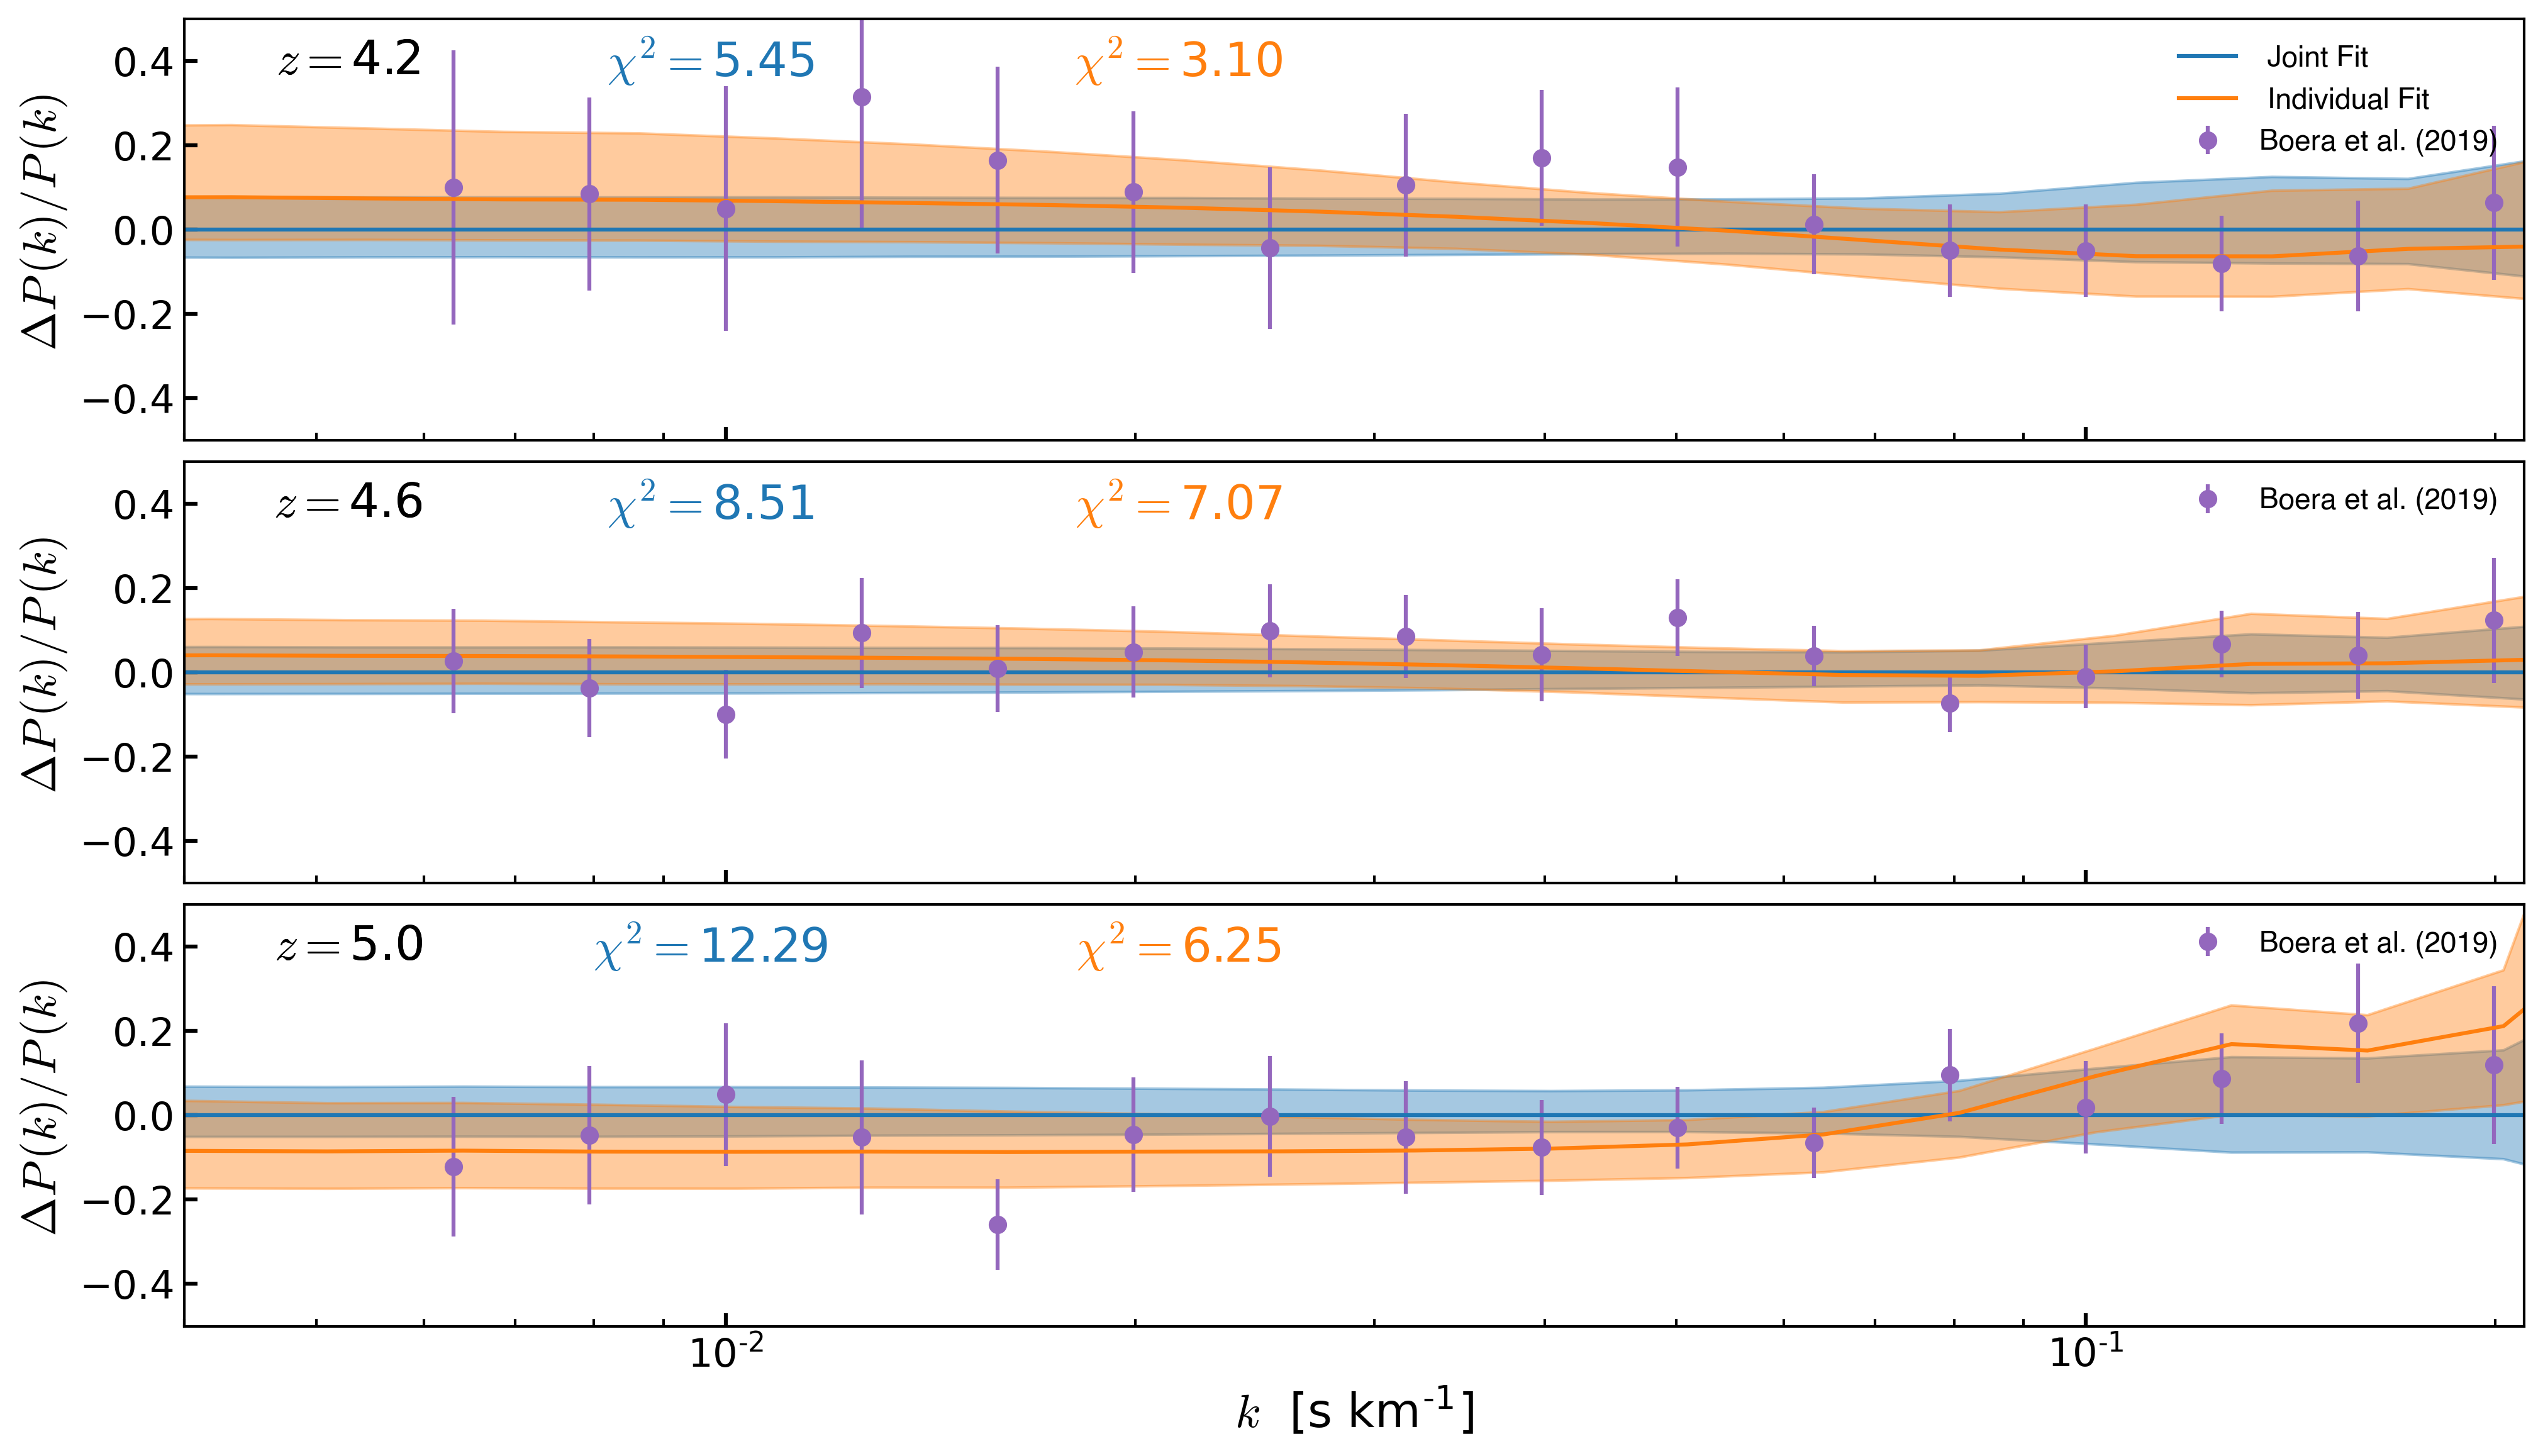
Power Spectrum Difference
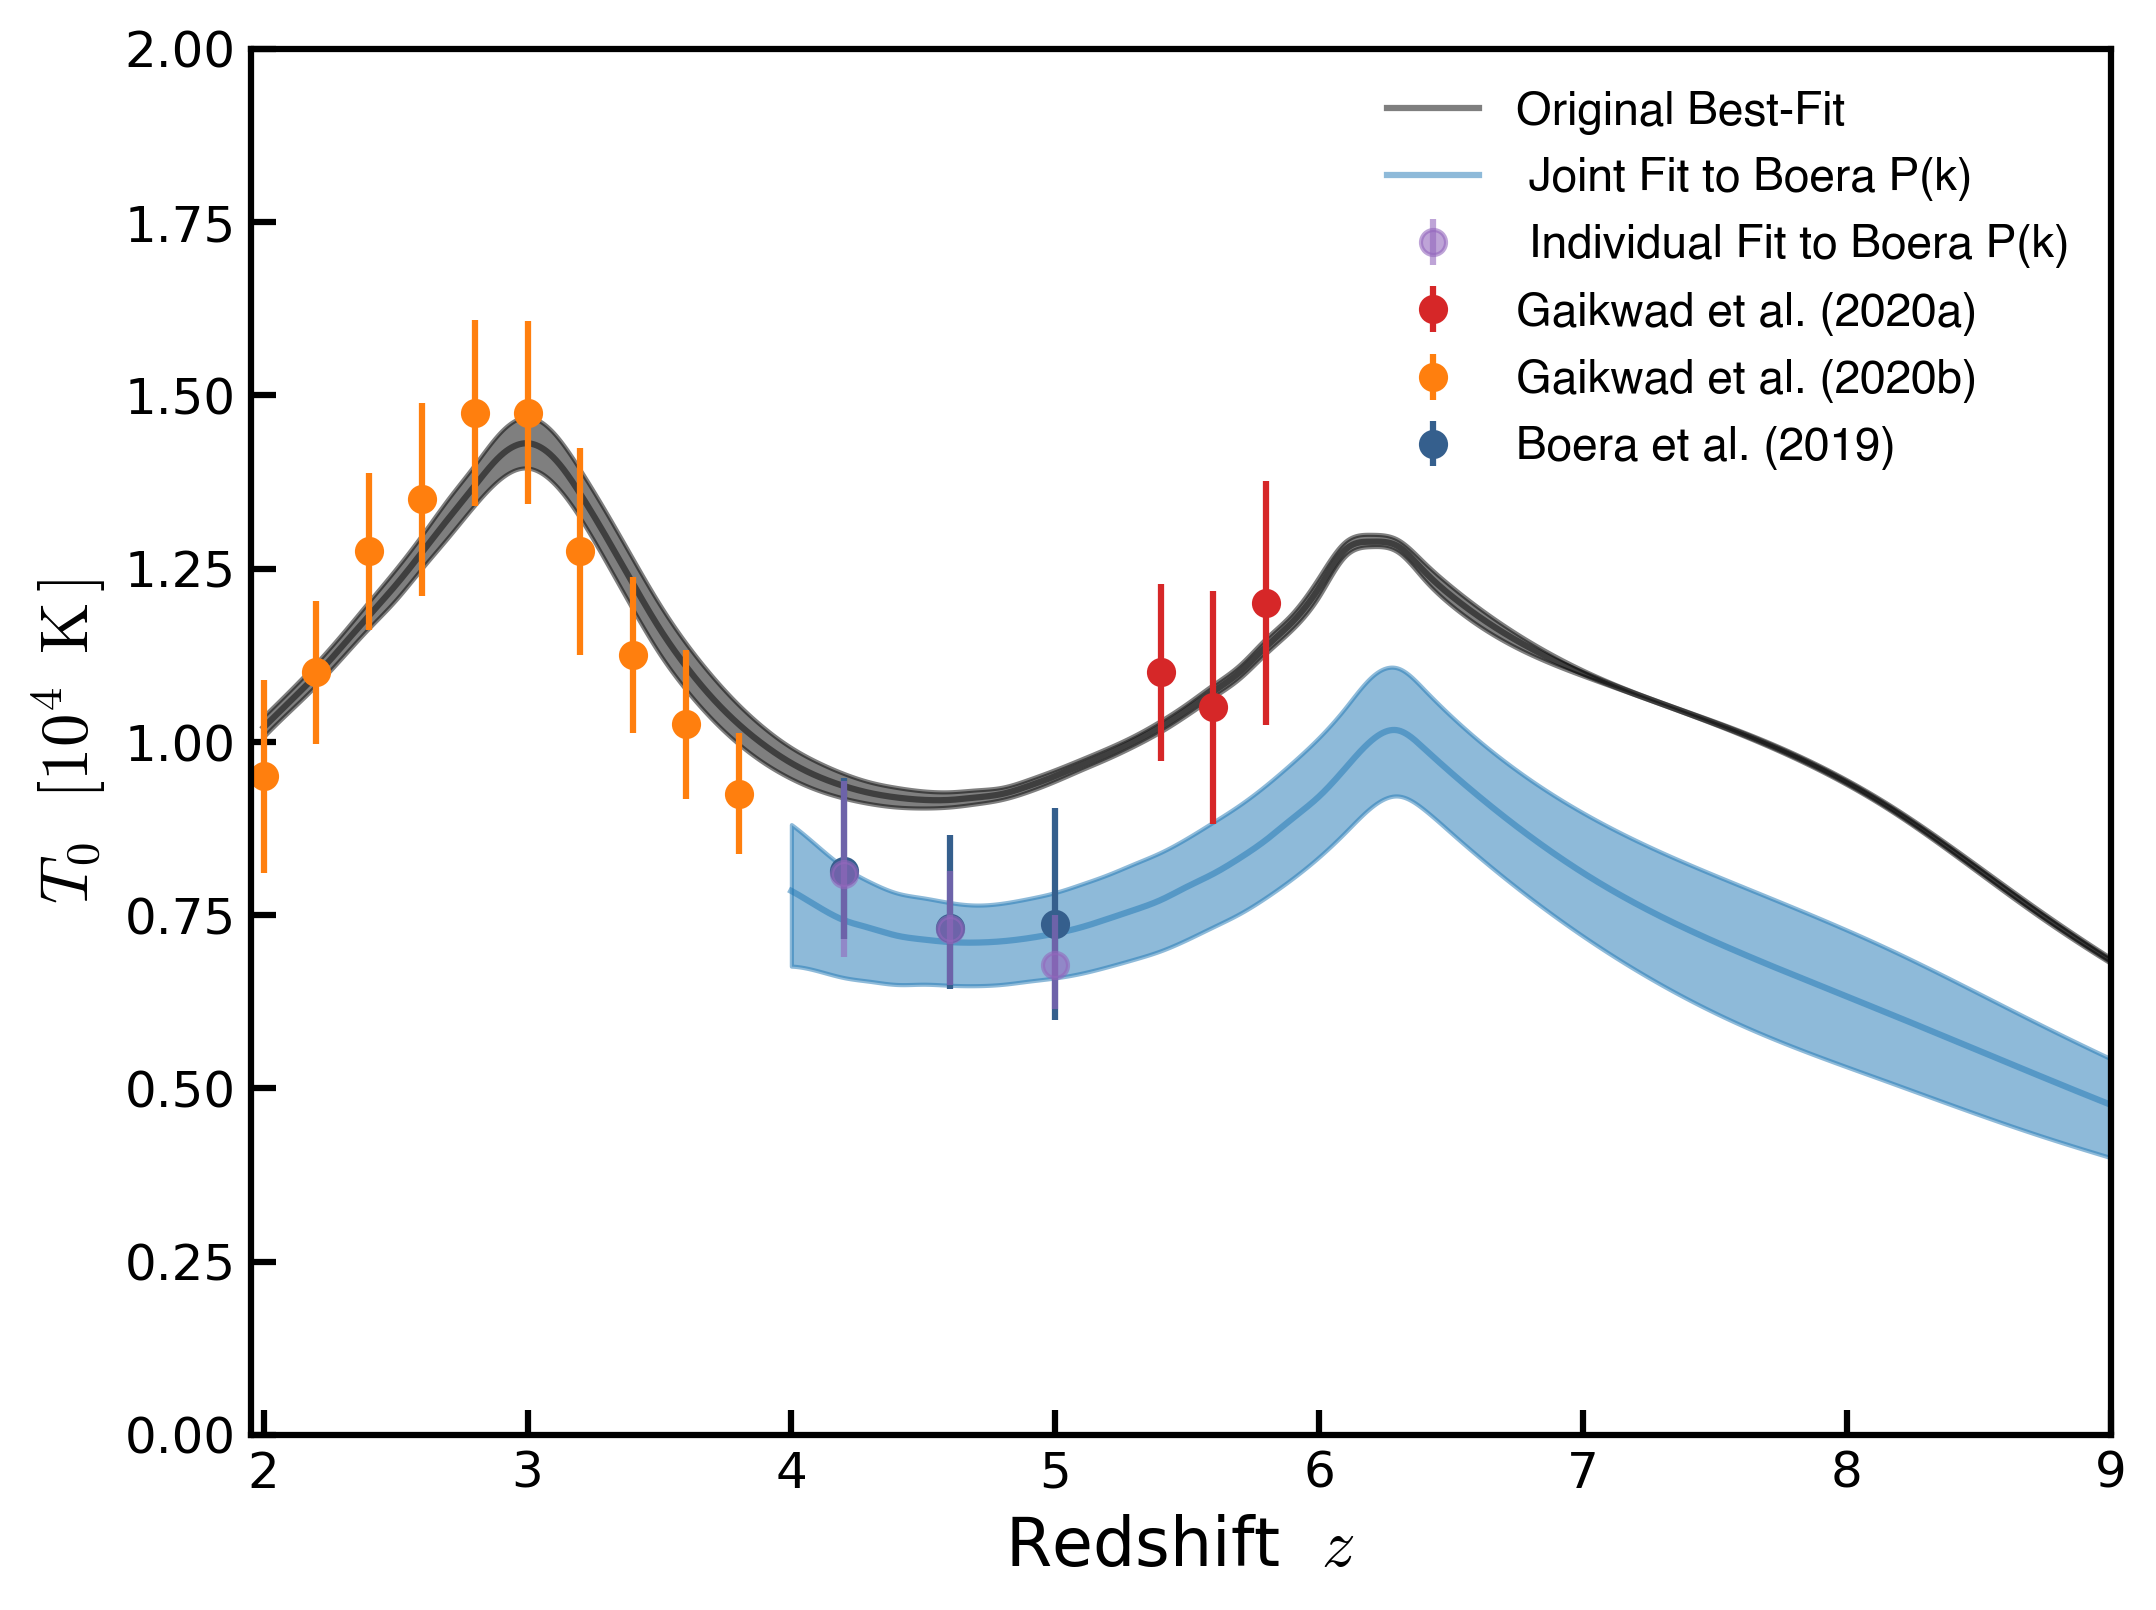
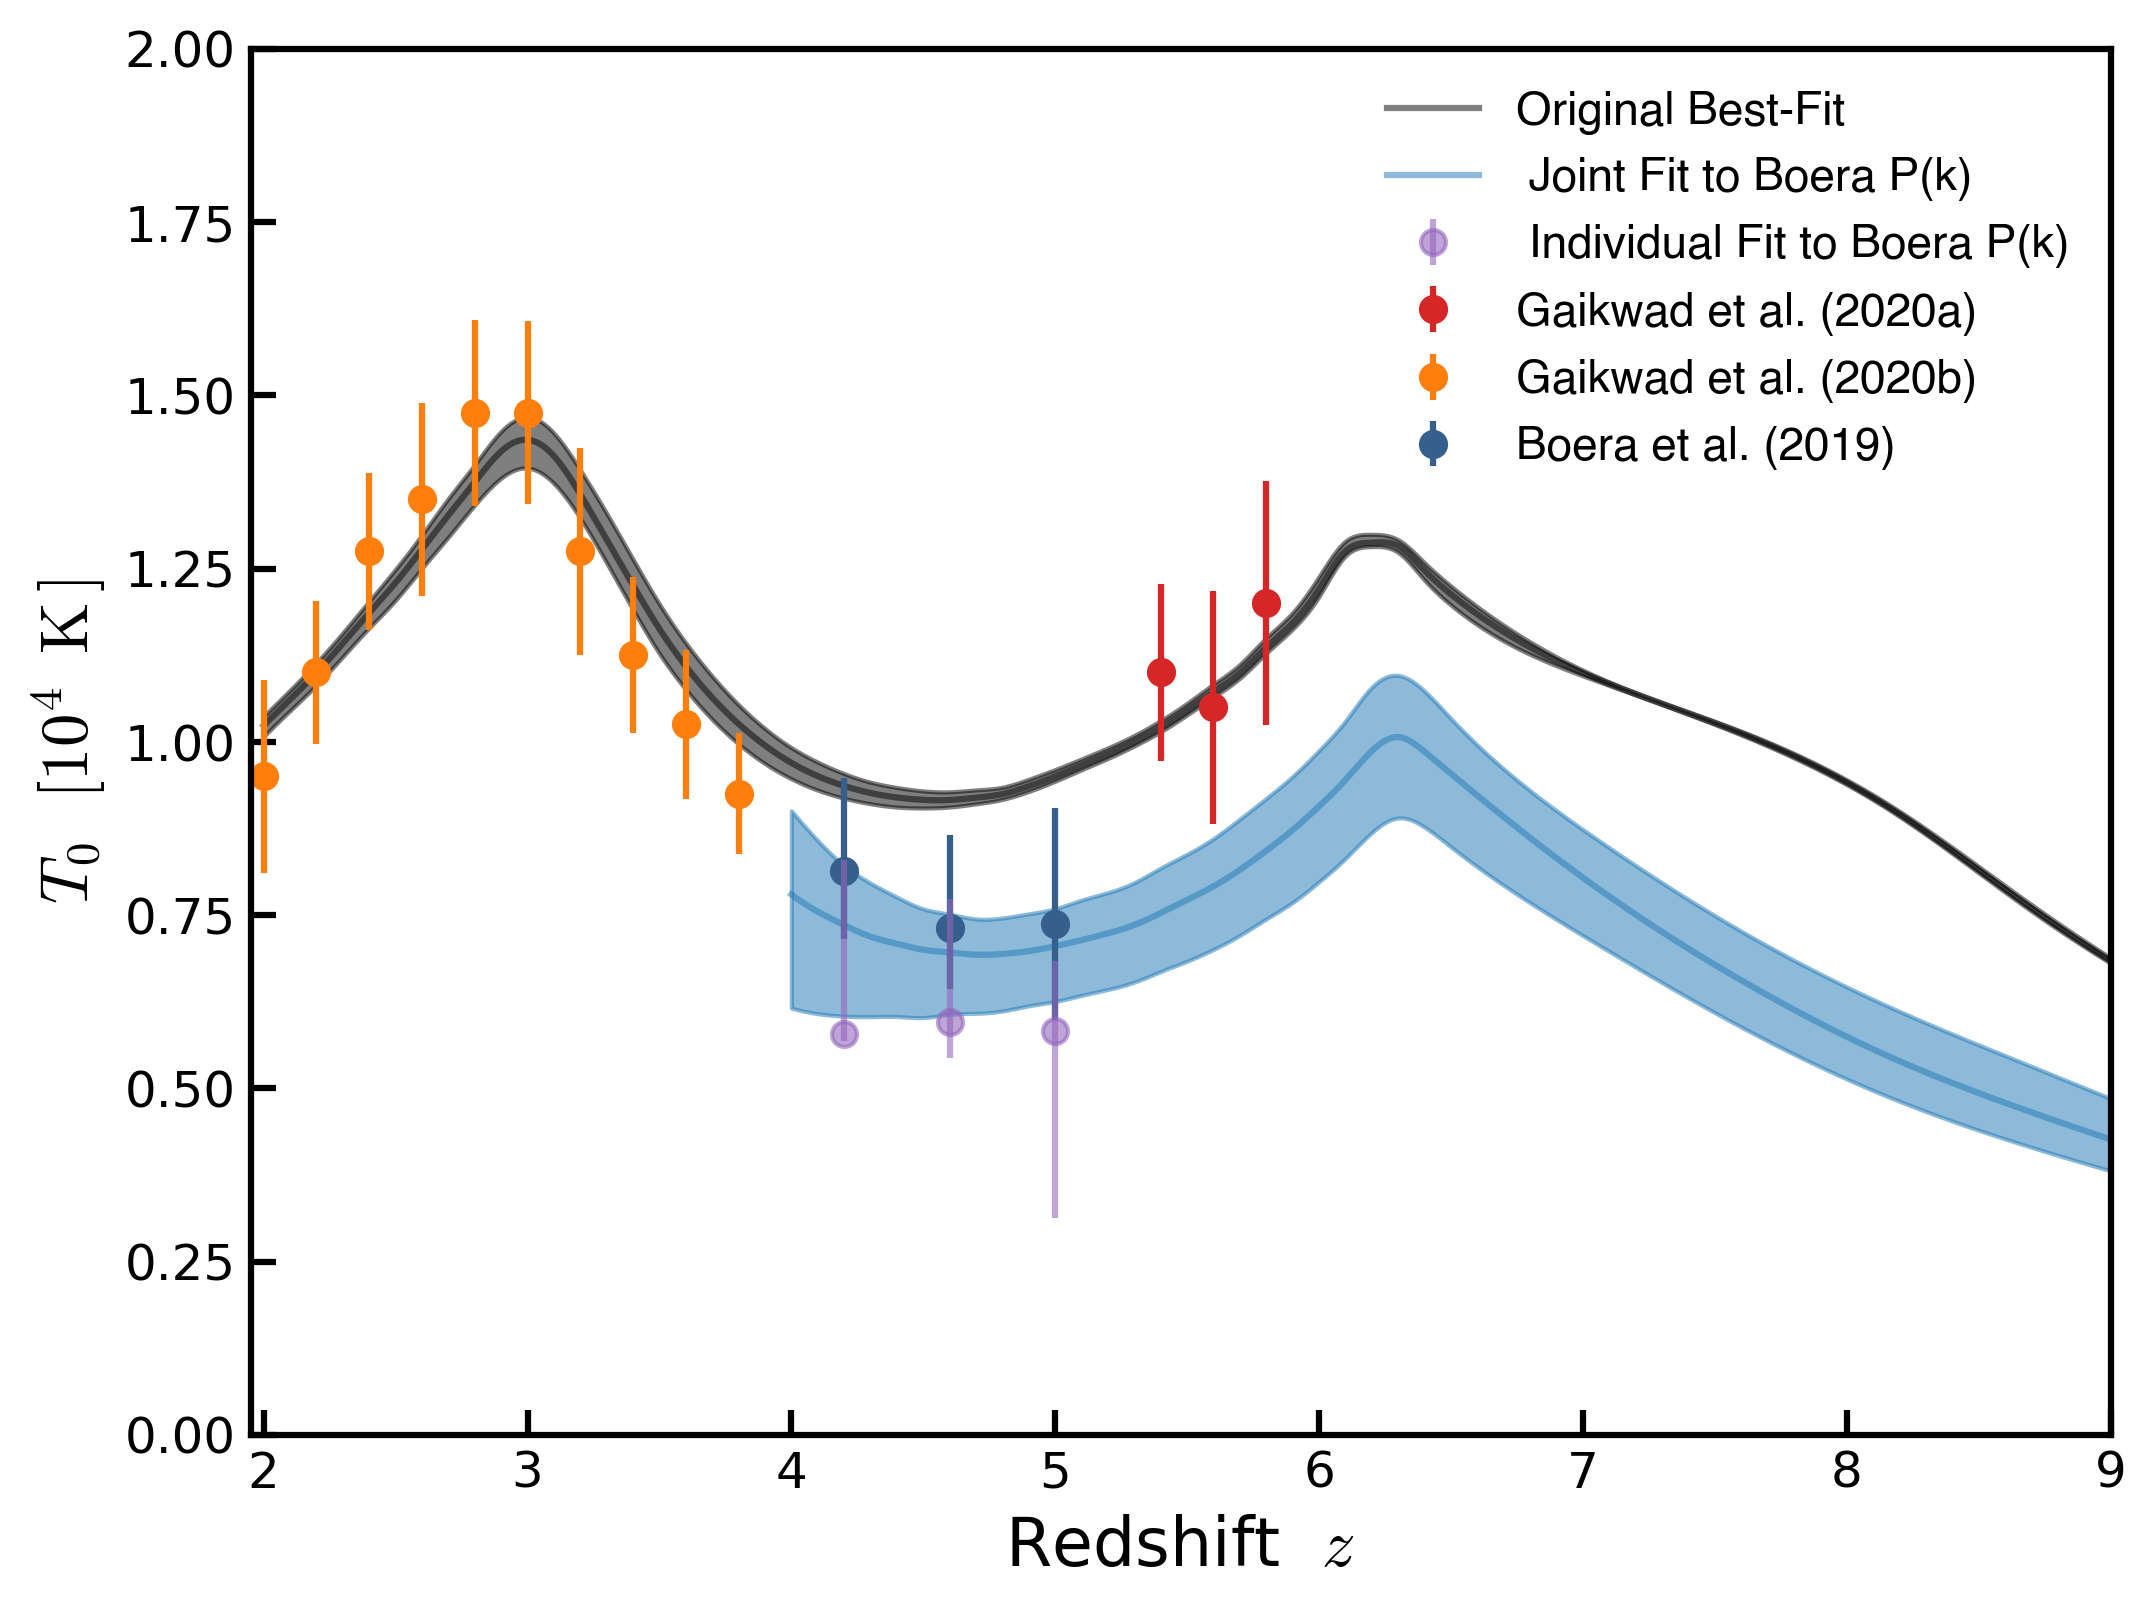
Temperature
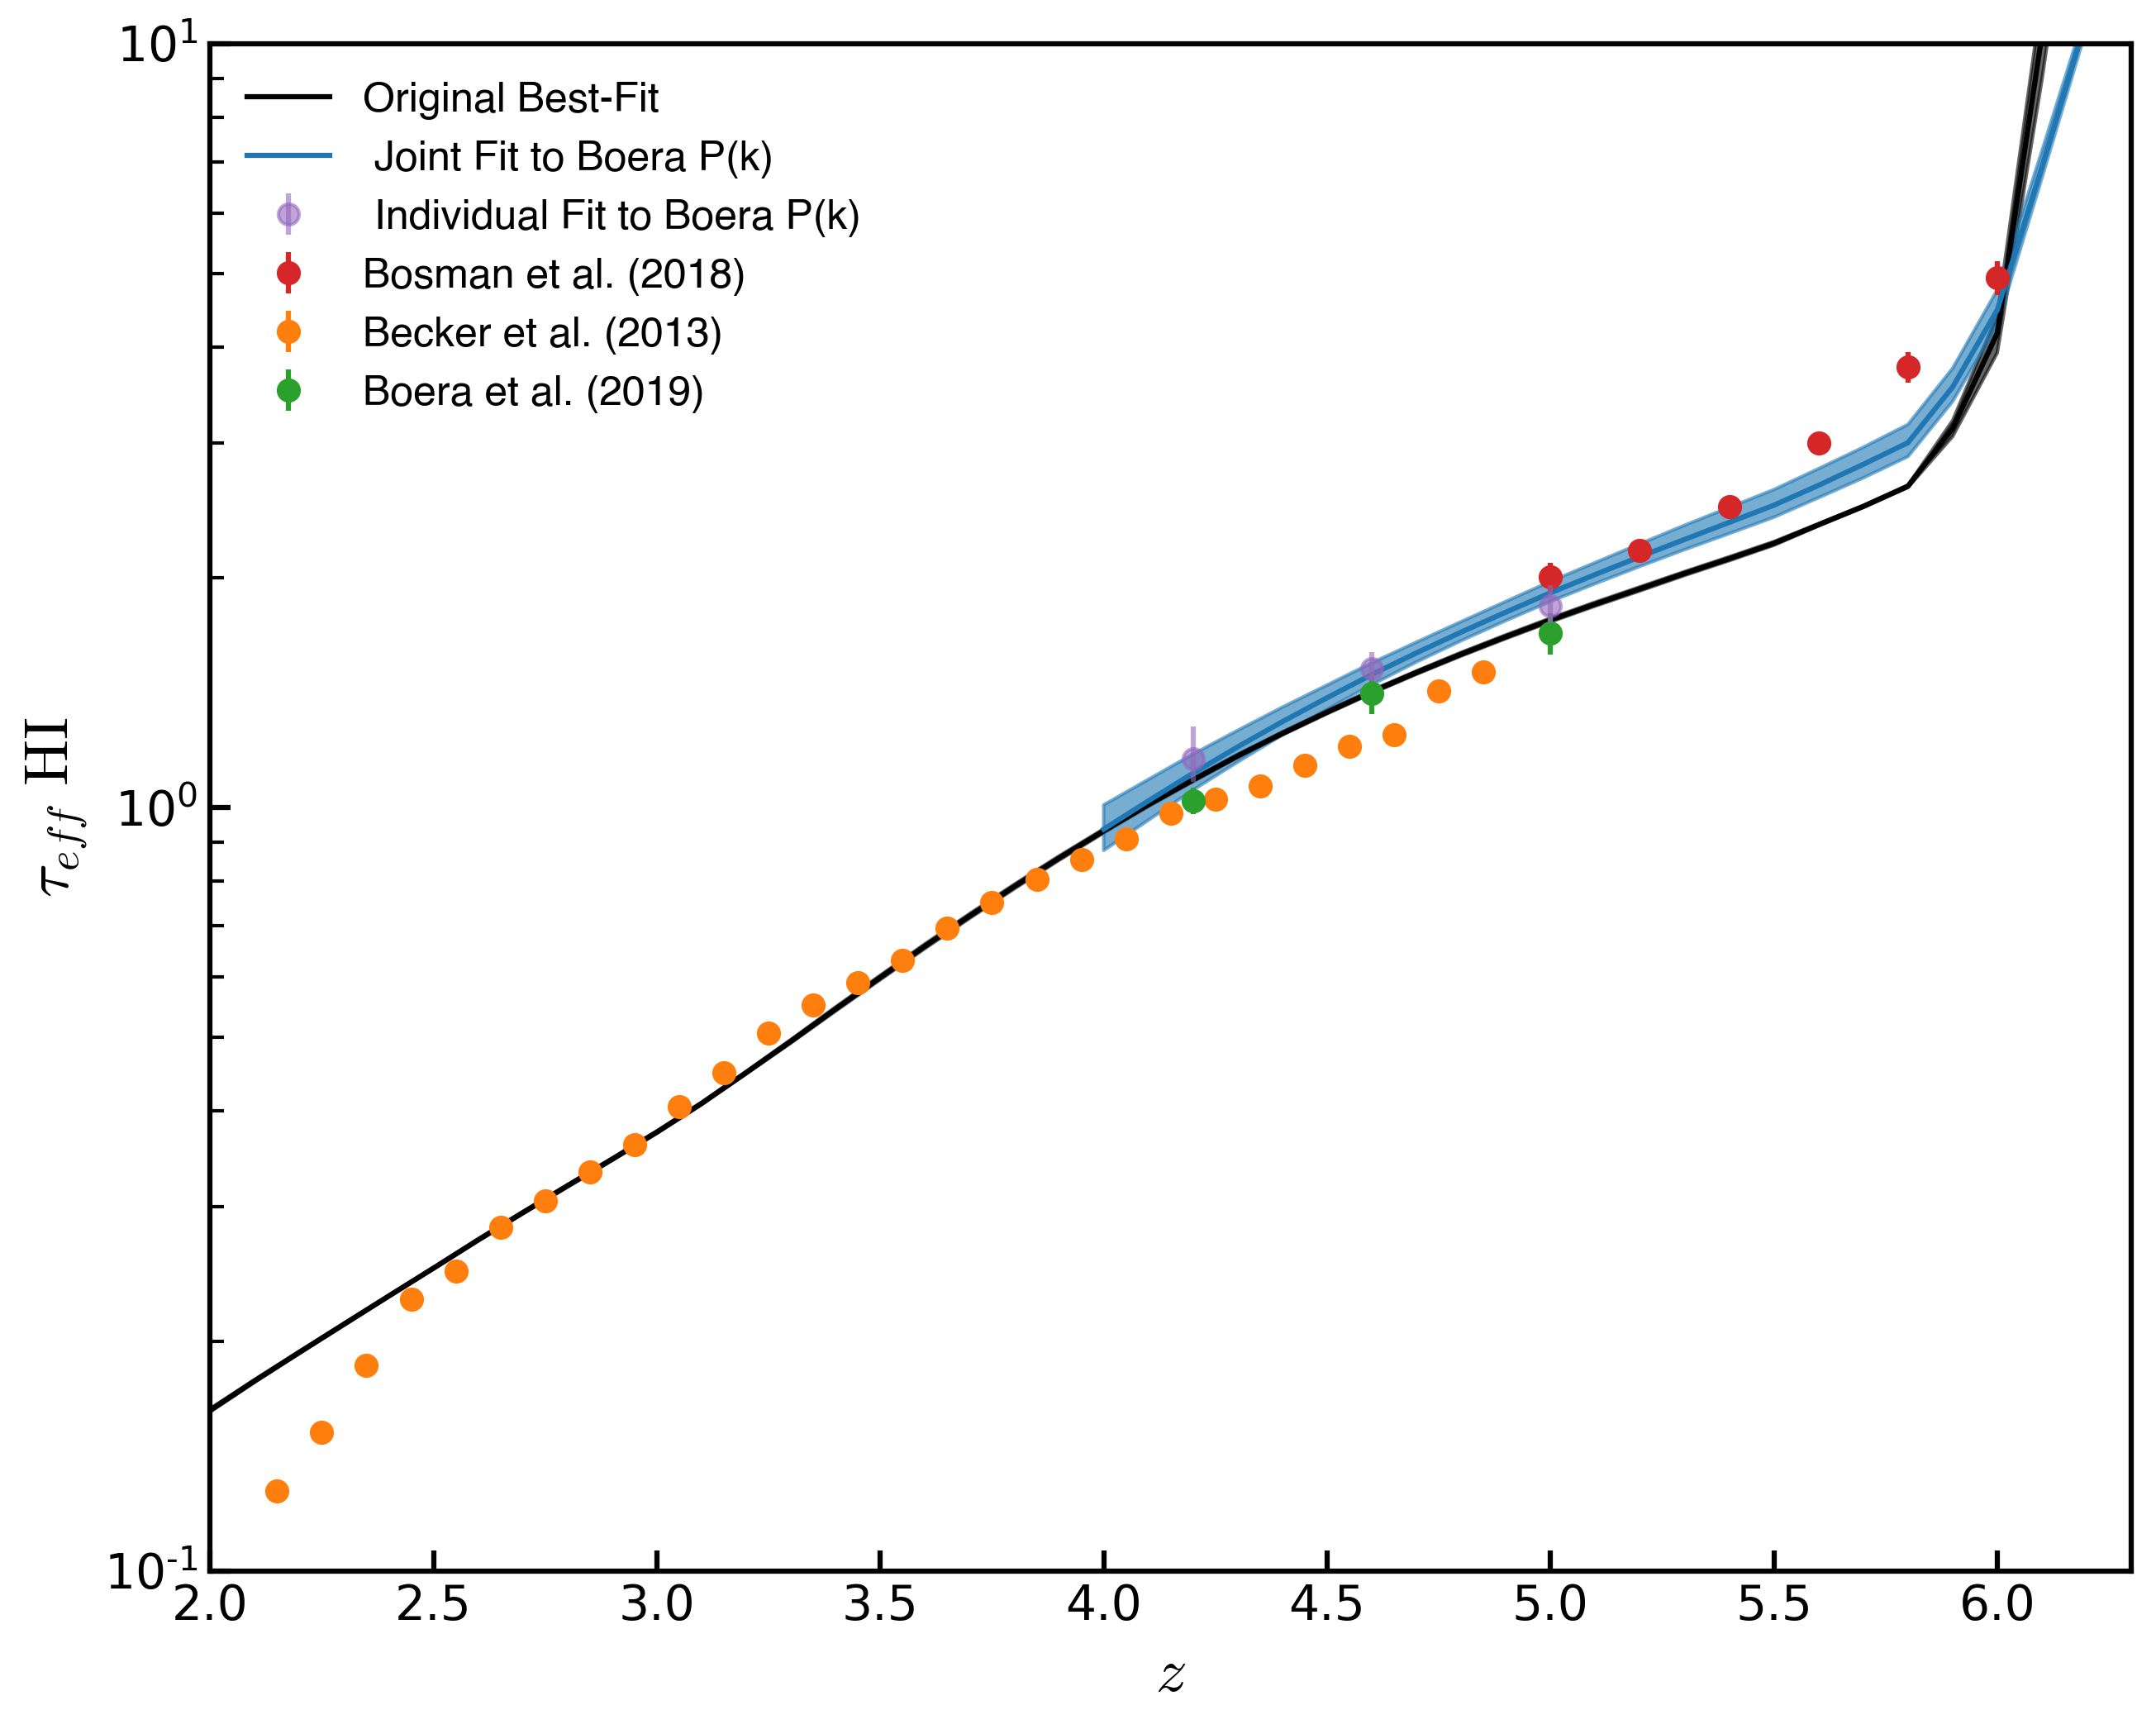
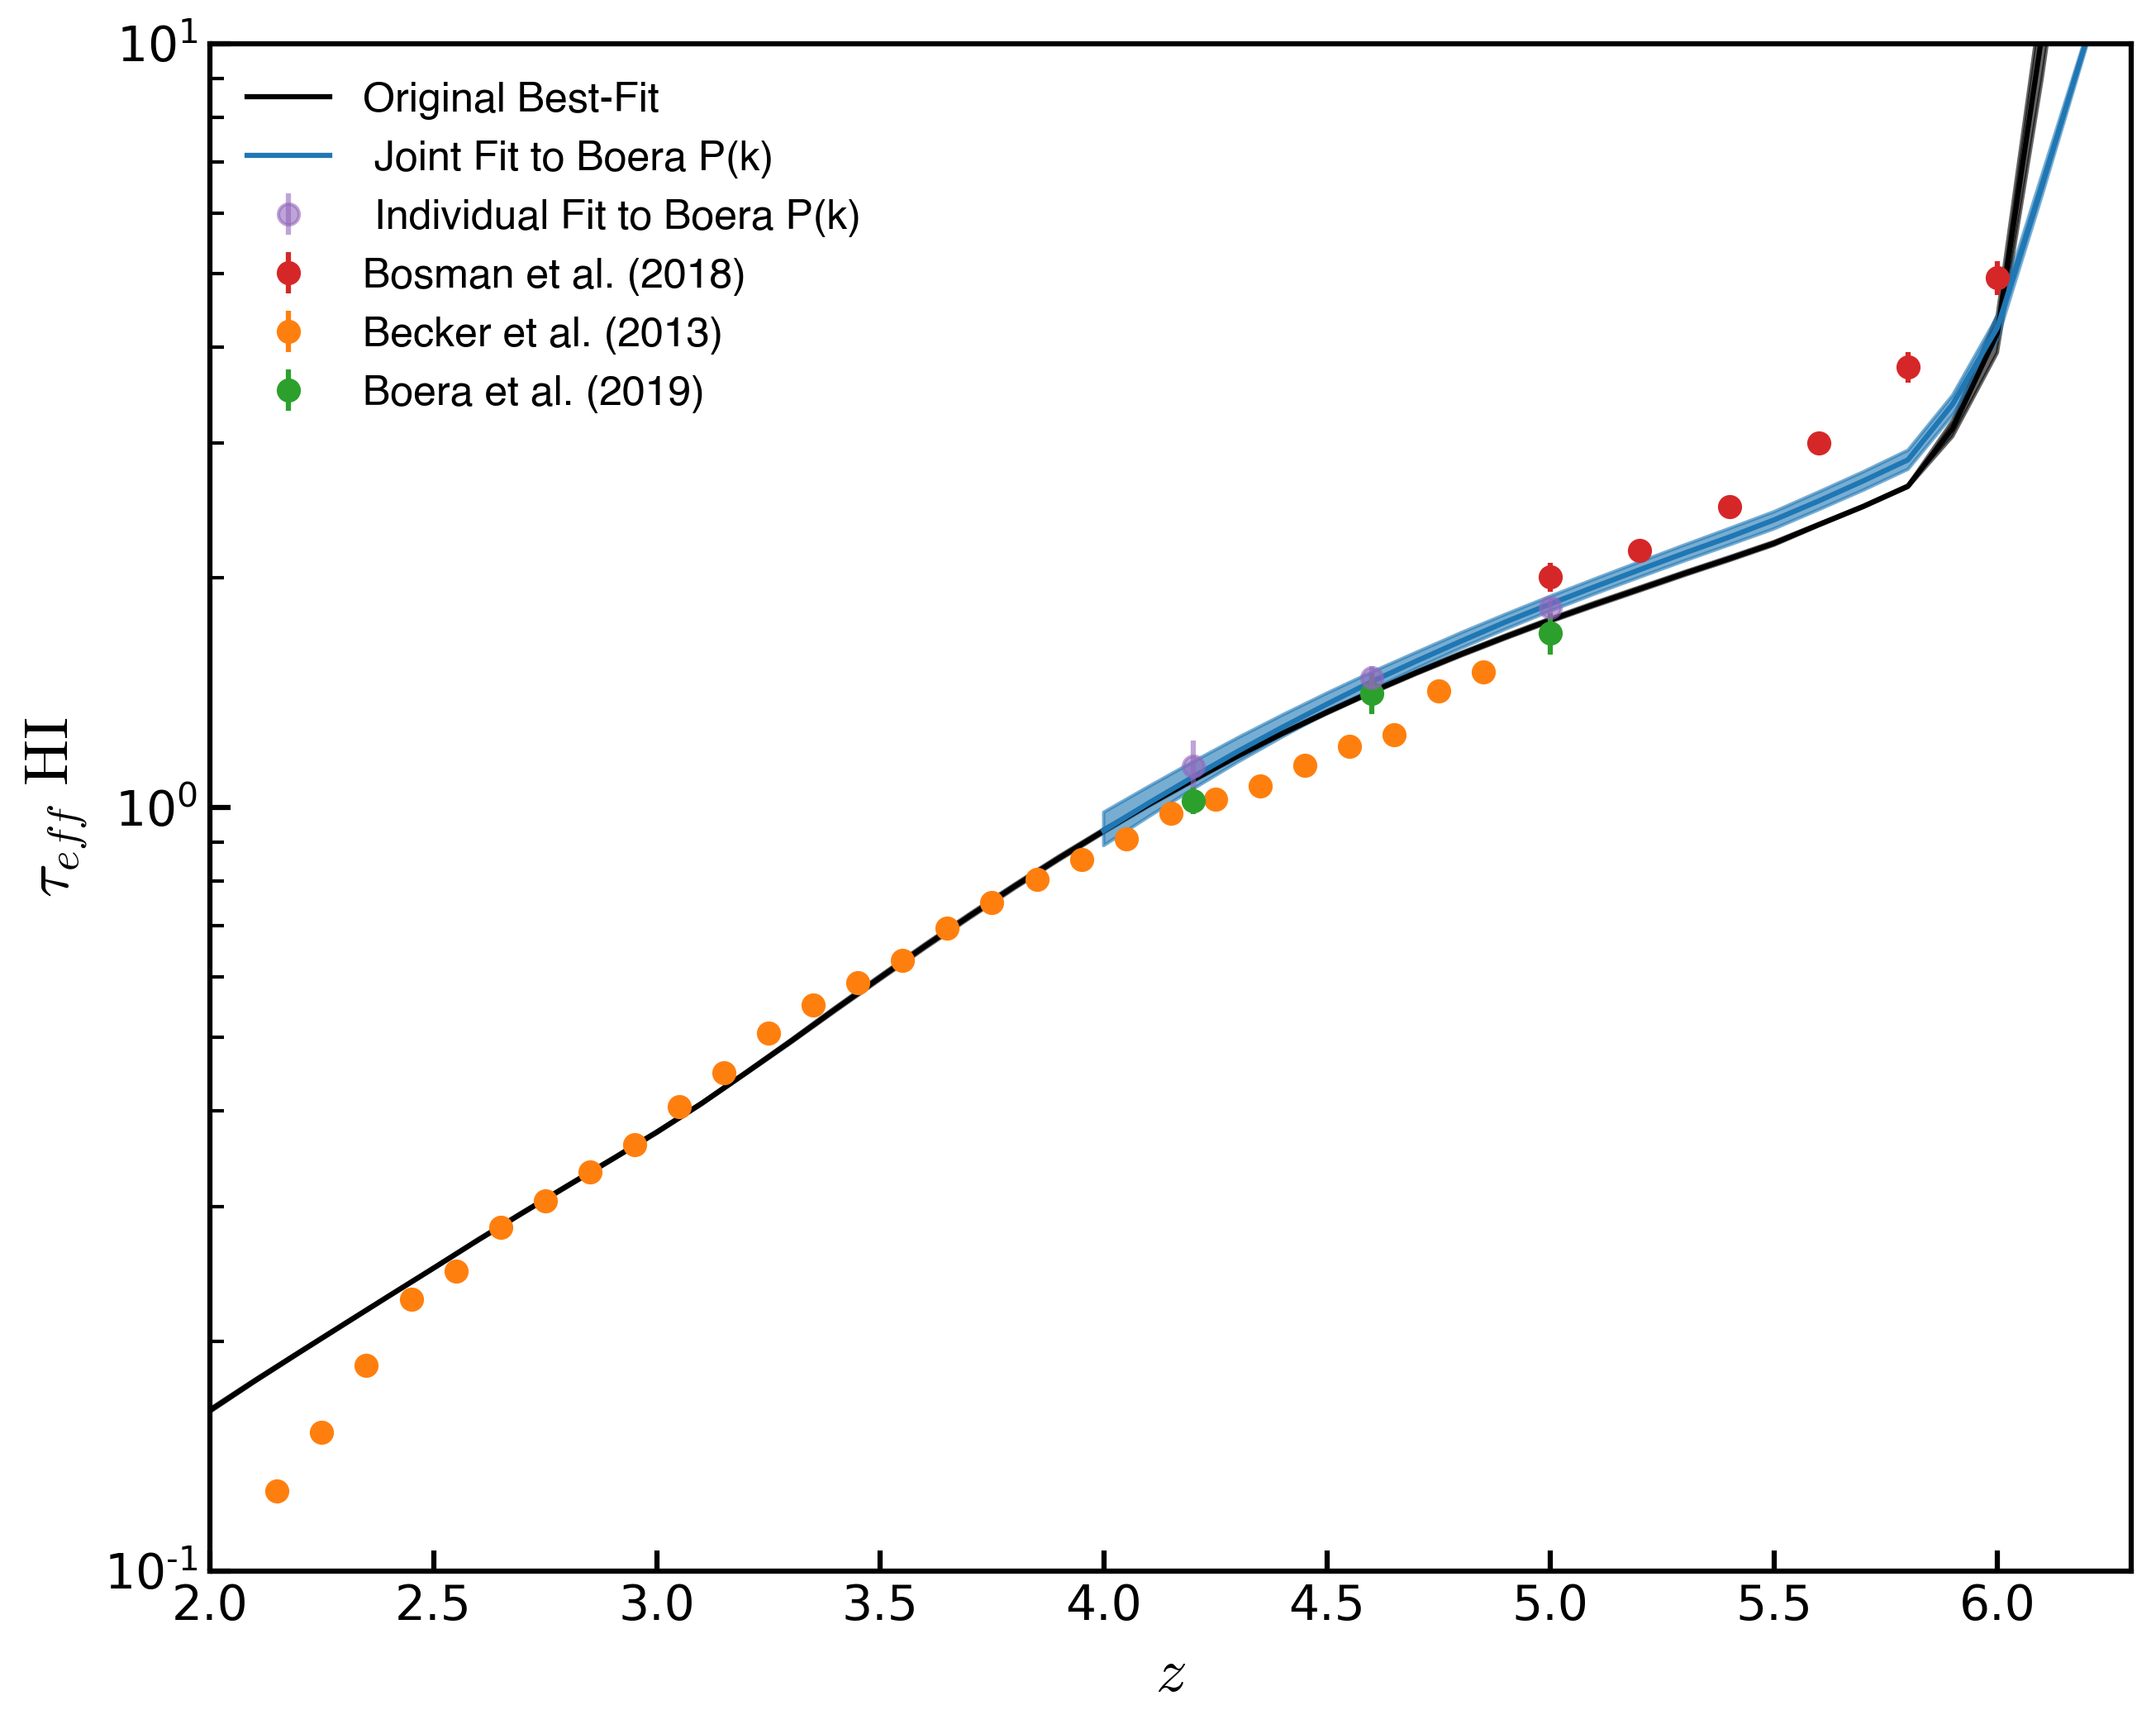
Effective Optical Depth
WDM Fit to Boera
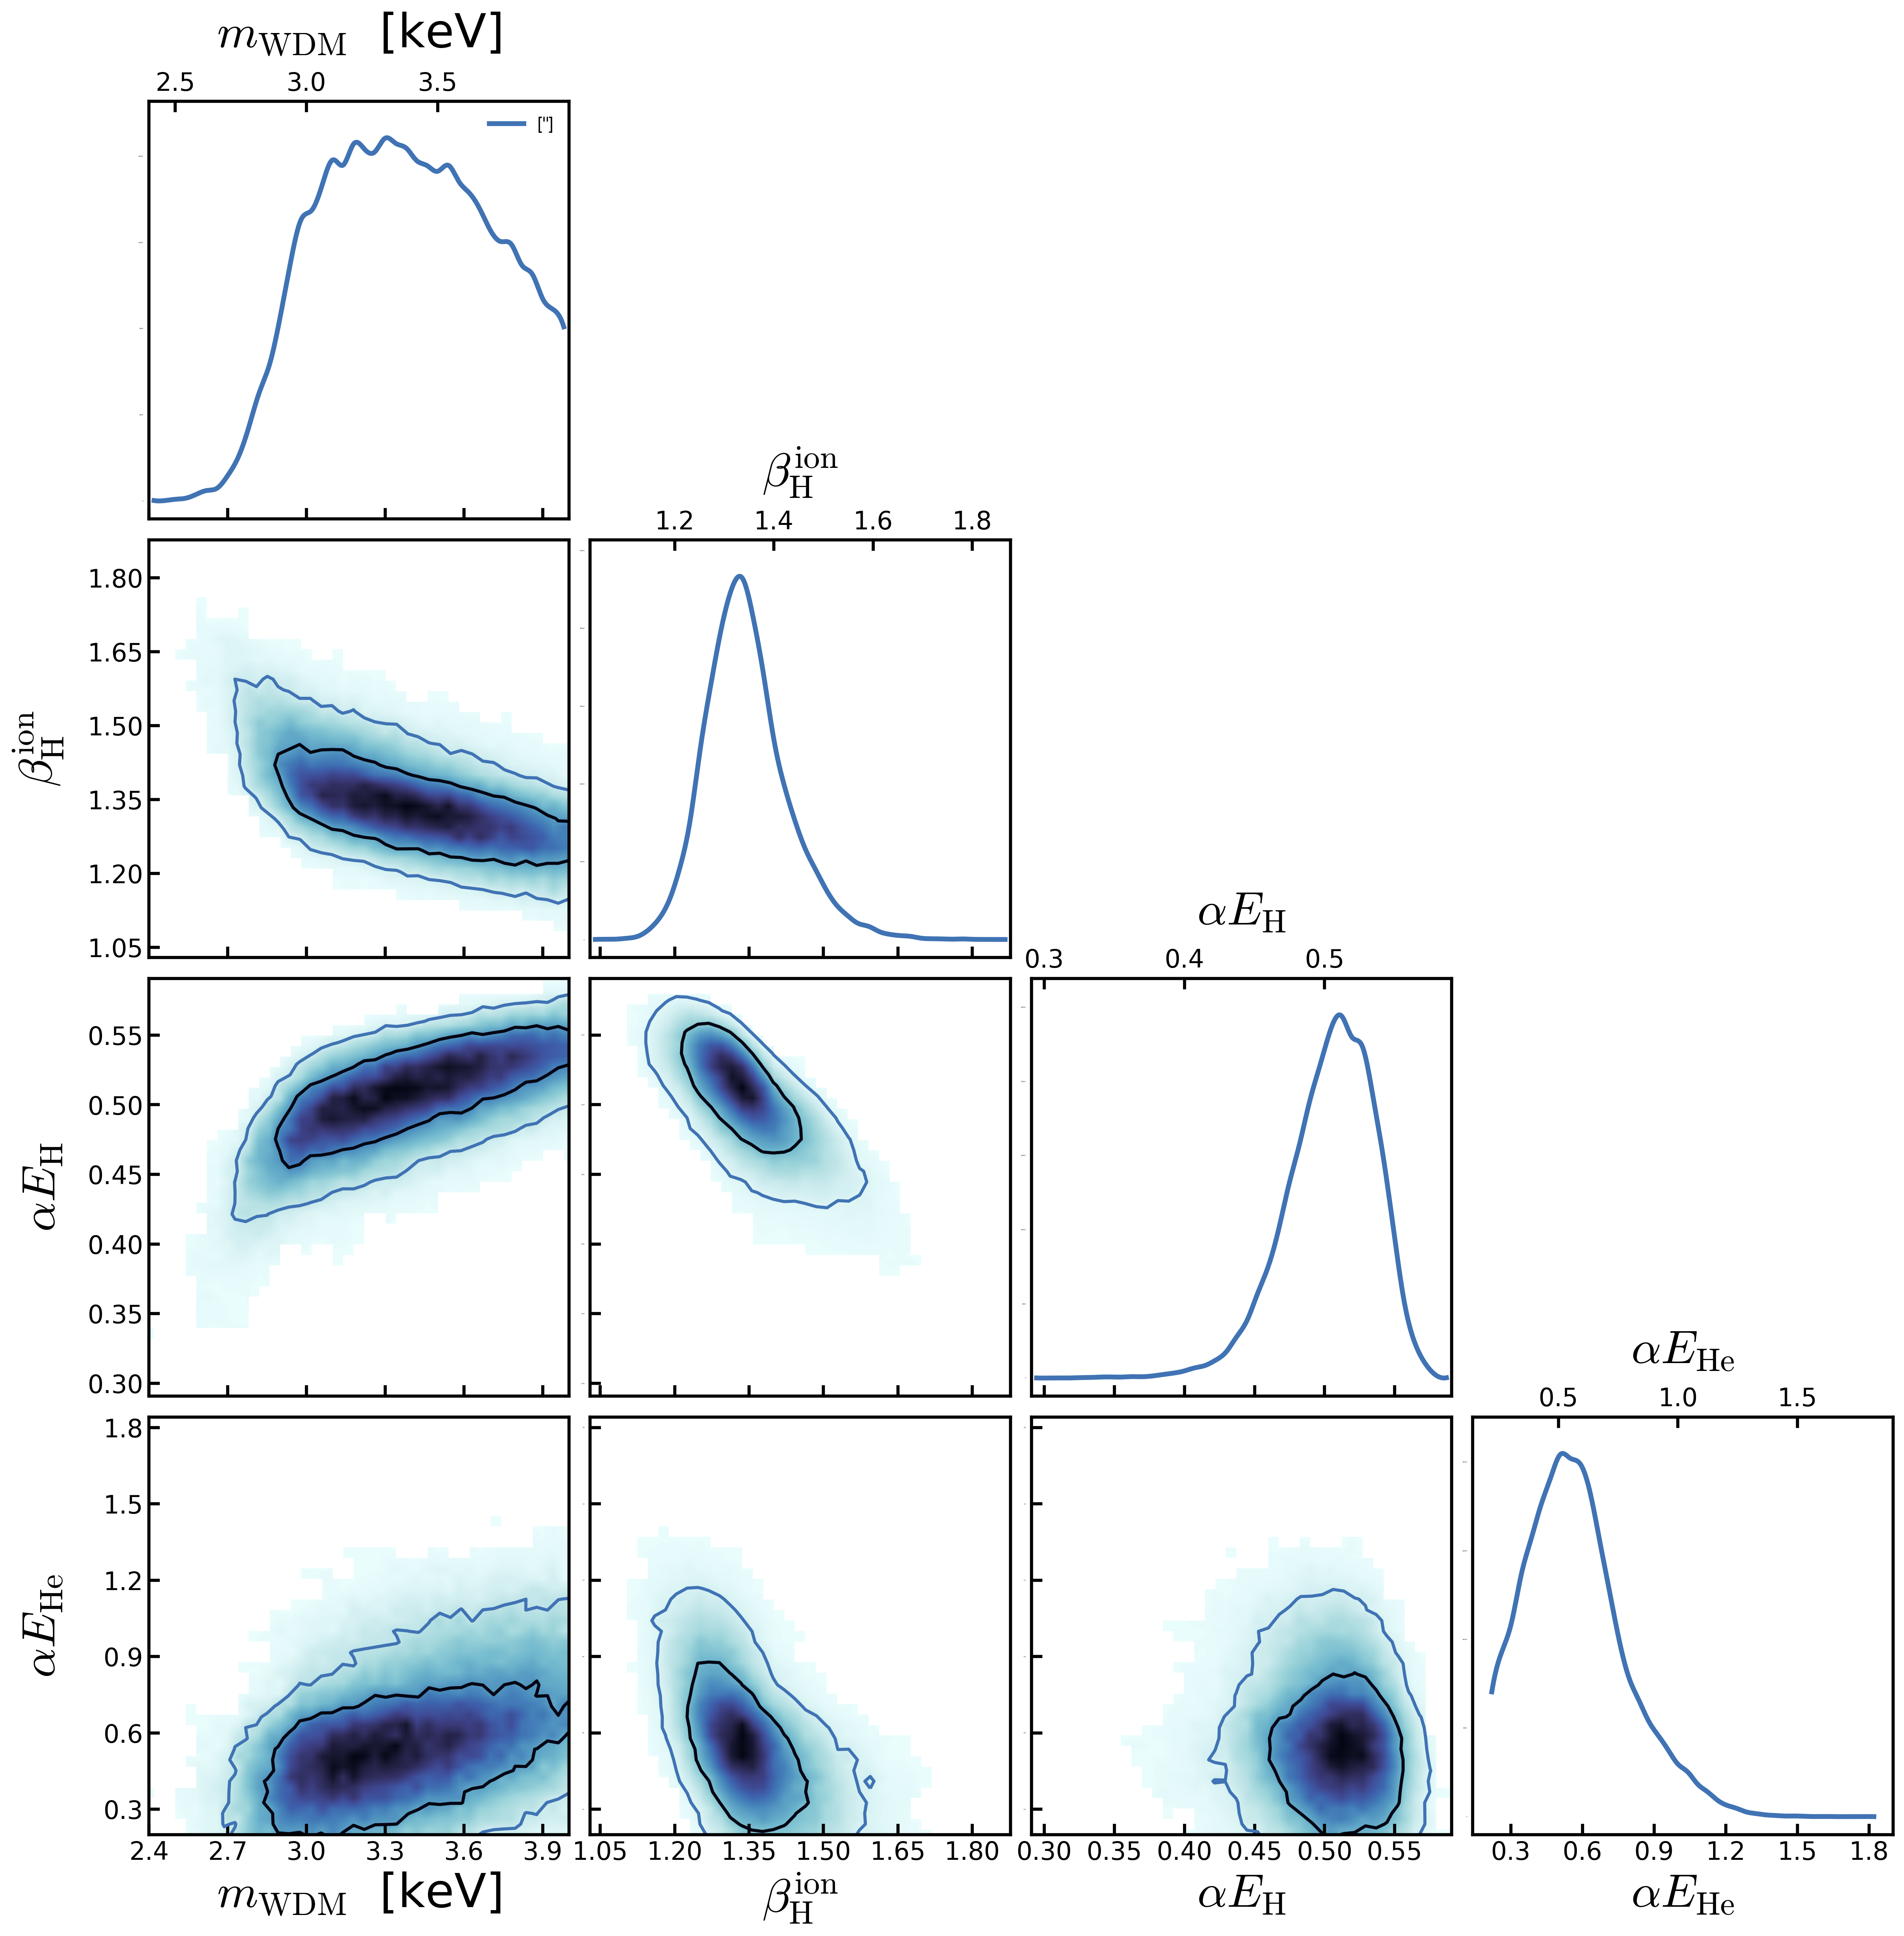
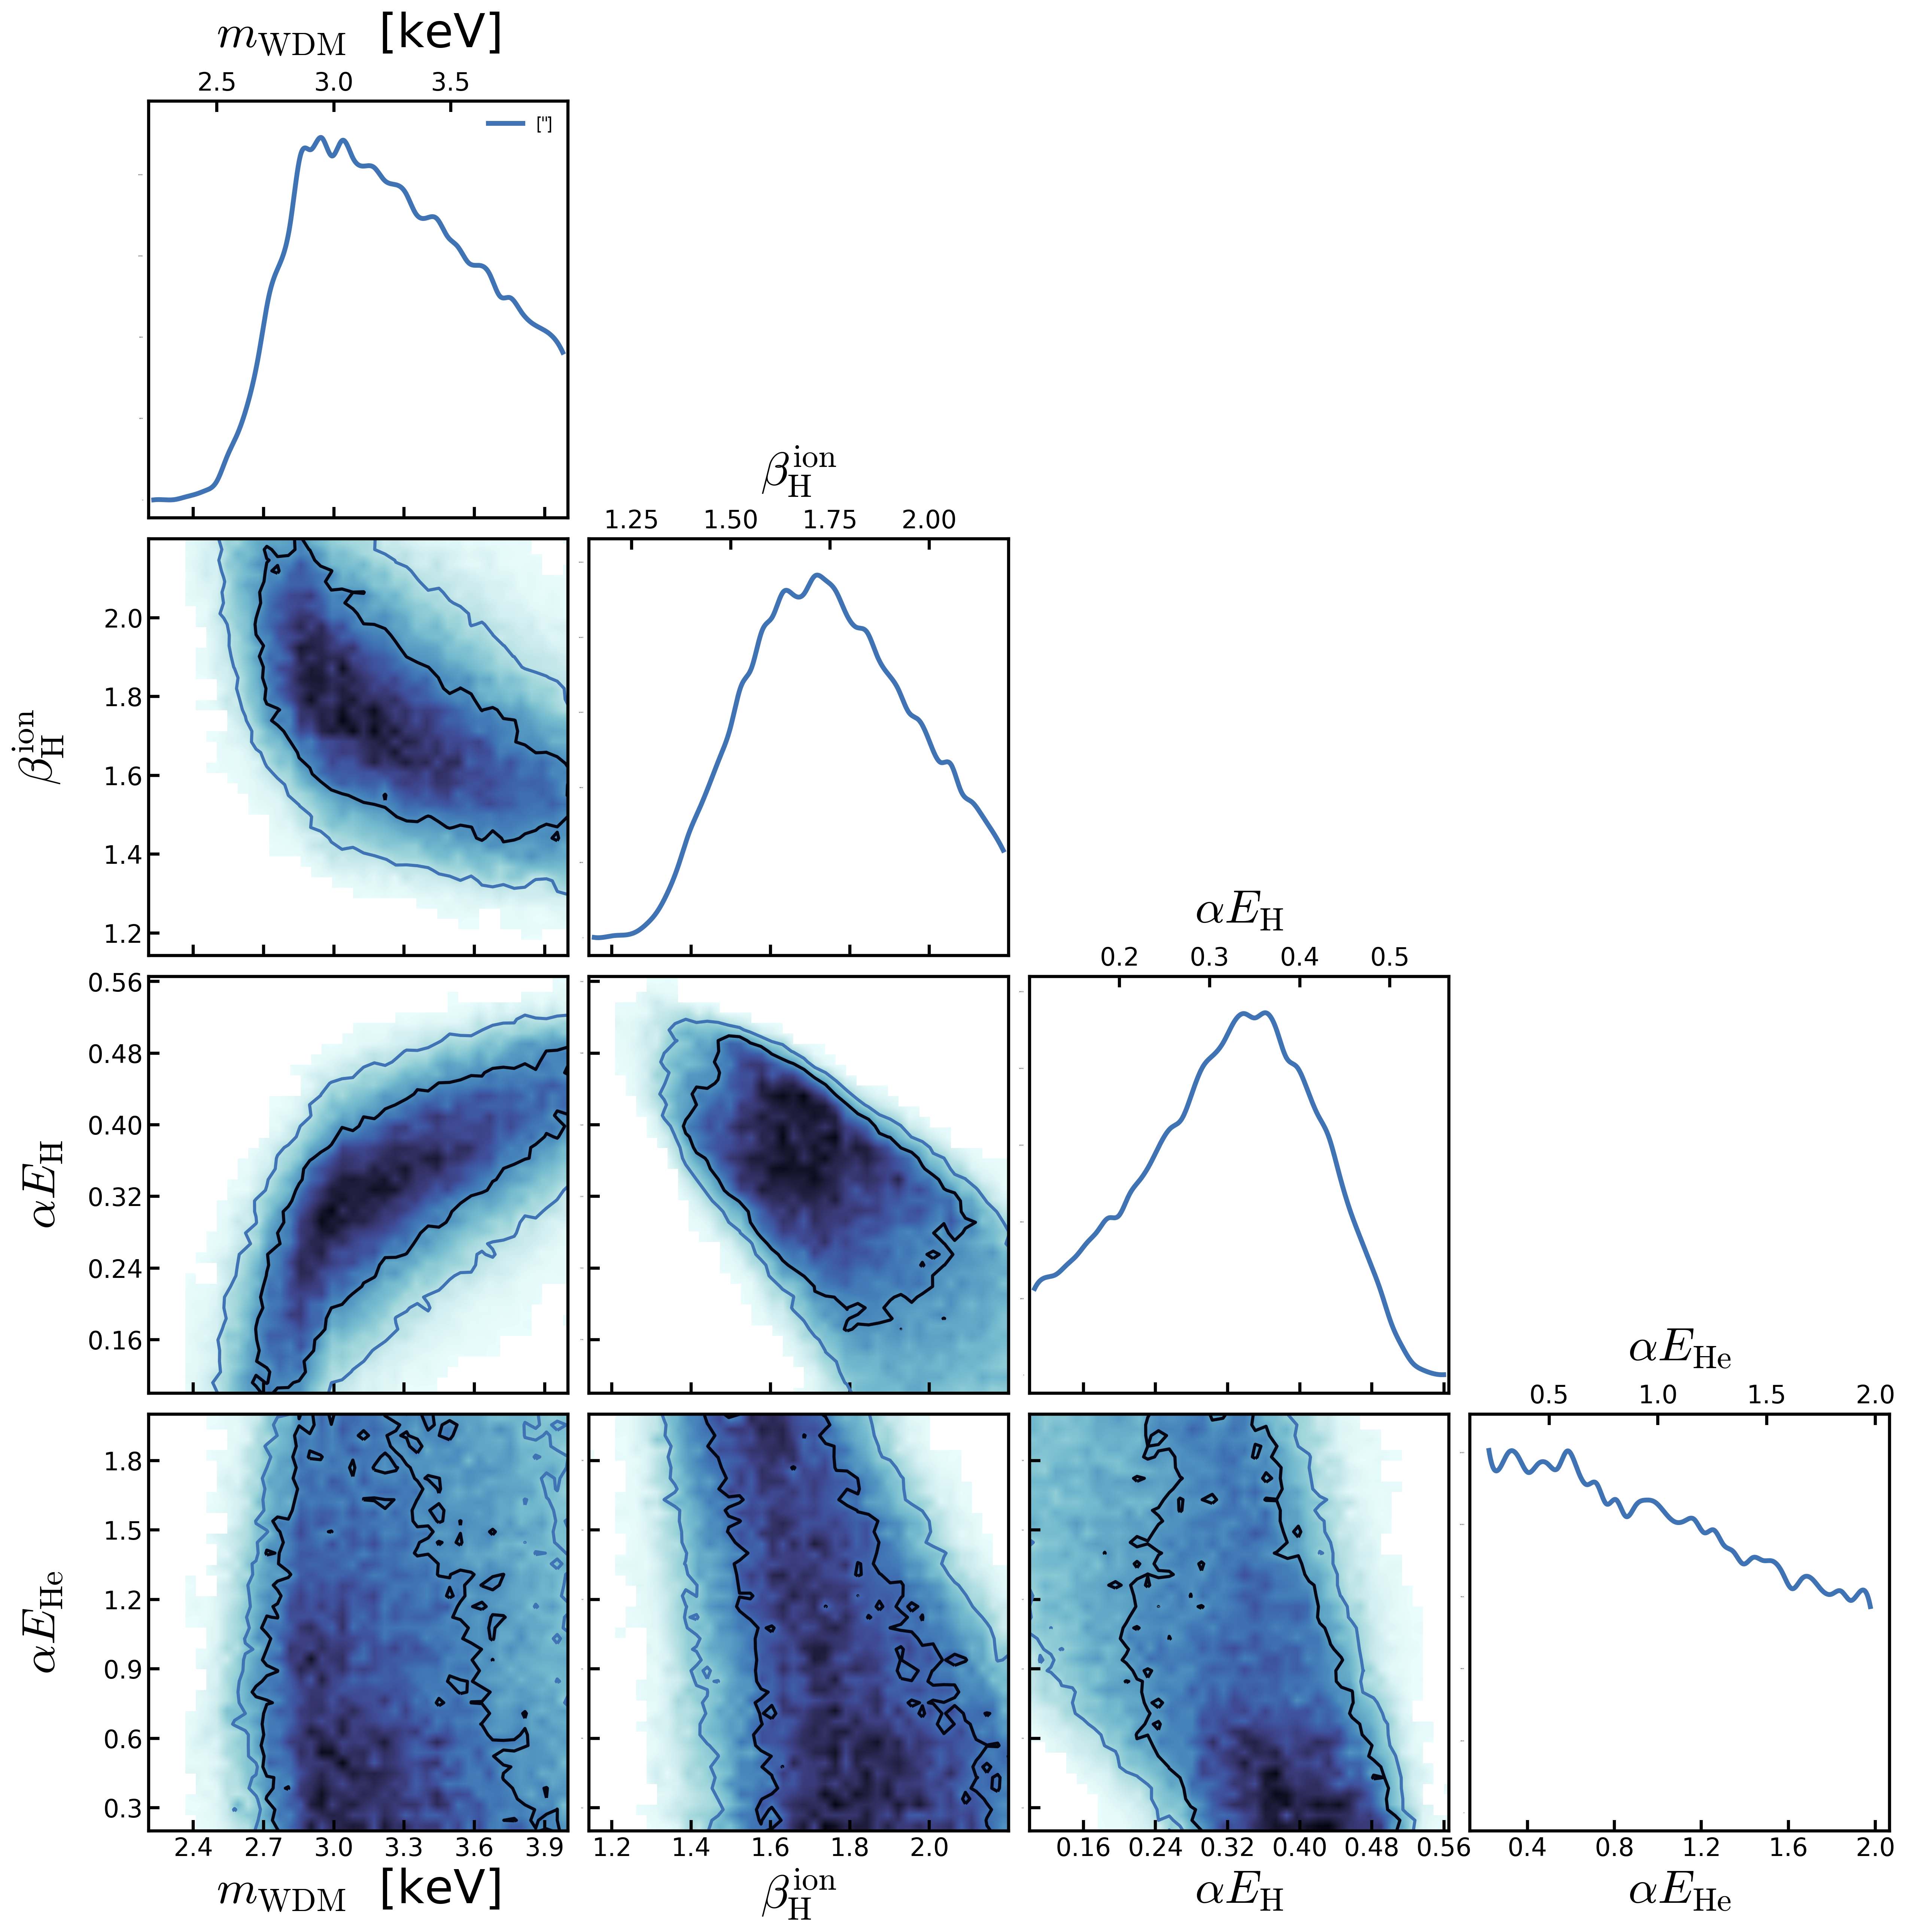
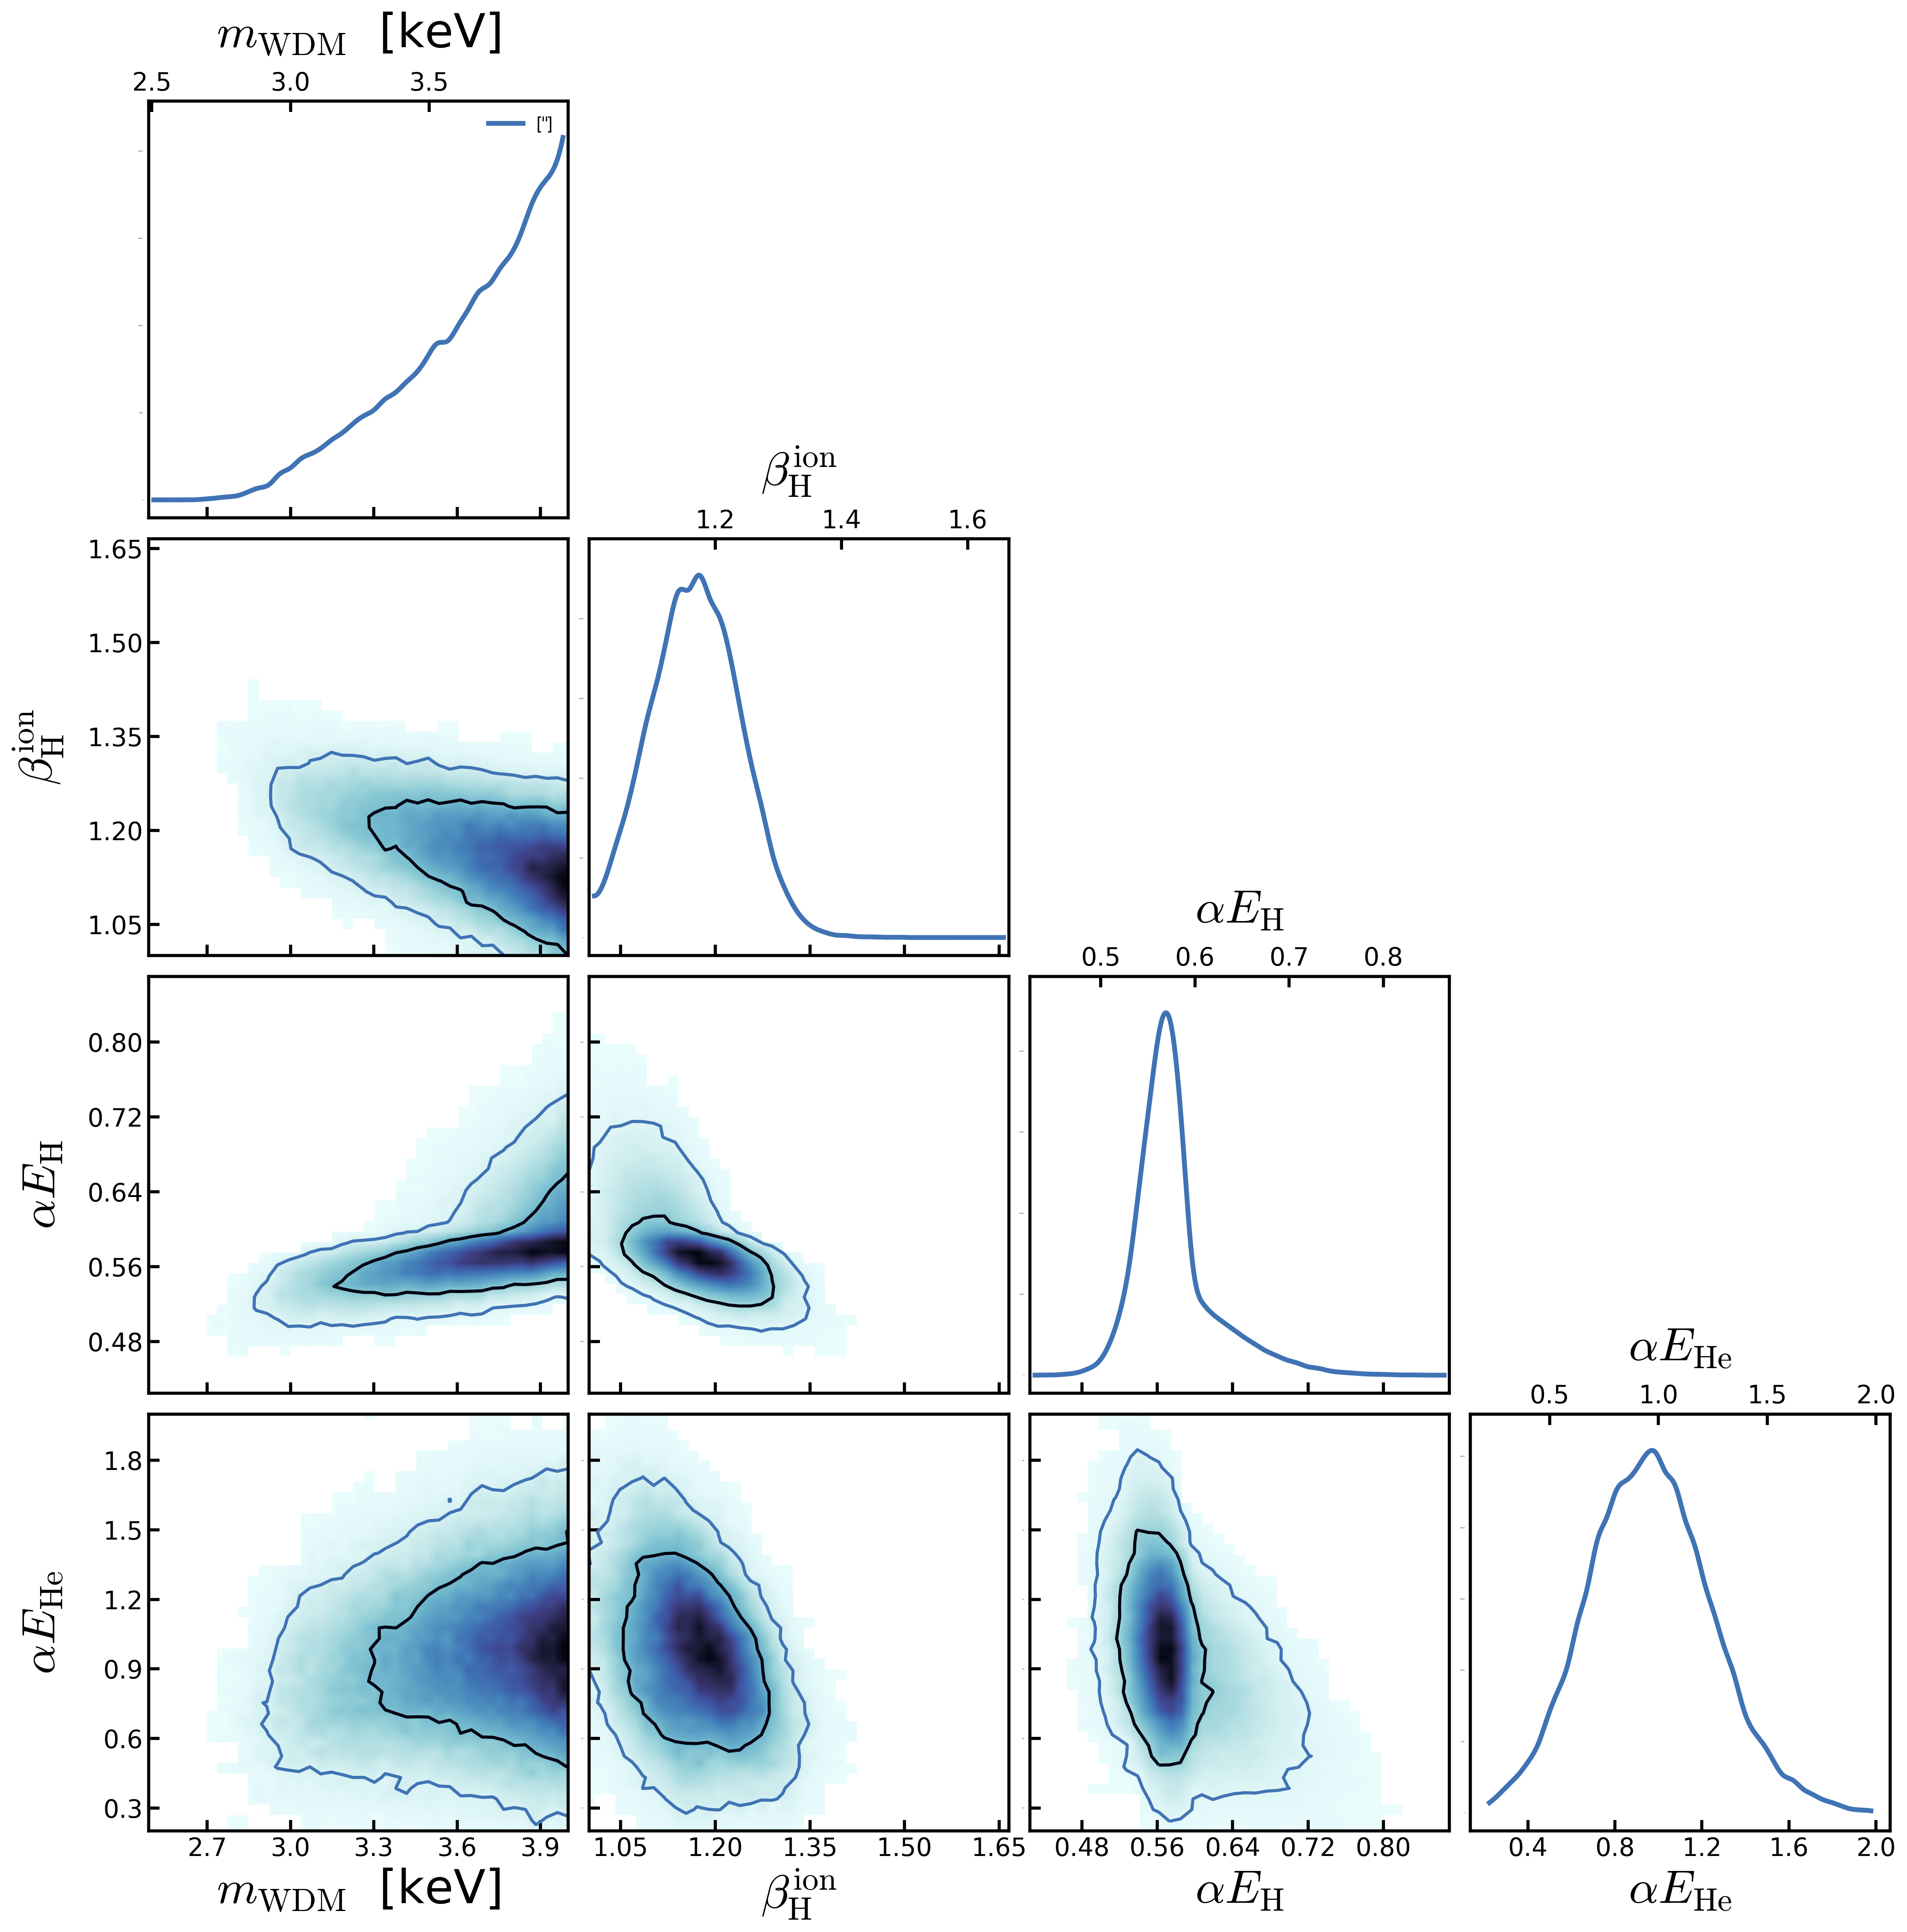
Parameters Distribution Joint Fit to all redshifts
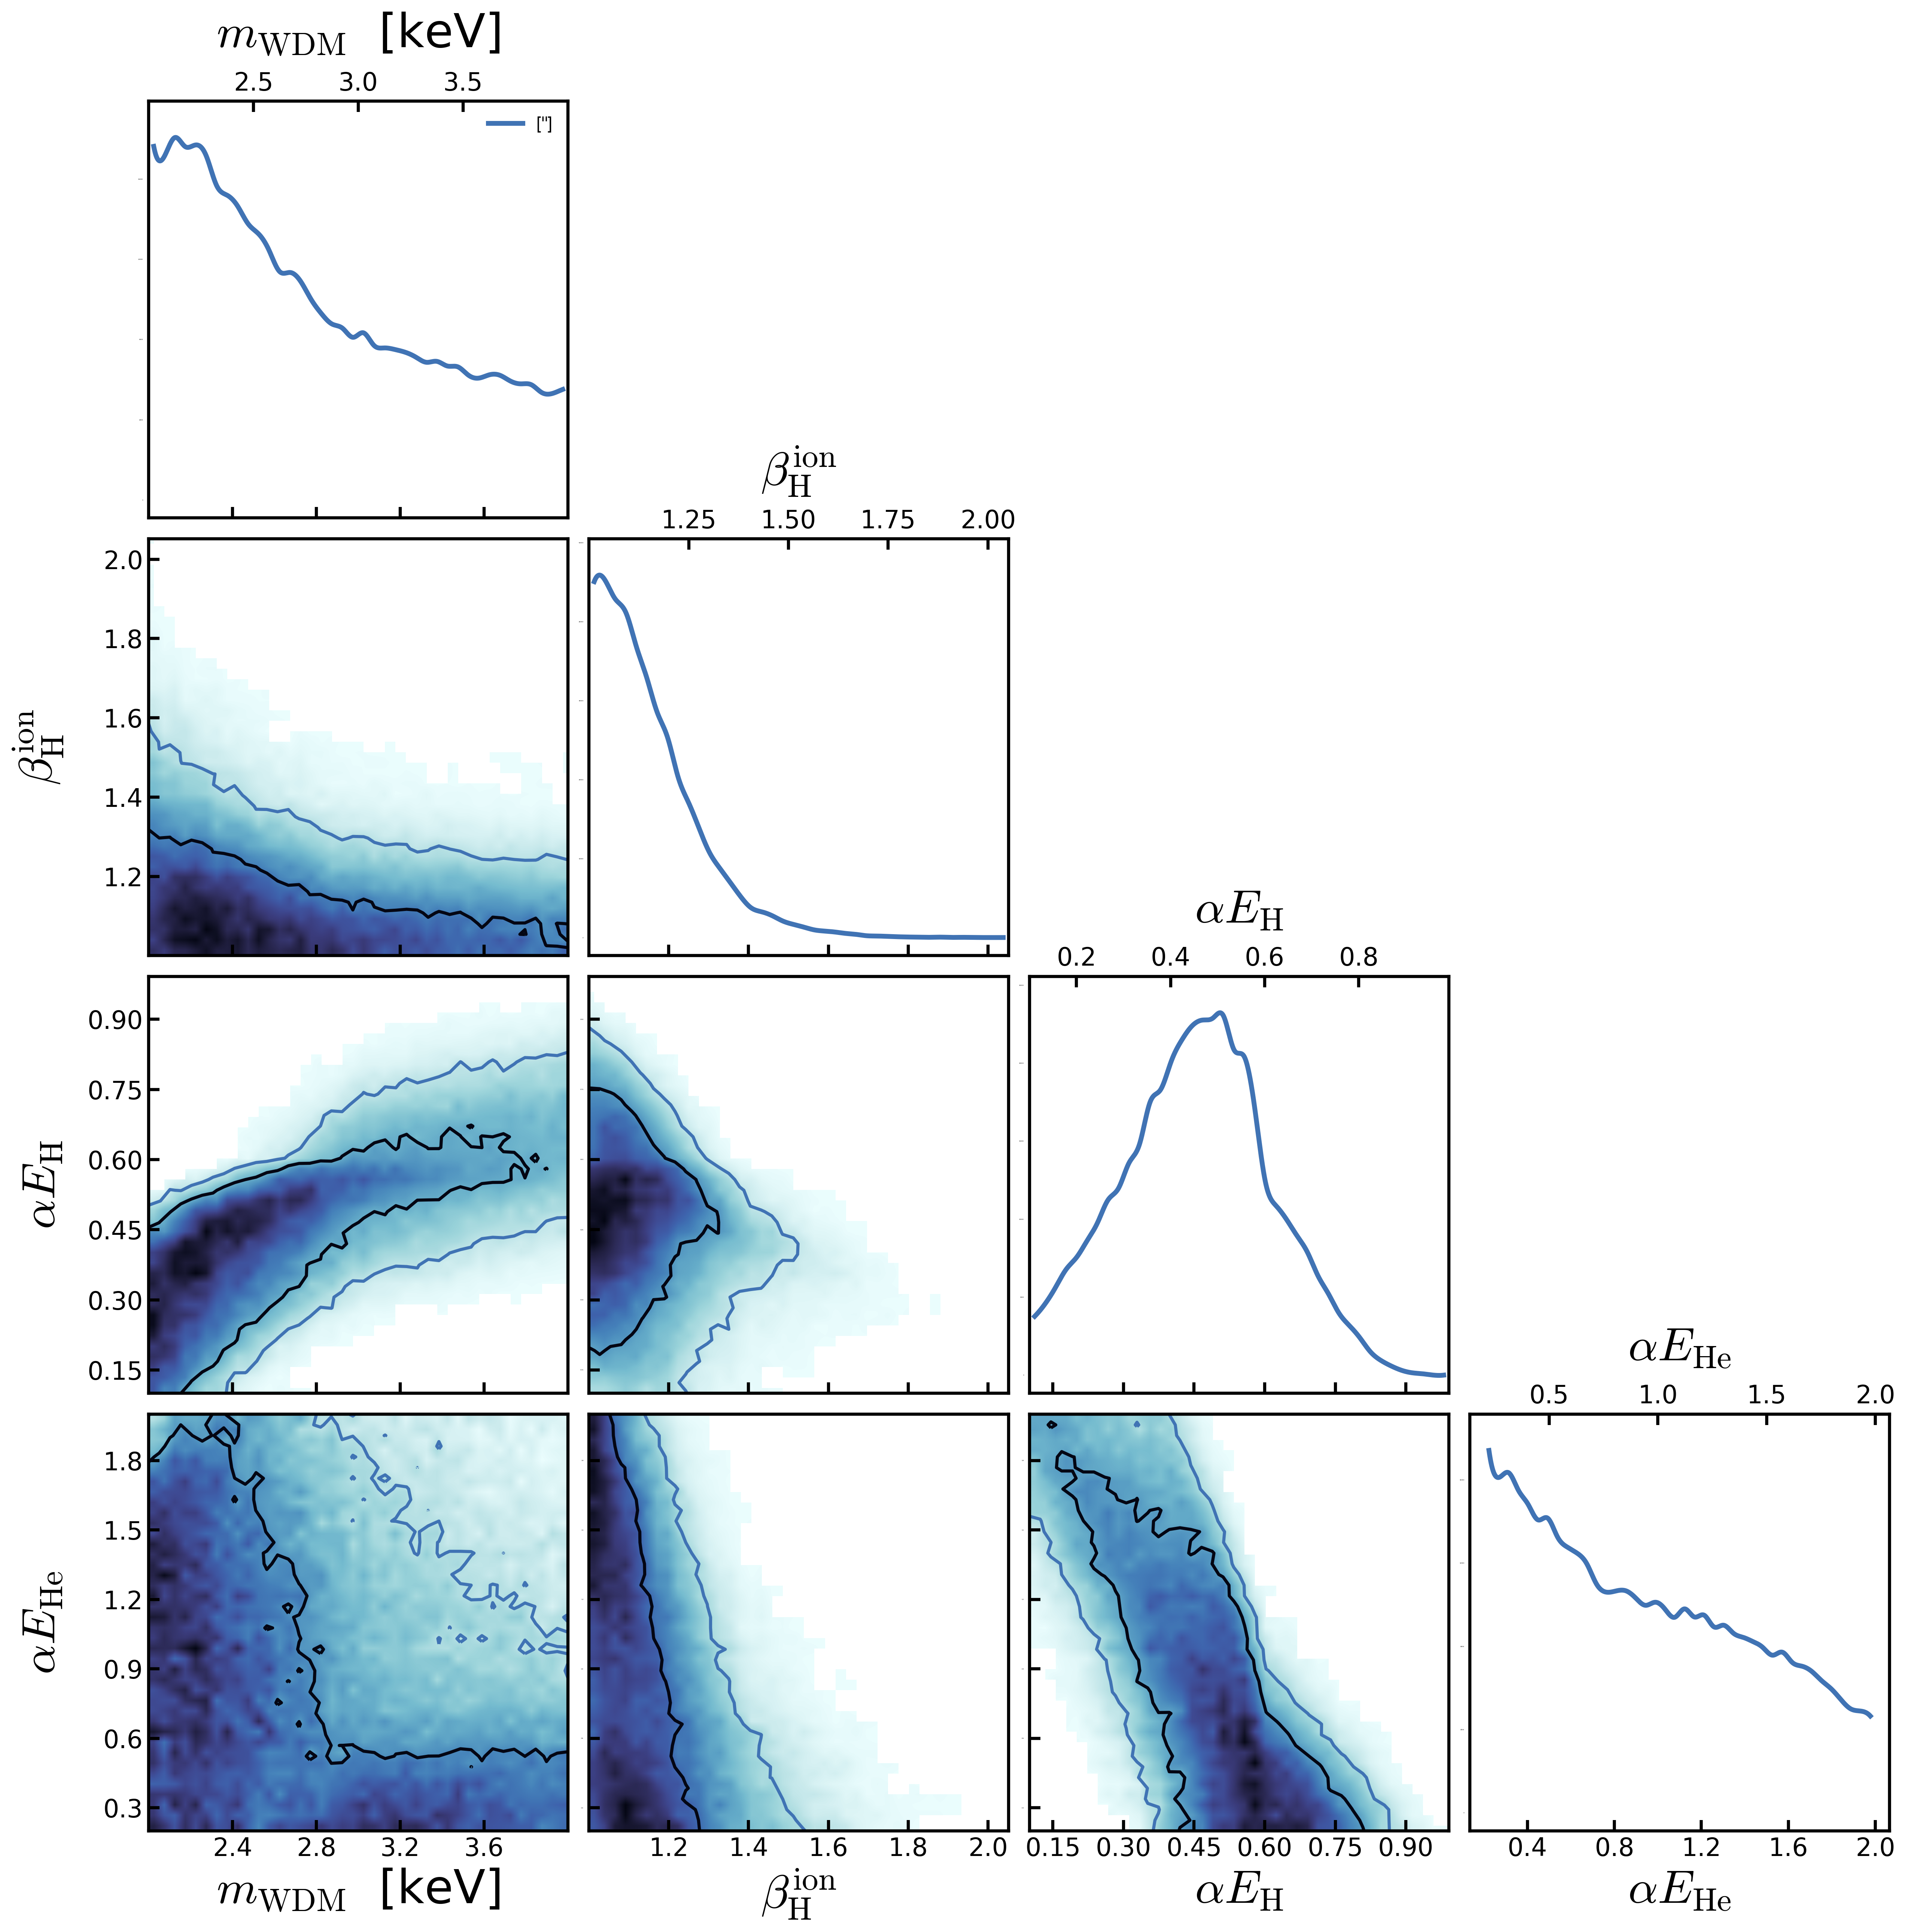
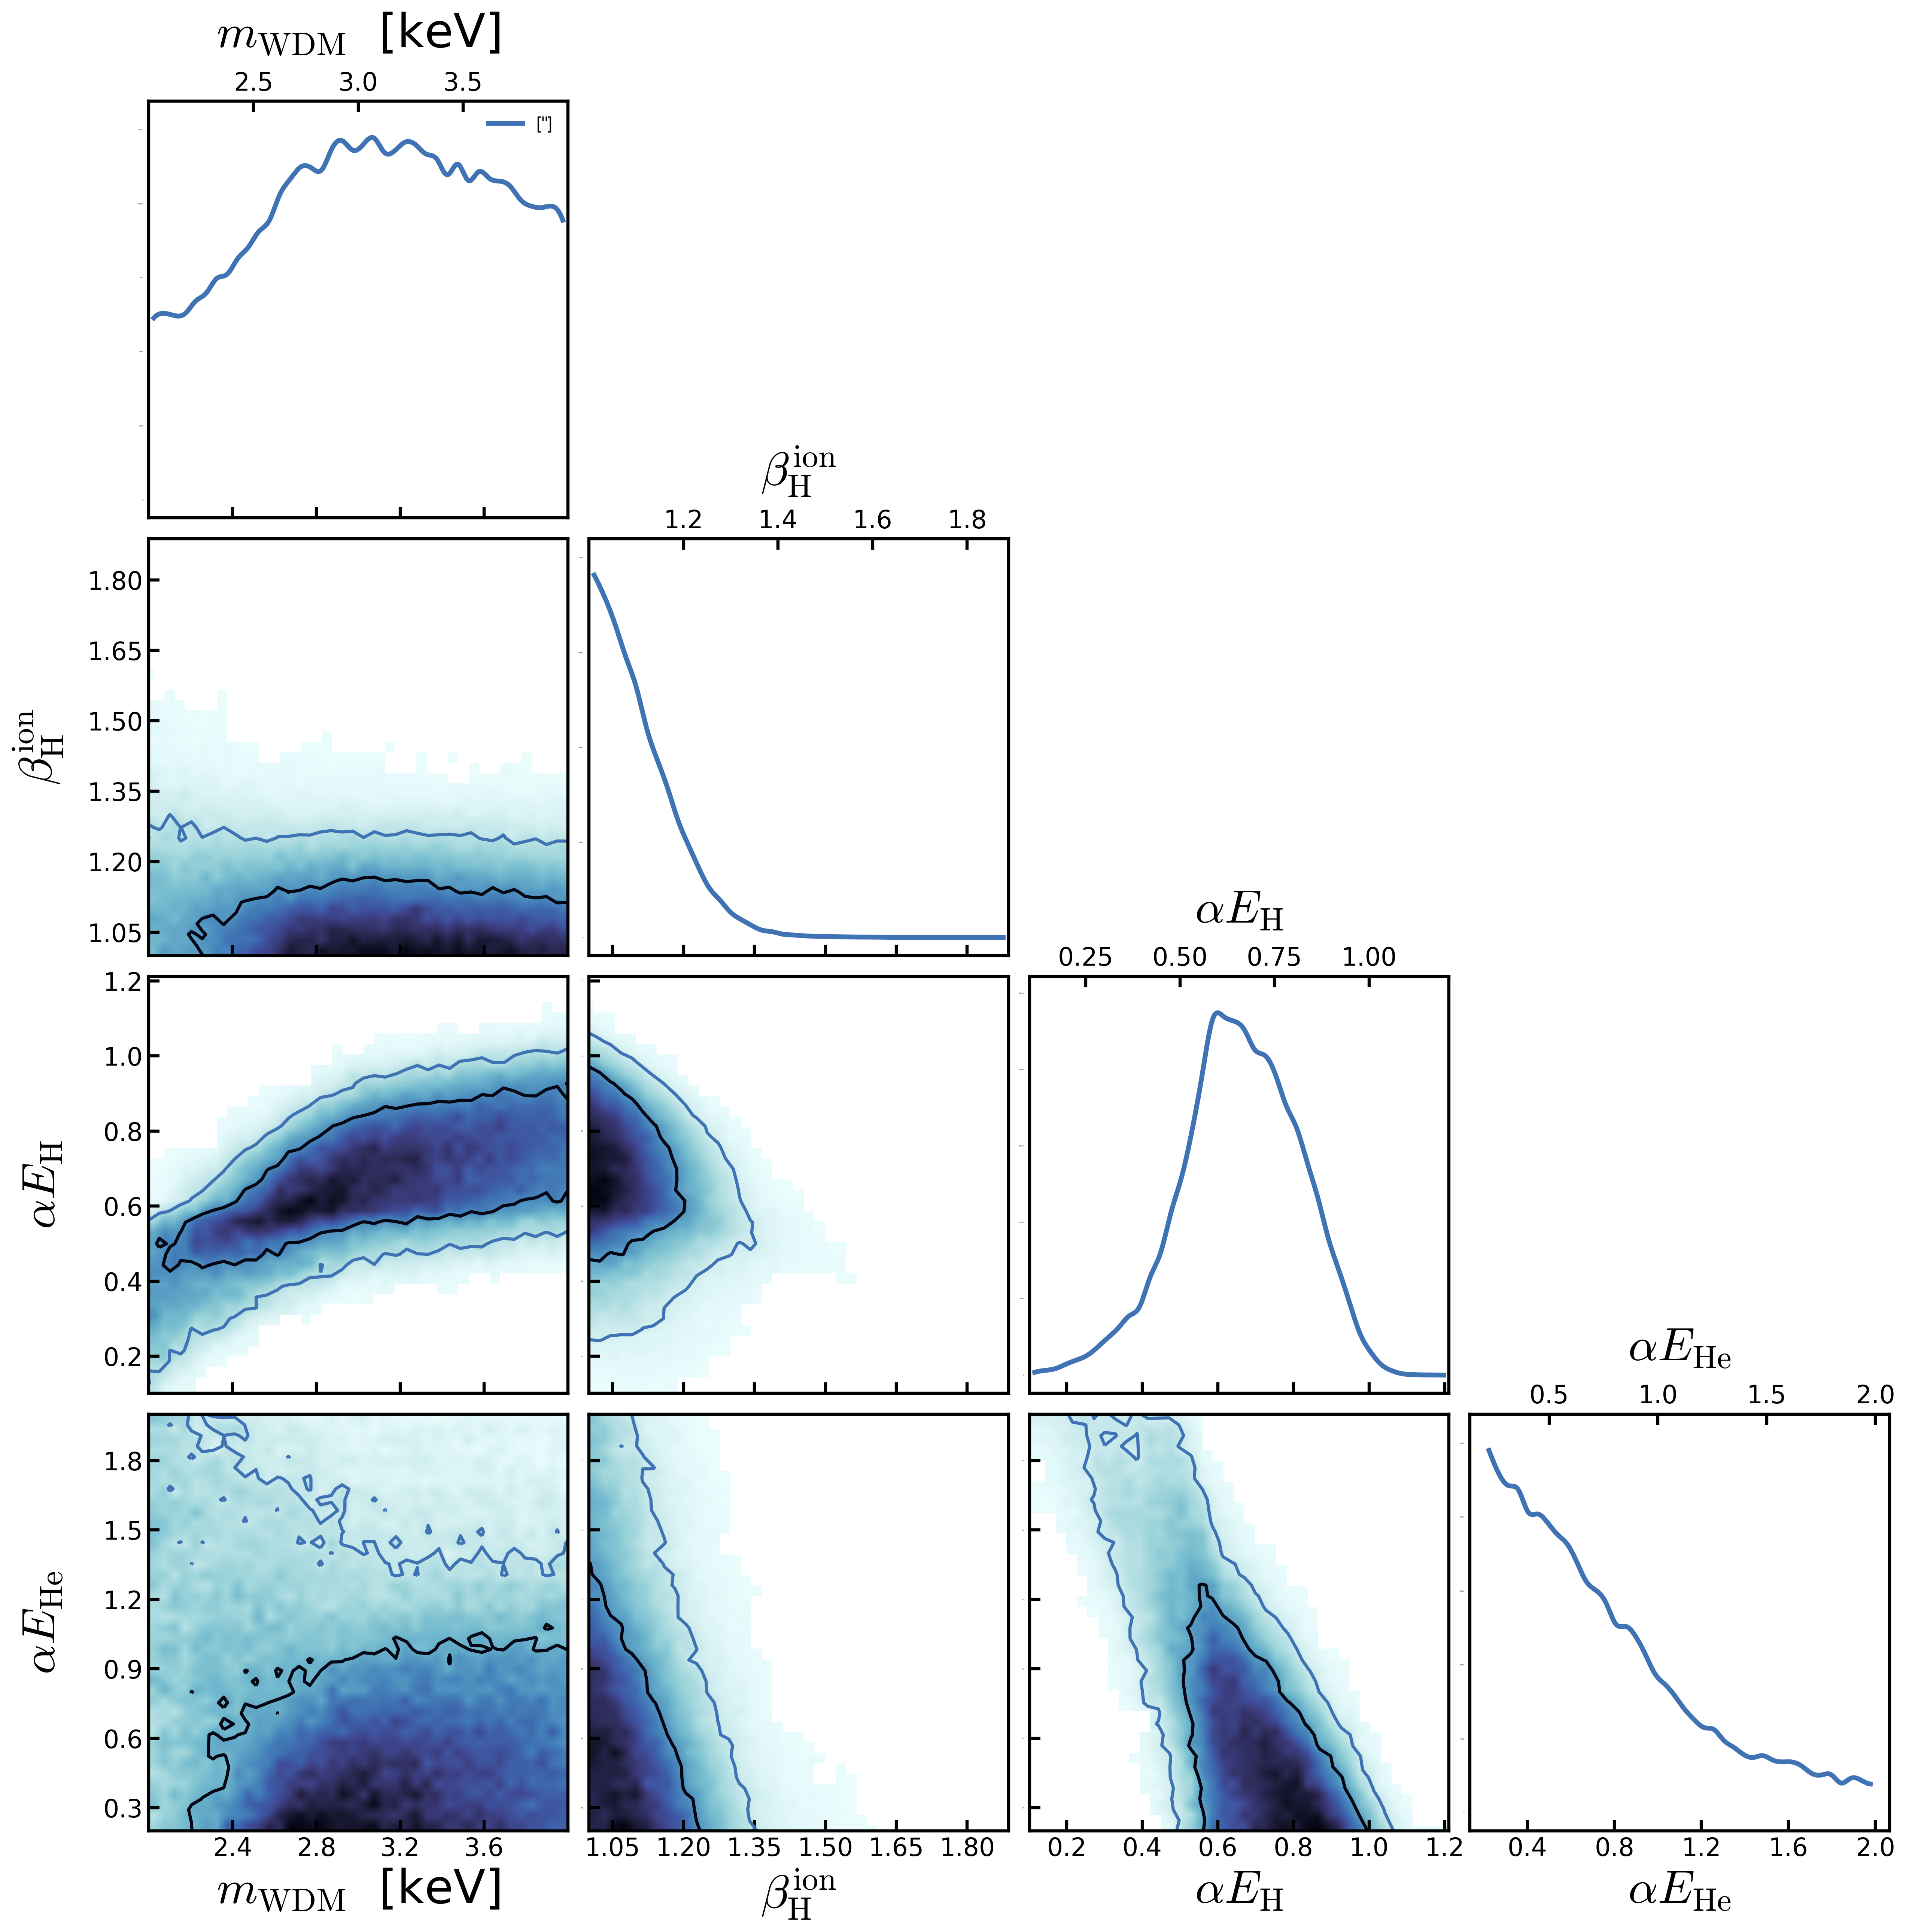
Parameters Distribution Fit to \(z=4.2\)
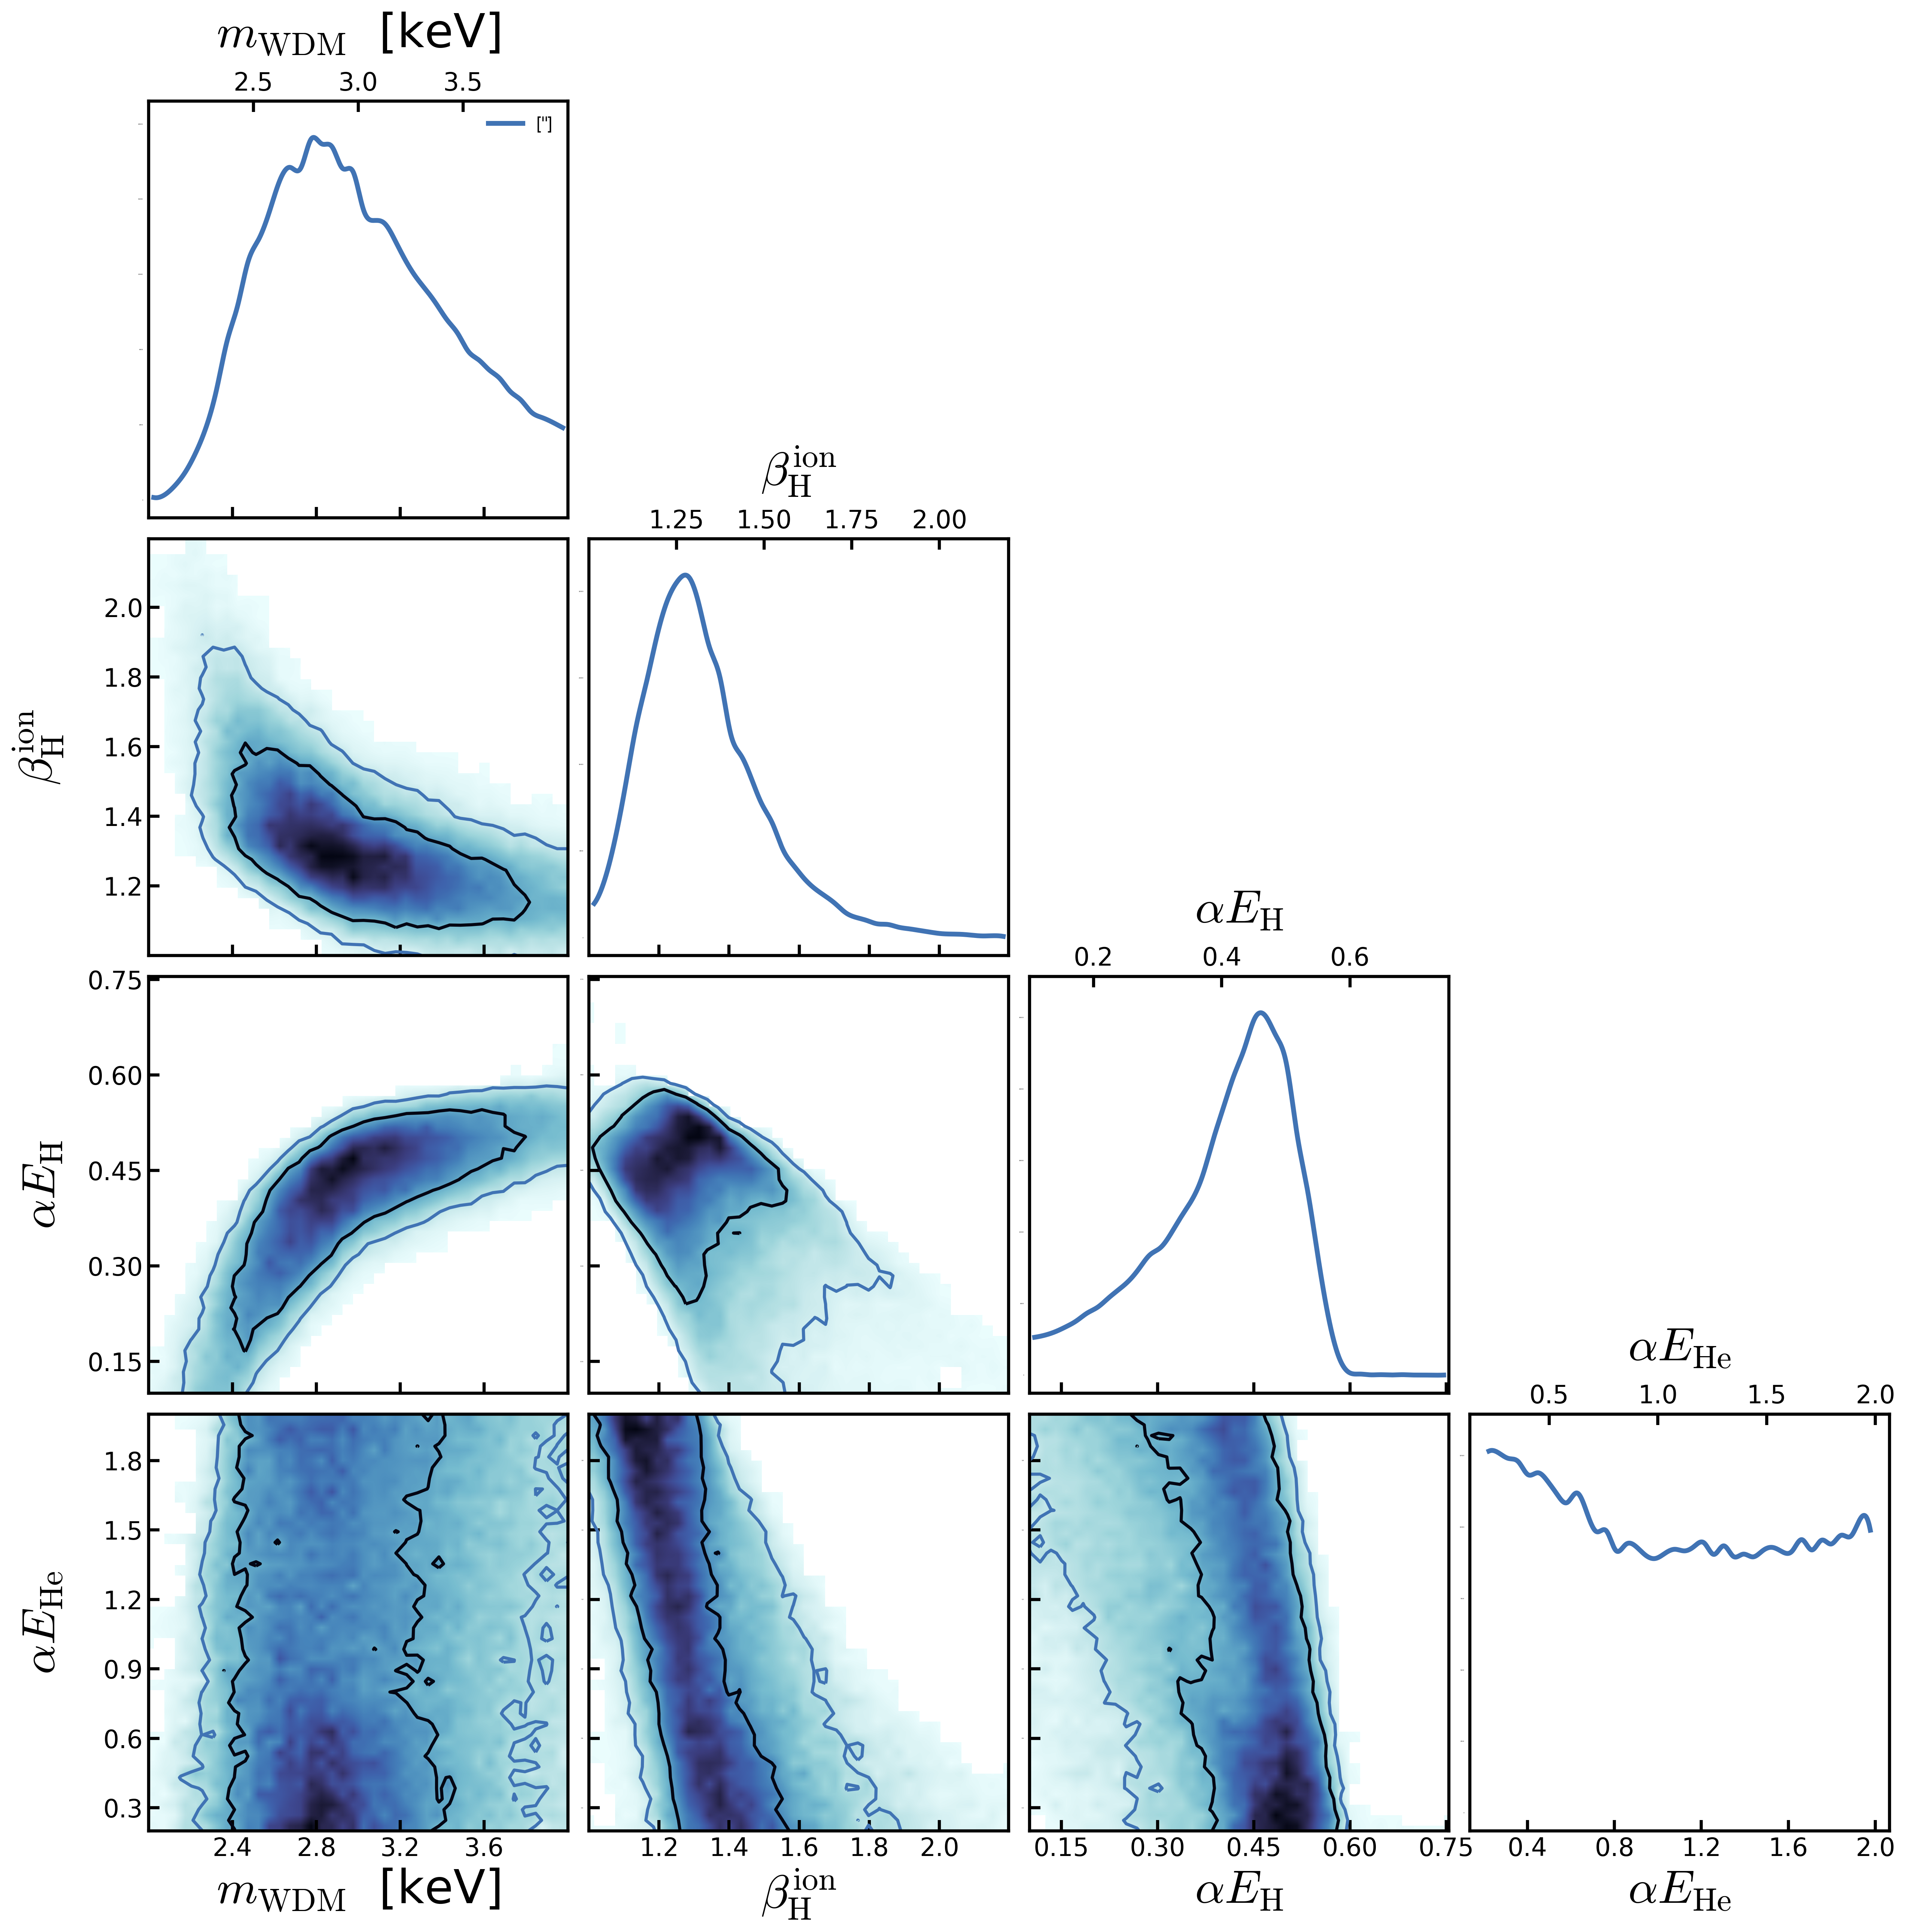
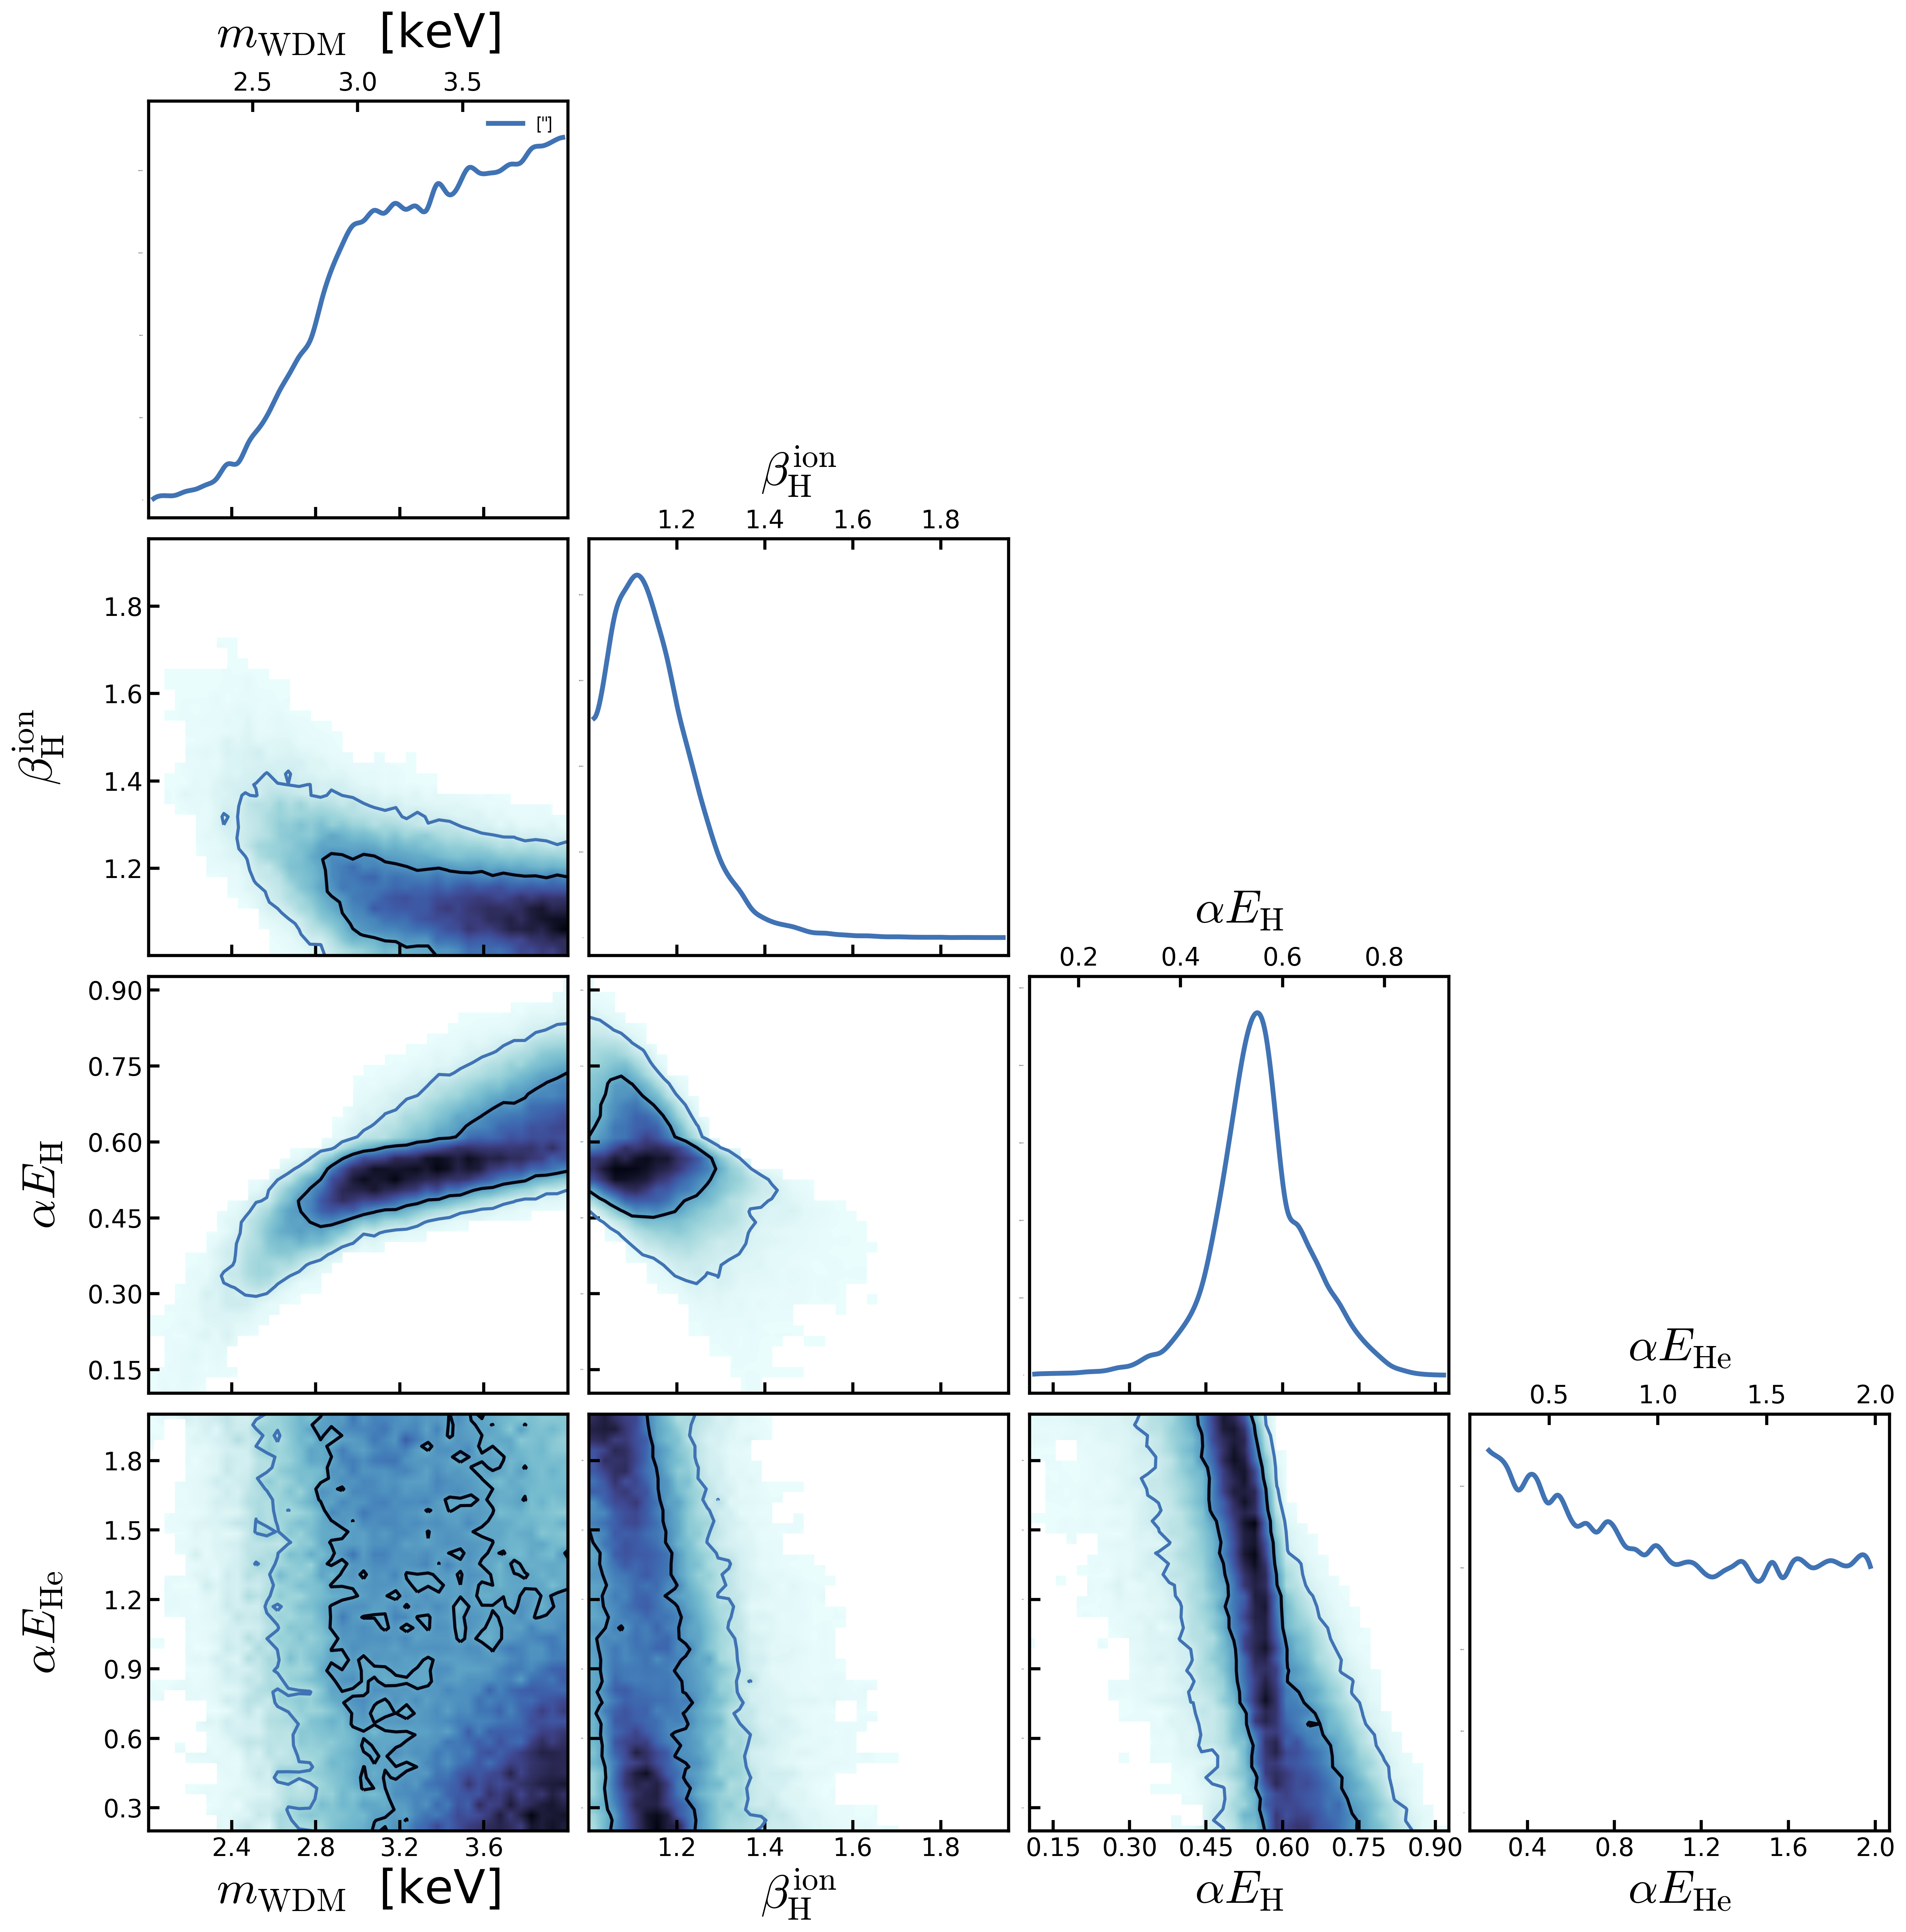
Parameters Distribution Fit to \(z=4.6\)
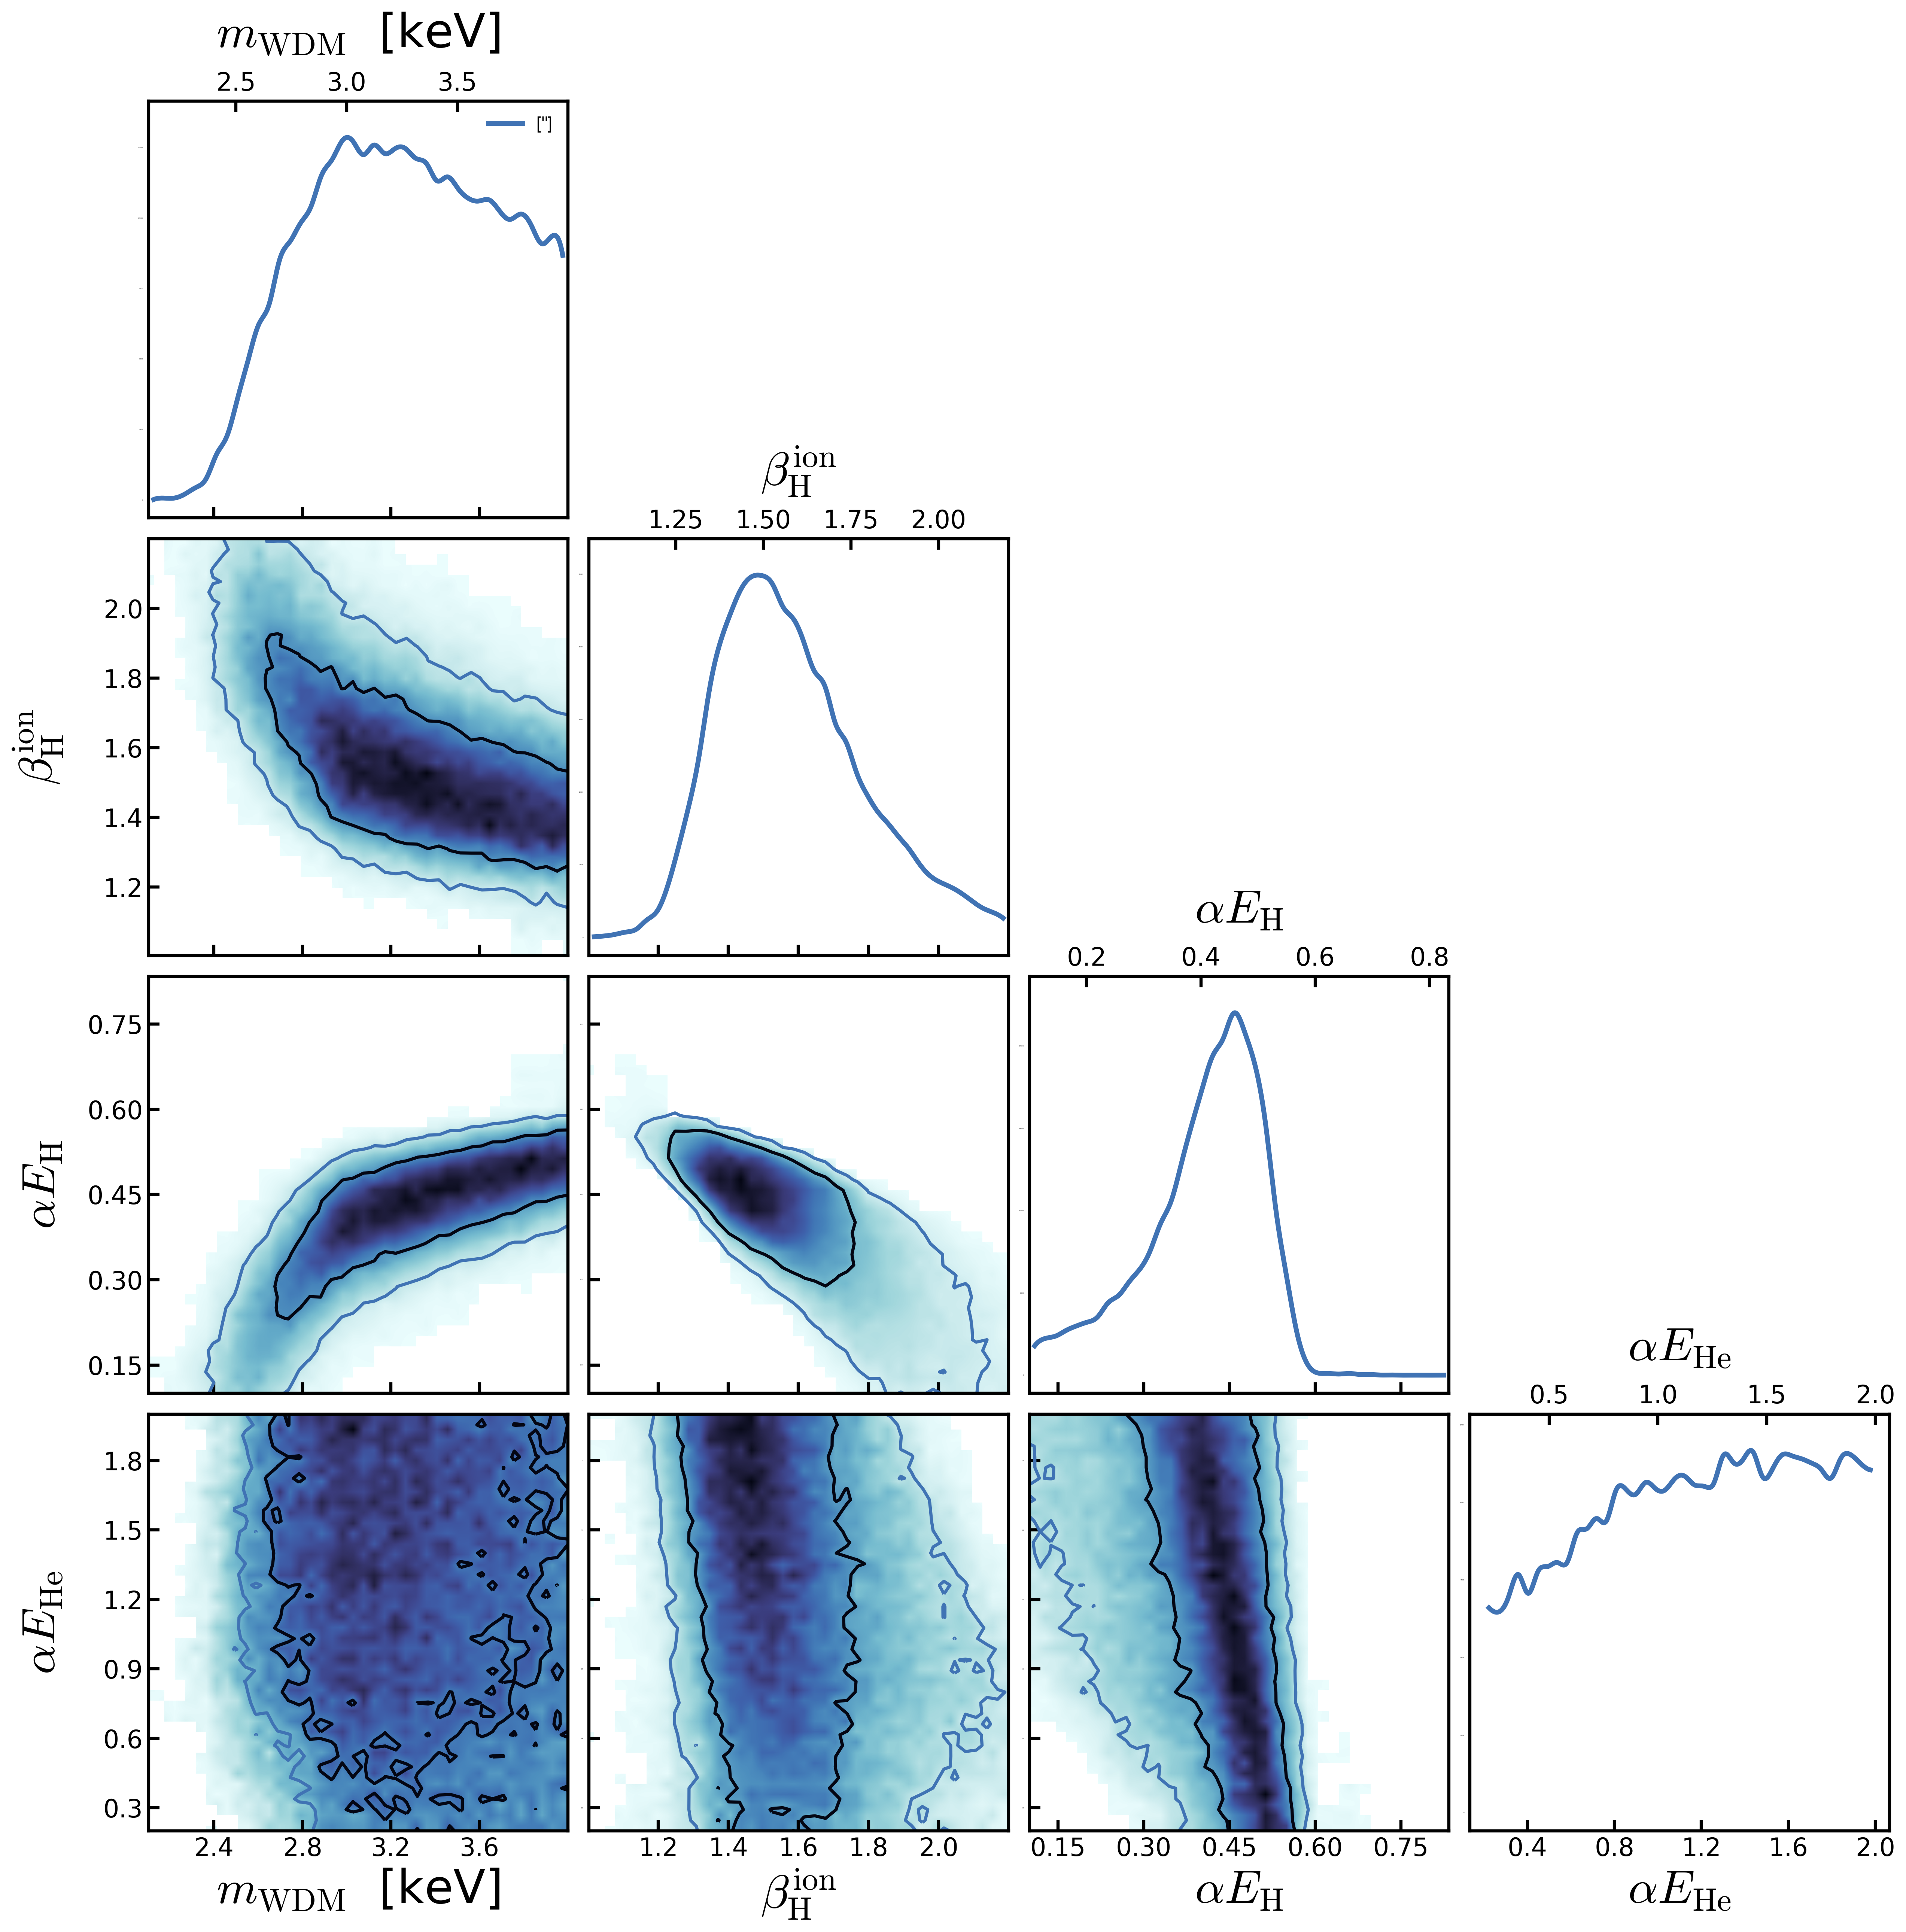
Parameters Distribution Fit to \(z=5.0\)
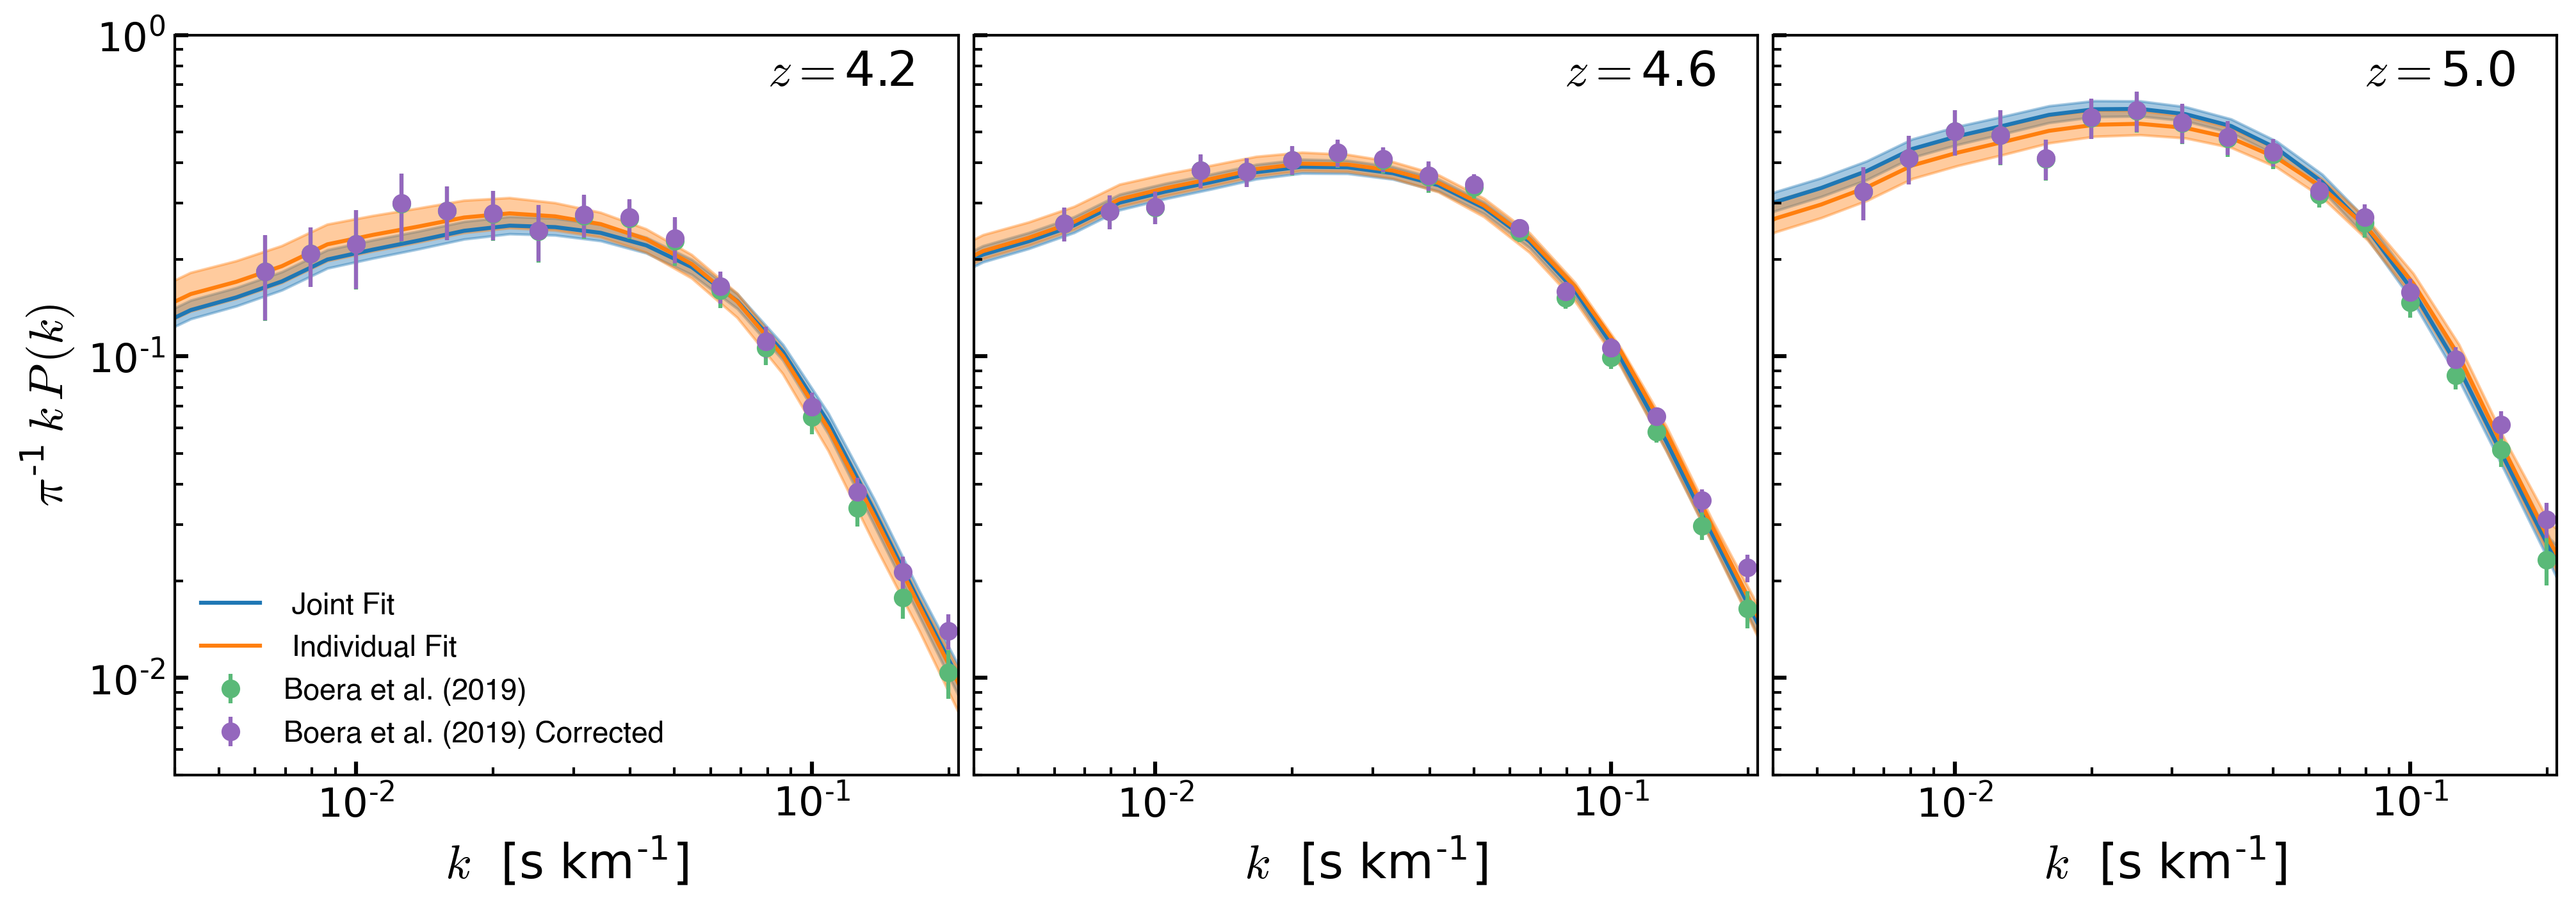
Power Spectrum
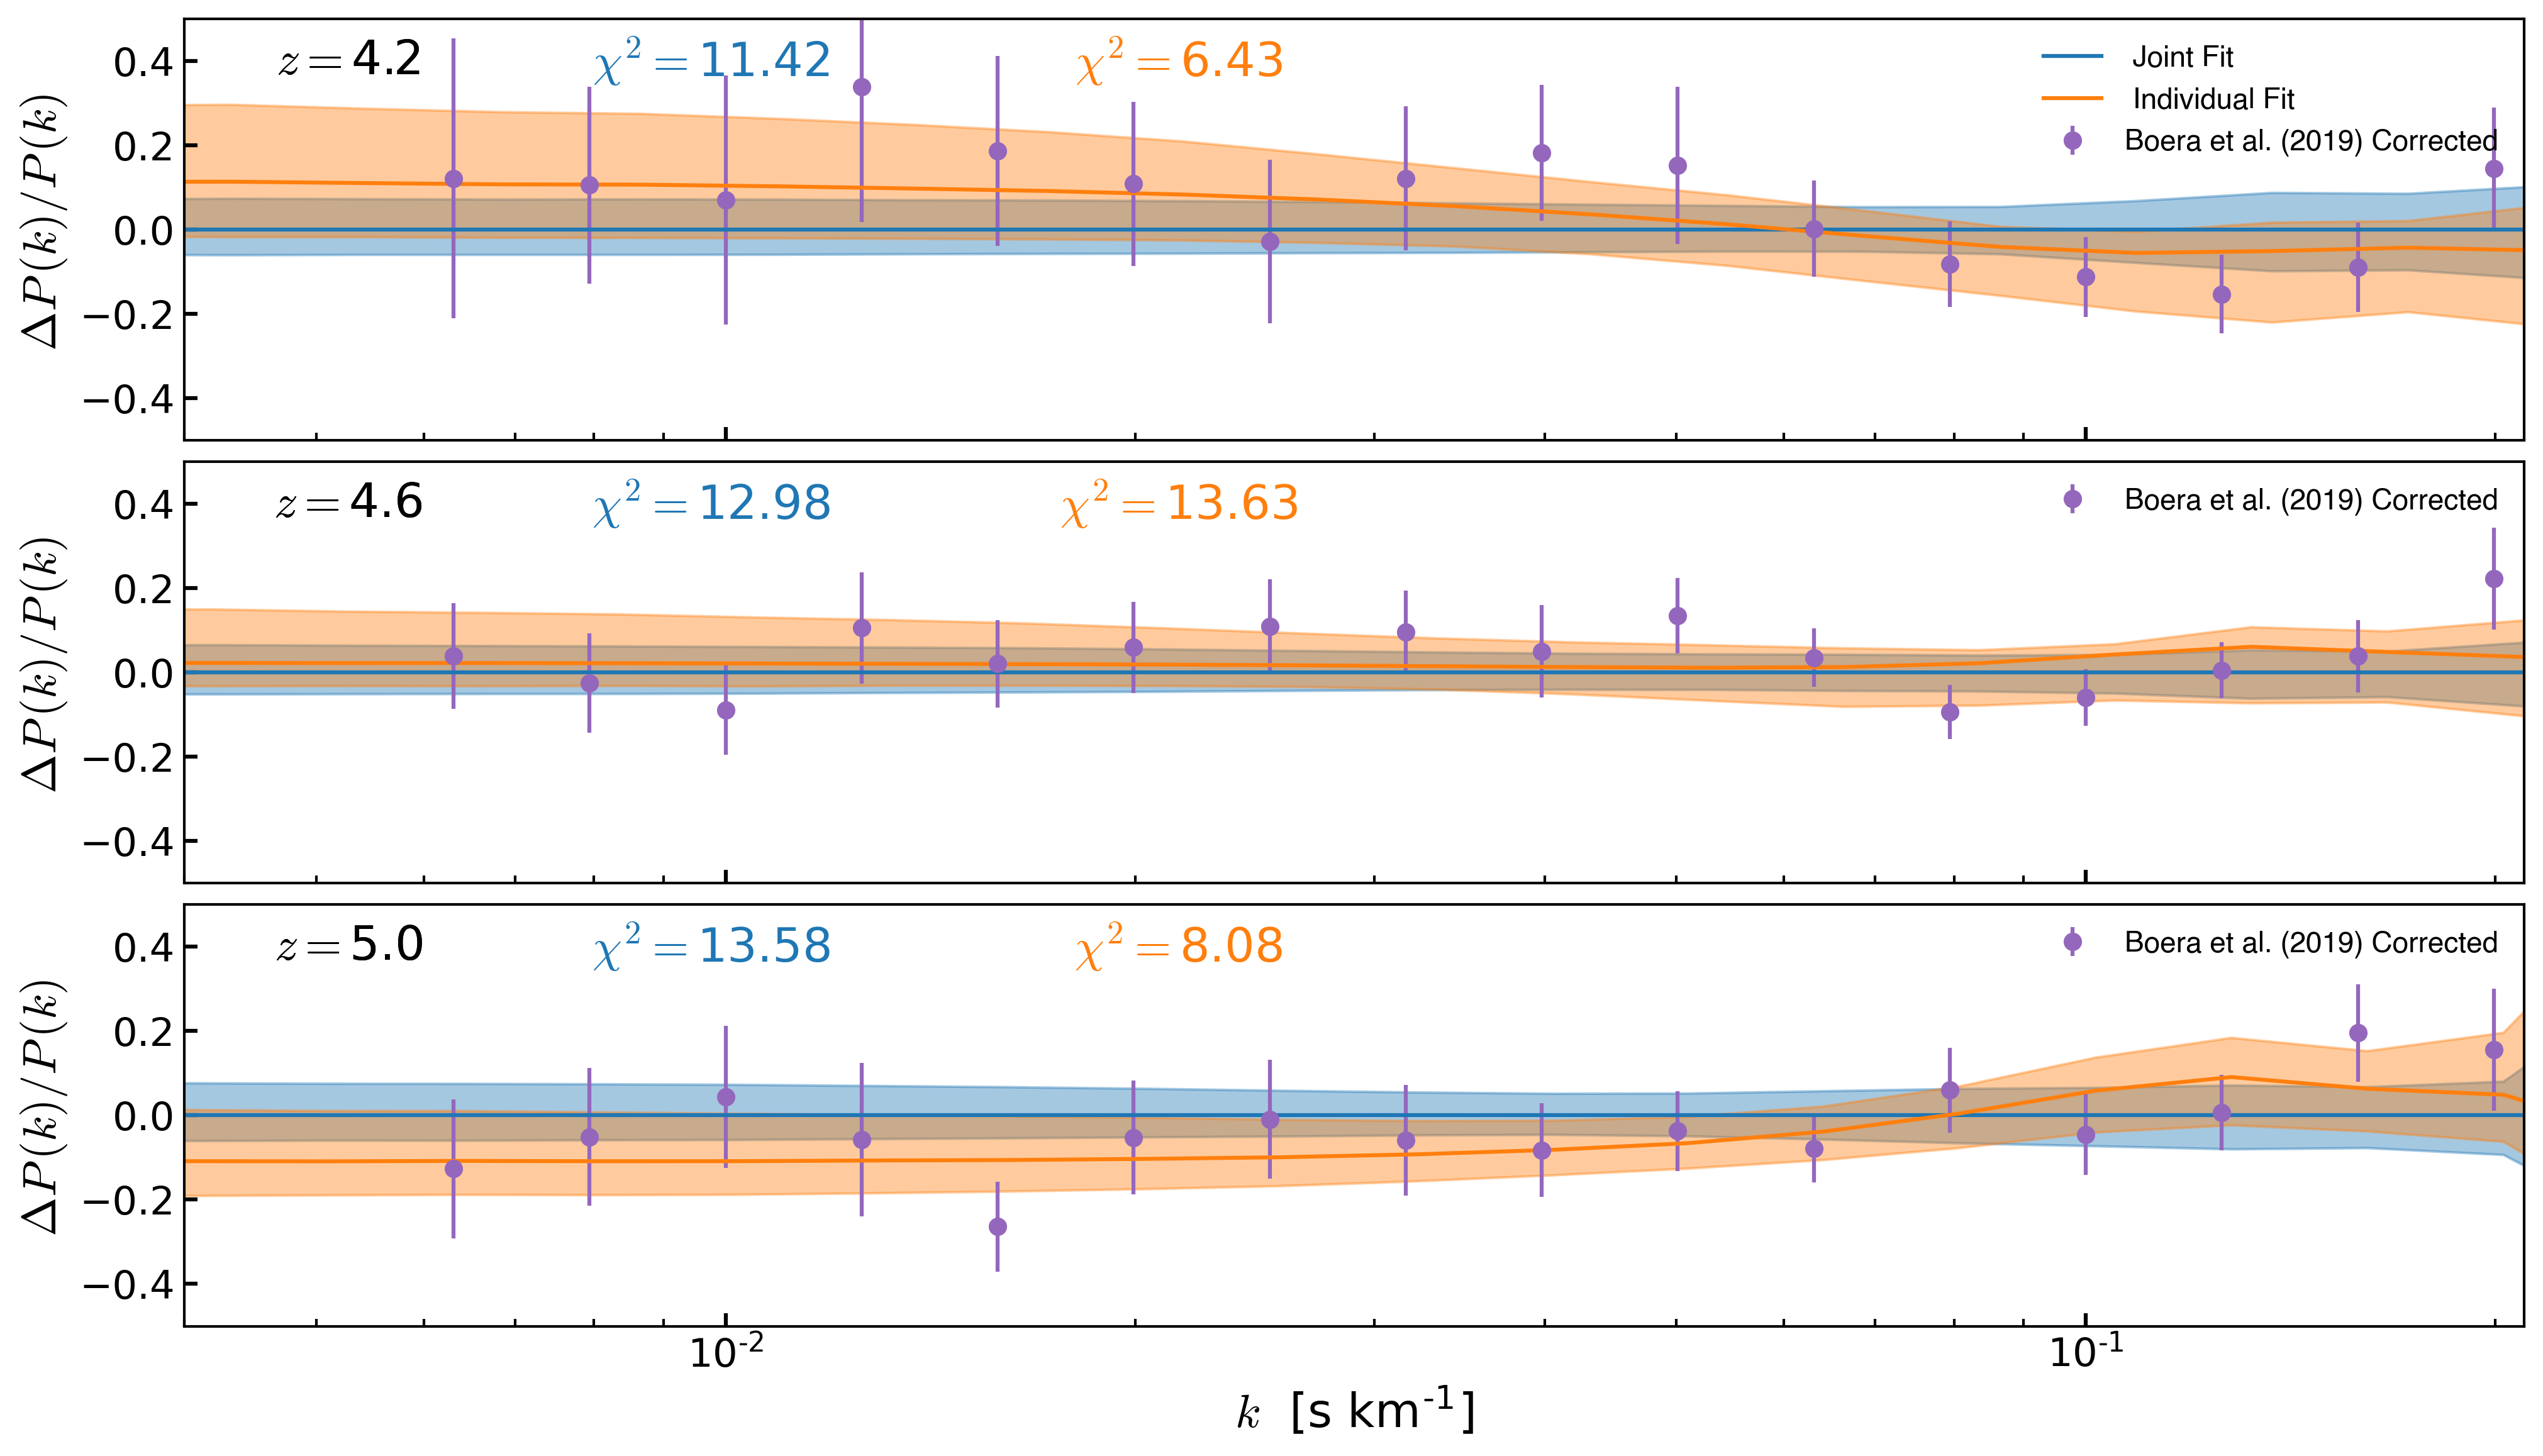
Power Spectrum Difference
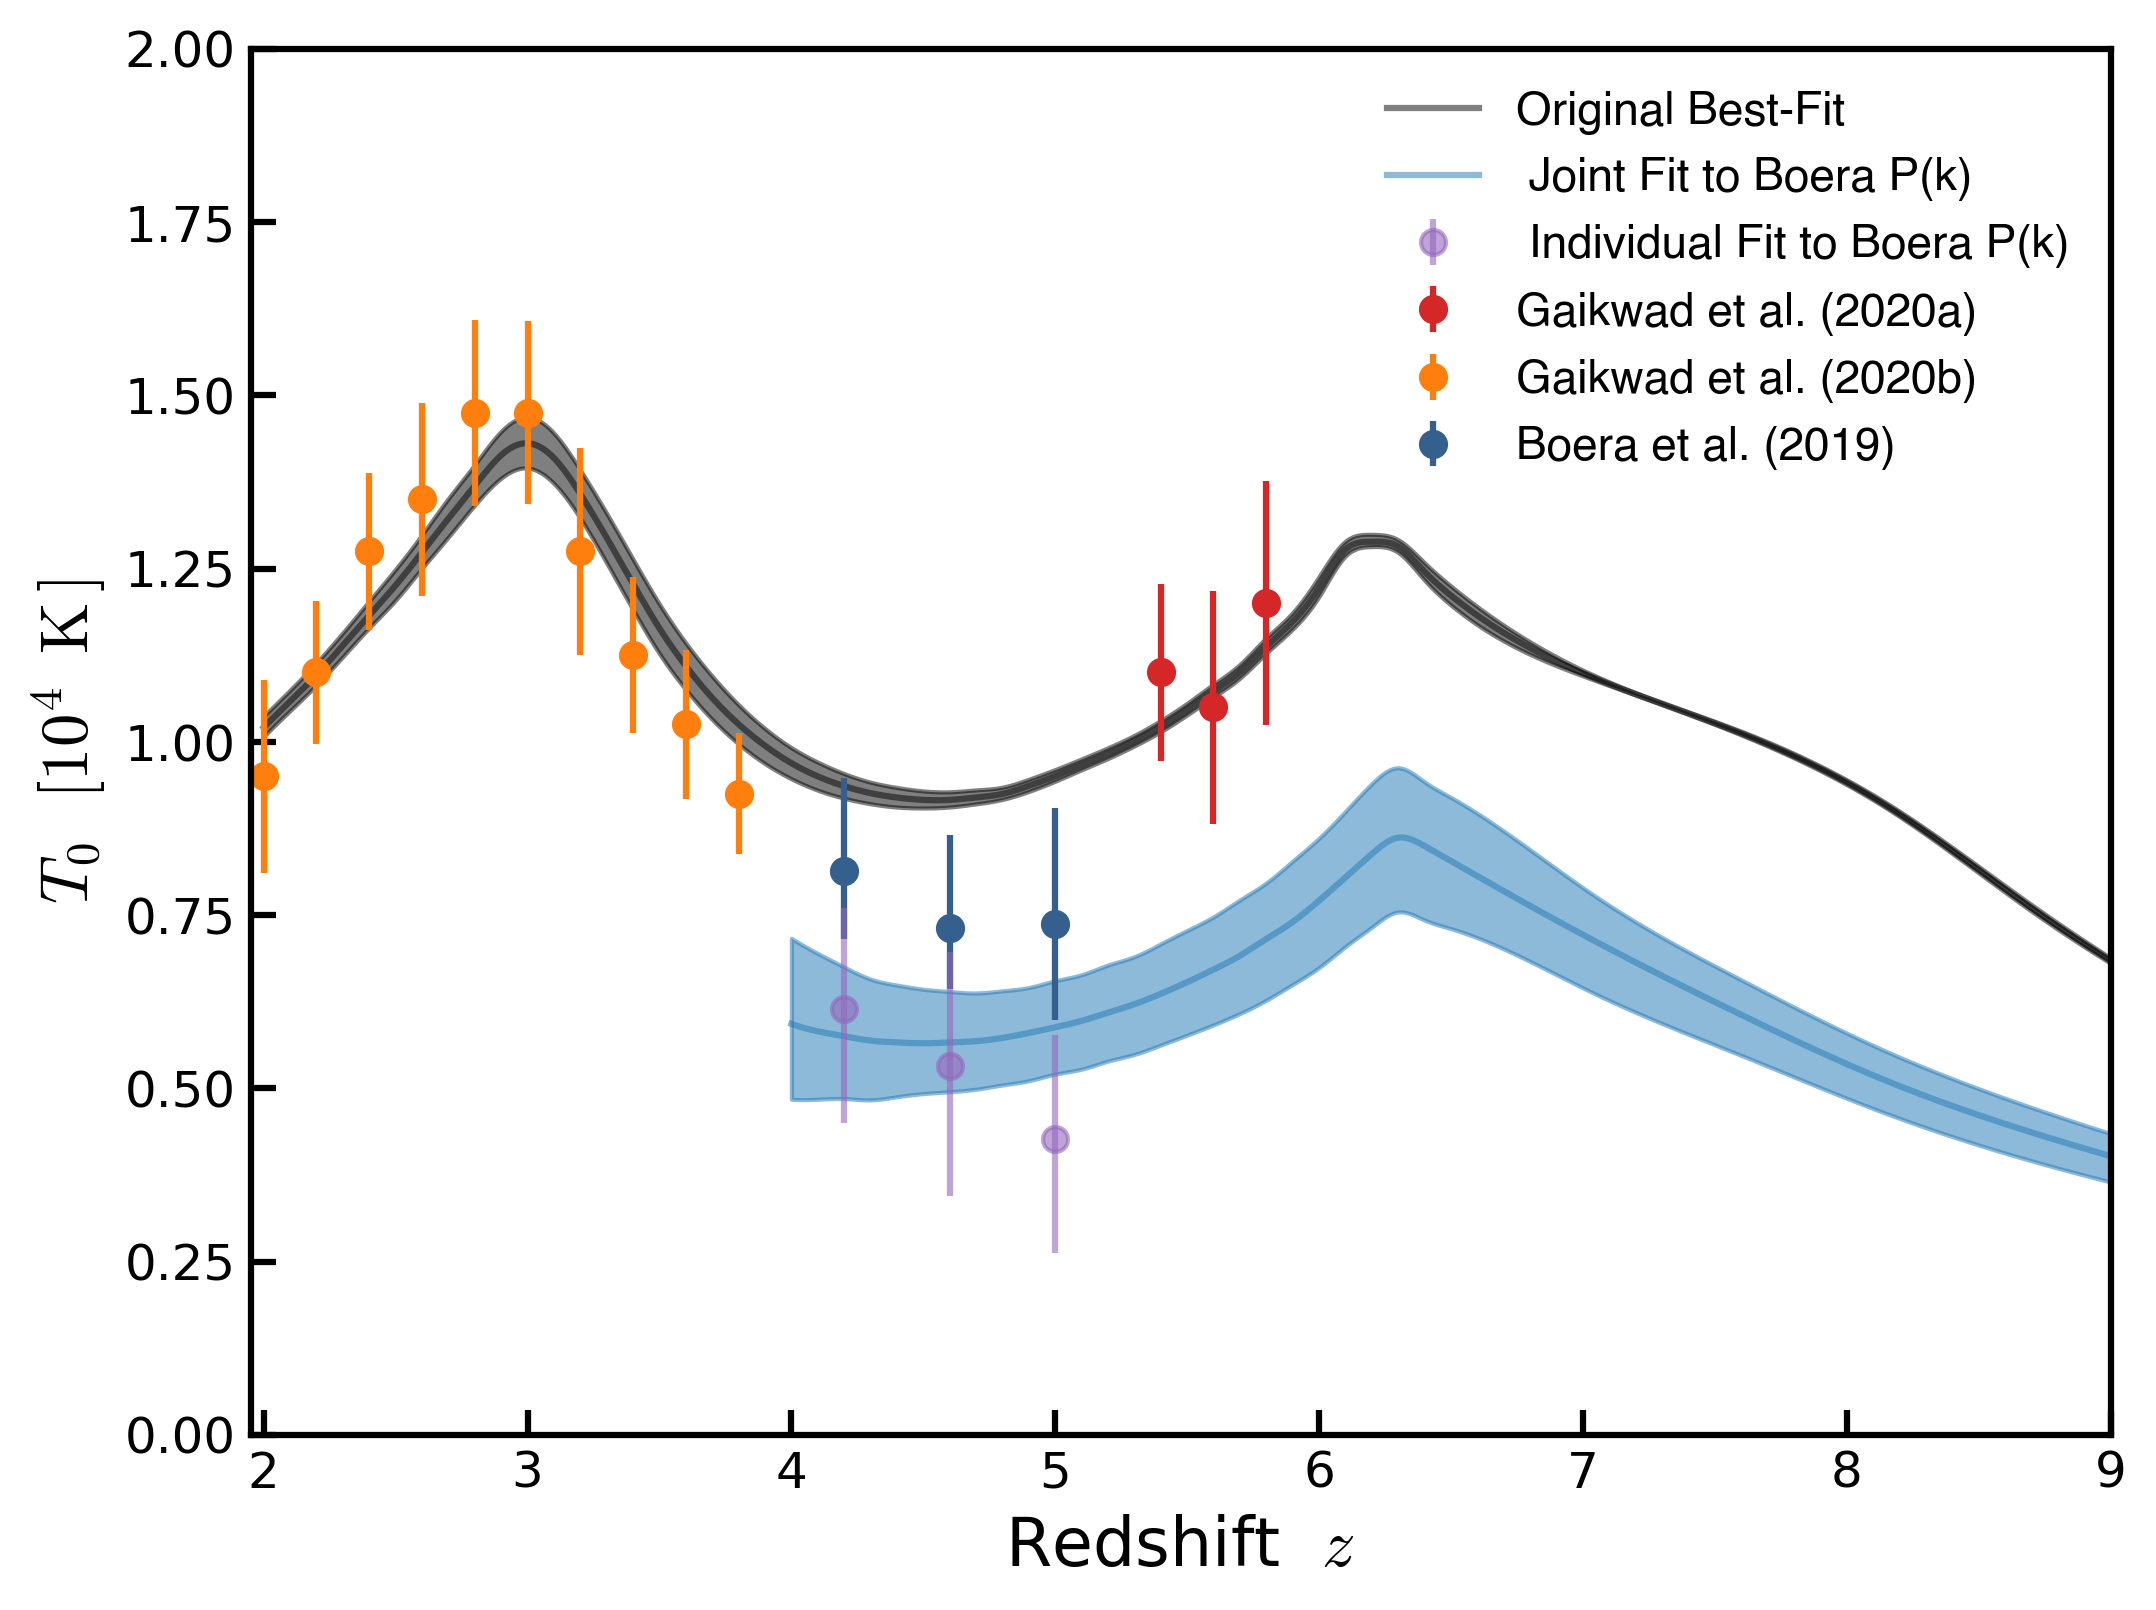
Temperature
Effective Optical Depth

WDM Fit to Boera ( Data not corrected for instrument resolution )
Parameters Distribution Joint Fit to all redshifts
Parameters Distribution Fit to \(z=4.2\)
Parameters Distribution Fit to \(z=4.6\)
Parameters Distribution Fit to \(z=5.0\)
Power Spectrum
Power Spectrum Difference
Temperature
Effective Optical Depth