Effects of WDM on our Measurements
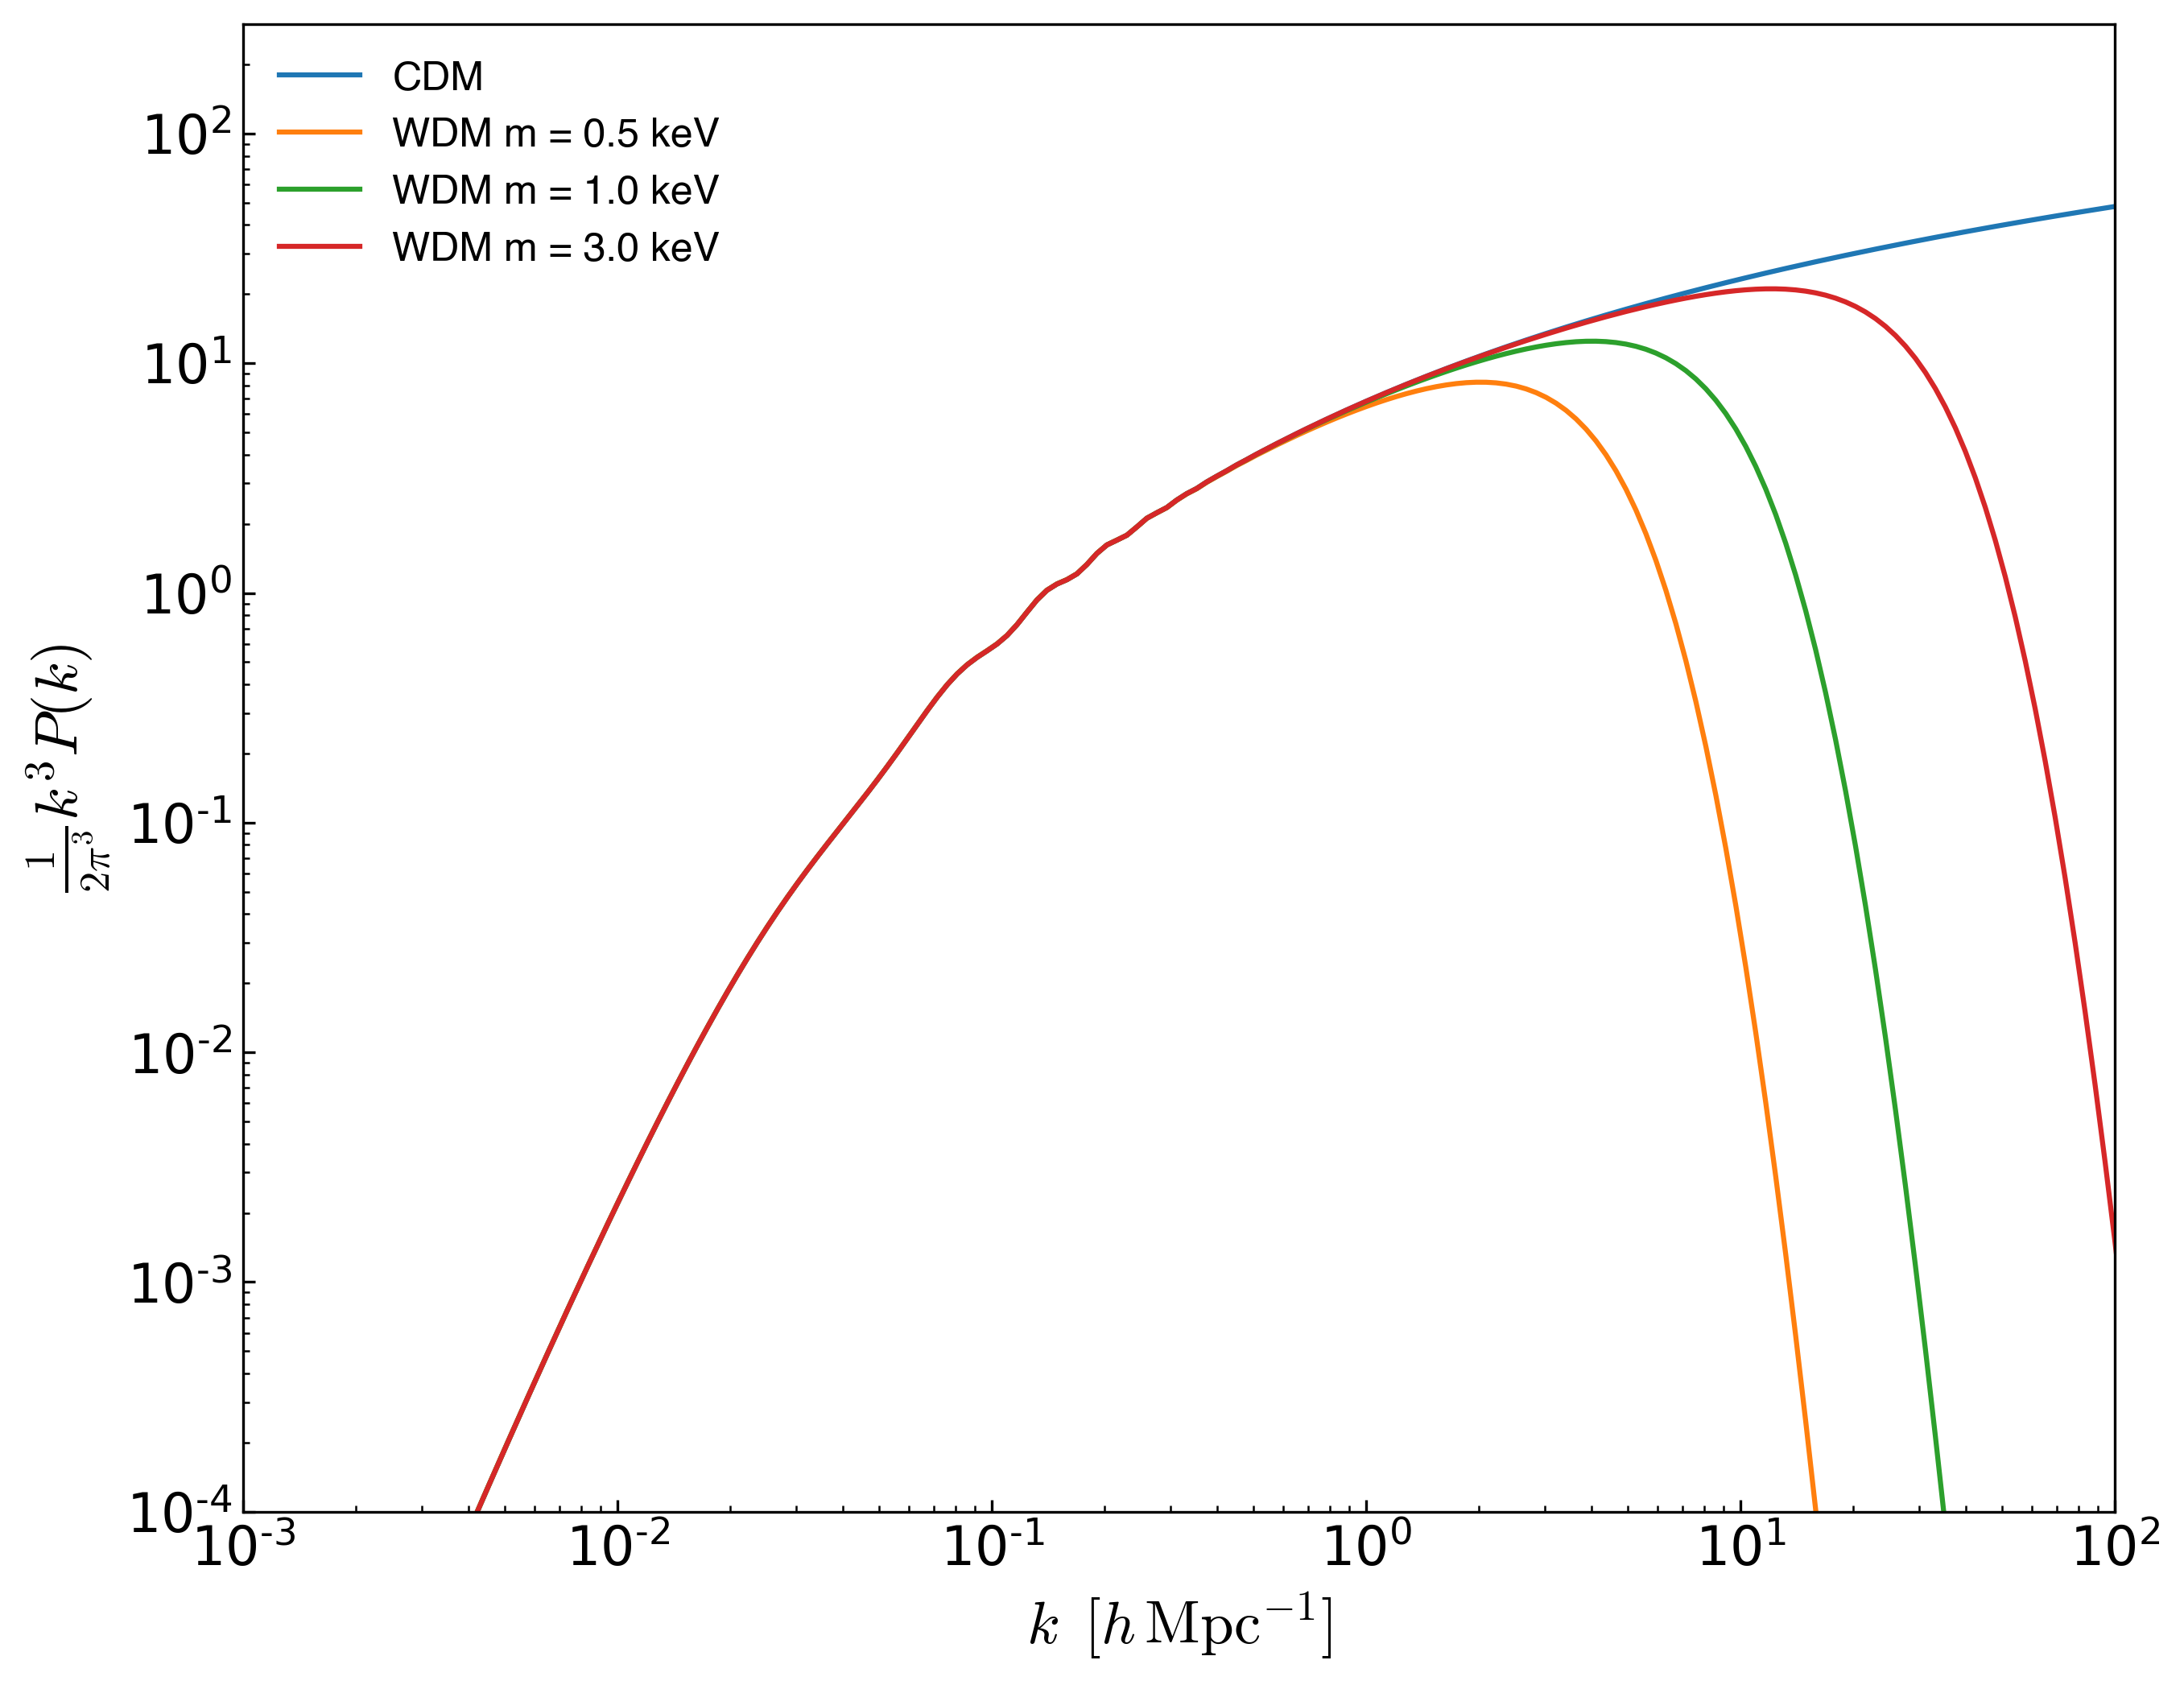
To measure the effects of including wdm our measuremenets, I ran 3 simulations with WDM masses of [ 0.5, 1.0, 3.0 ] keV, all of them use the our new model for the photoheating and photoionization rates. The simualtion box is 50 Mpc/h and a 1024^3 grid for all.
\[\beta_{\mathrm{He}} = 0.44\] \[\beta_{\mathrm{H}} = 0.78\] \[\Delta z_{\mathrm{He}} = 0.27\] \[\Delta z_{\mathrm{H}} = 0.05\]Below I show the Input power spectrum used to generate the initial conditions for the 3 wdm simulations:\
Thermal History
Effective Optical Depth
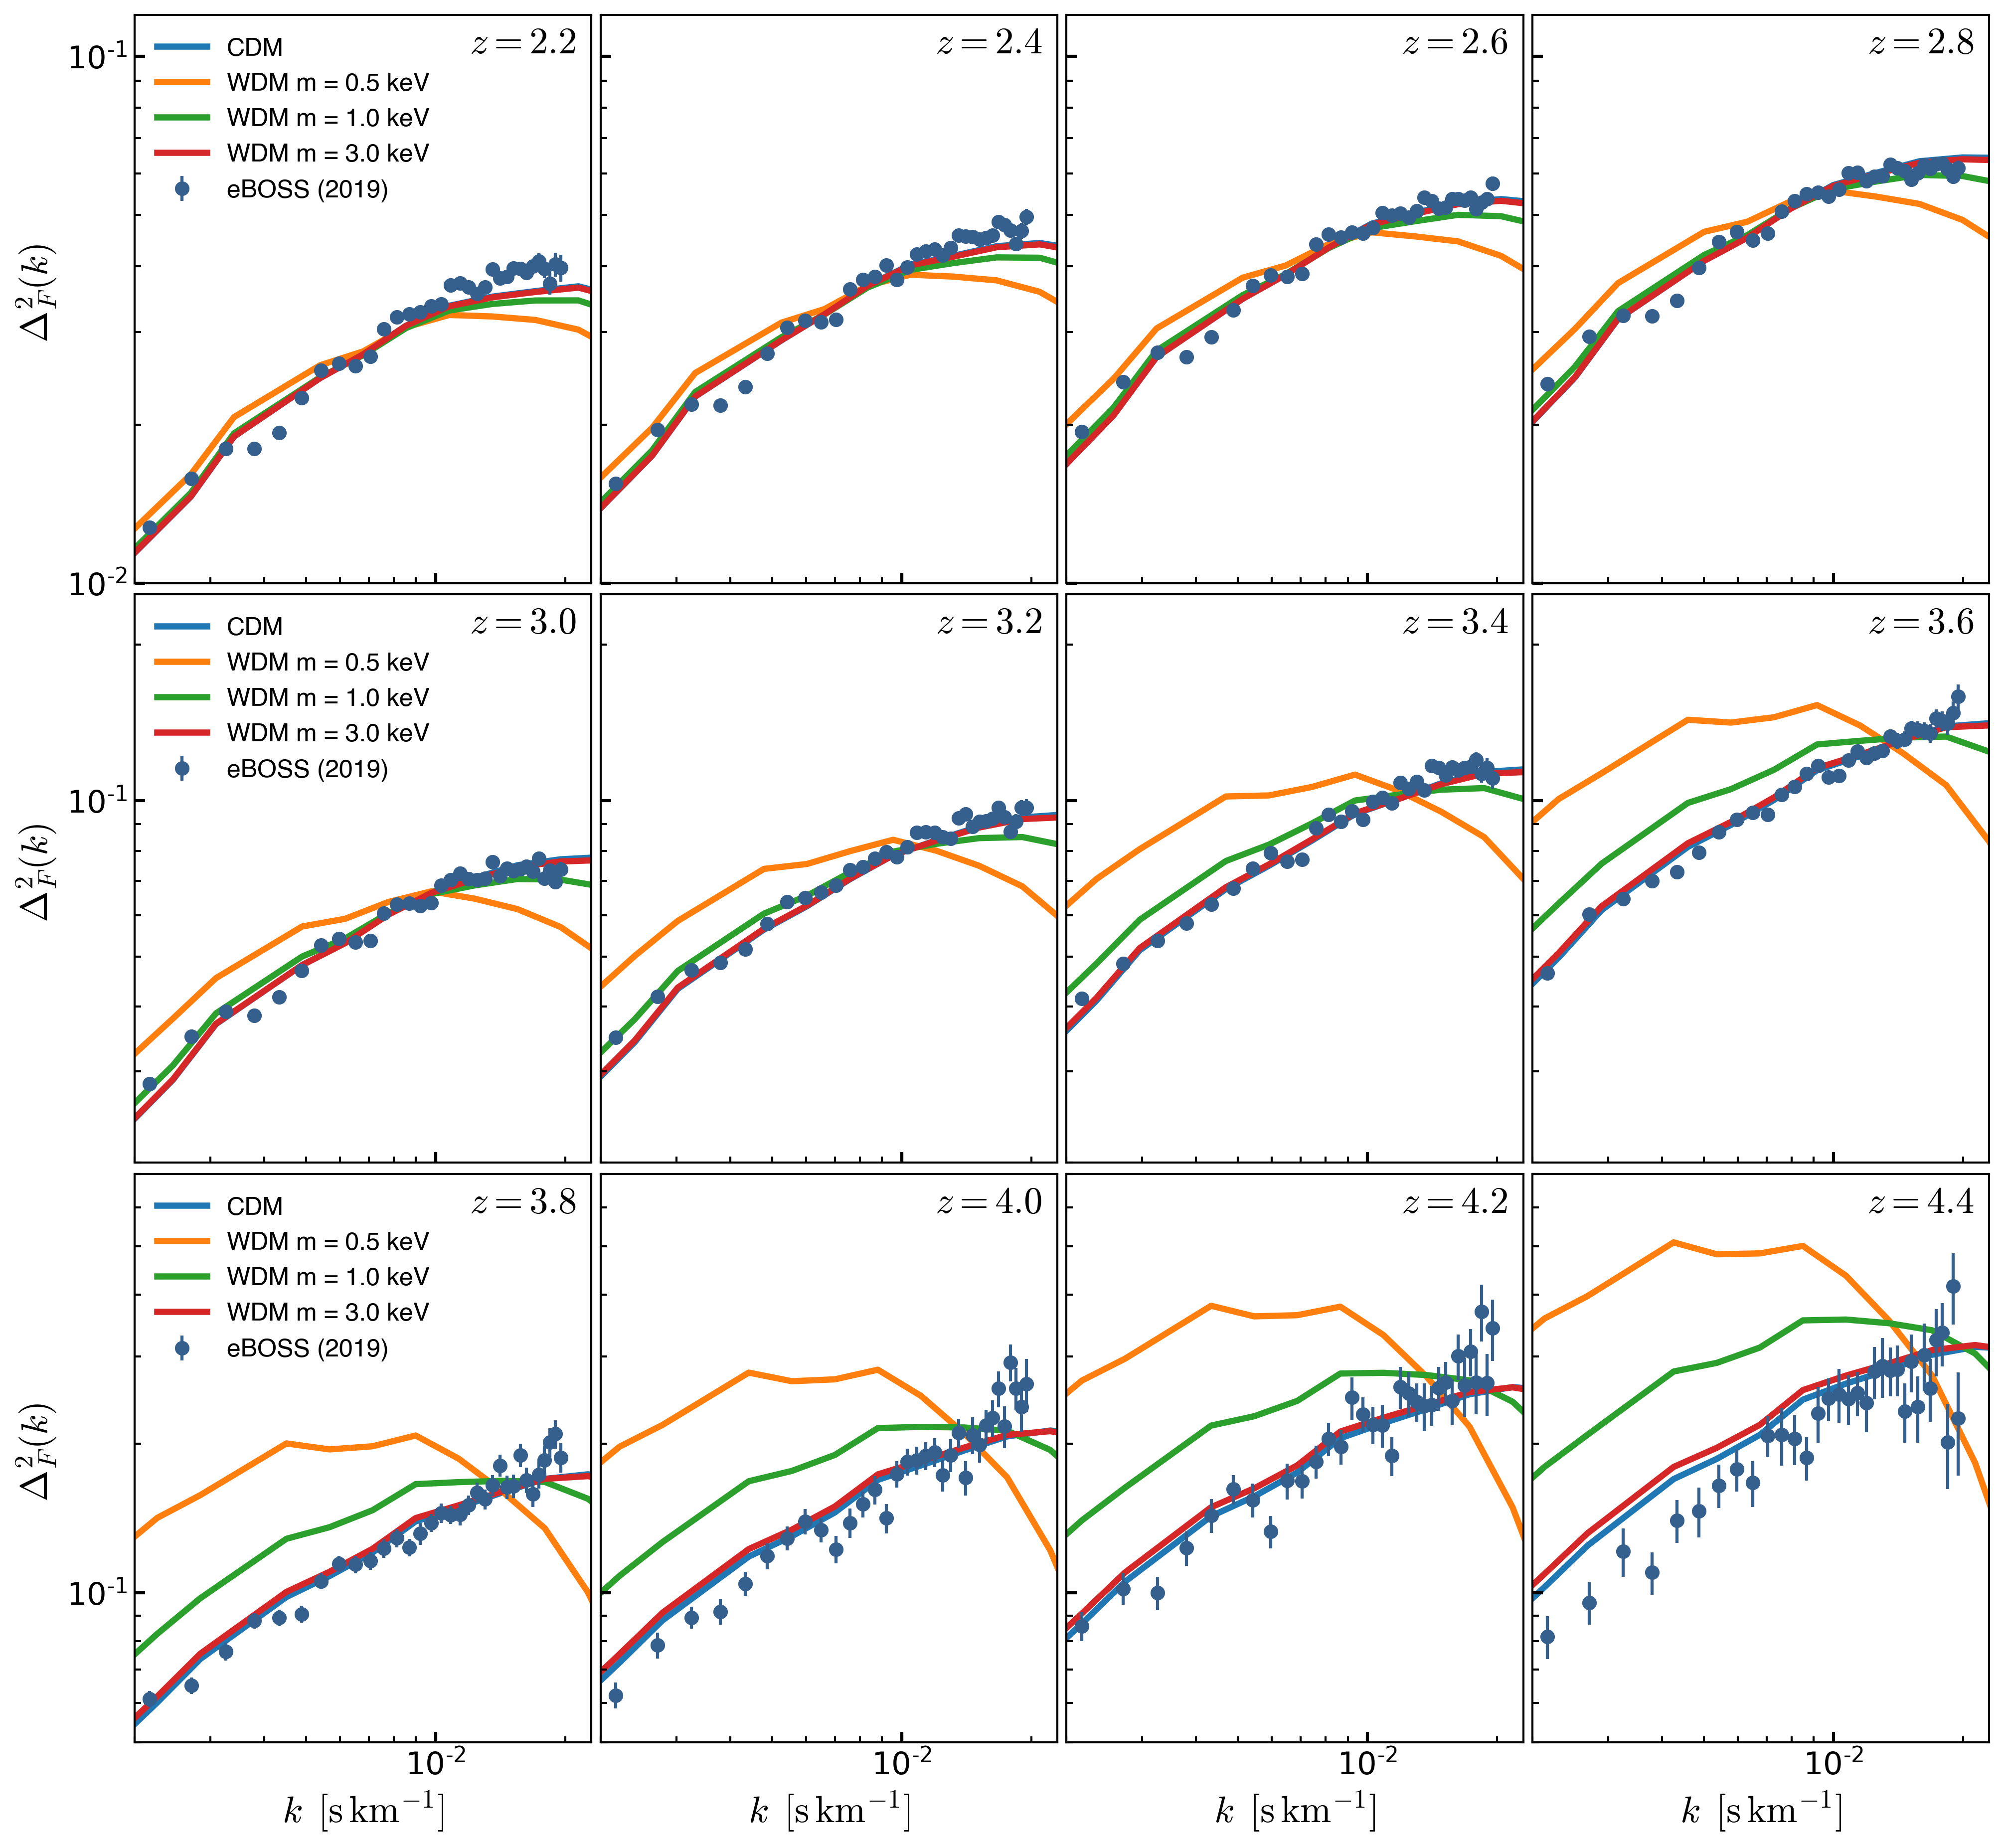
Flux Power Spectrum Difference Relative to CDM
For the WDM mass = 3.0 keV only
For the 3 WDM masses

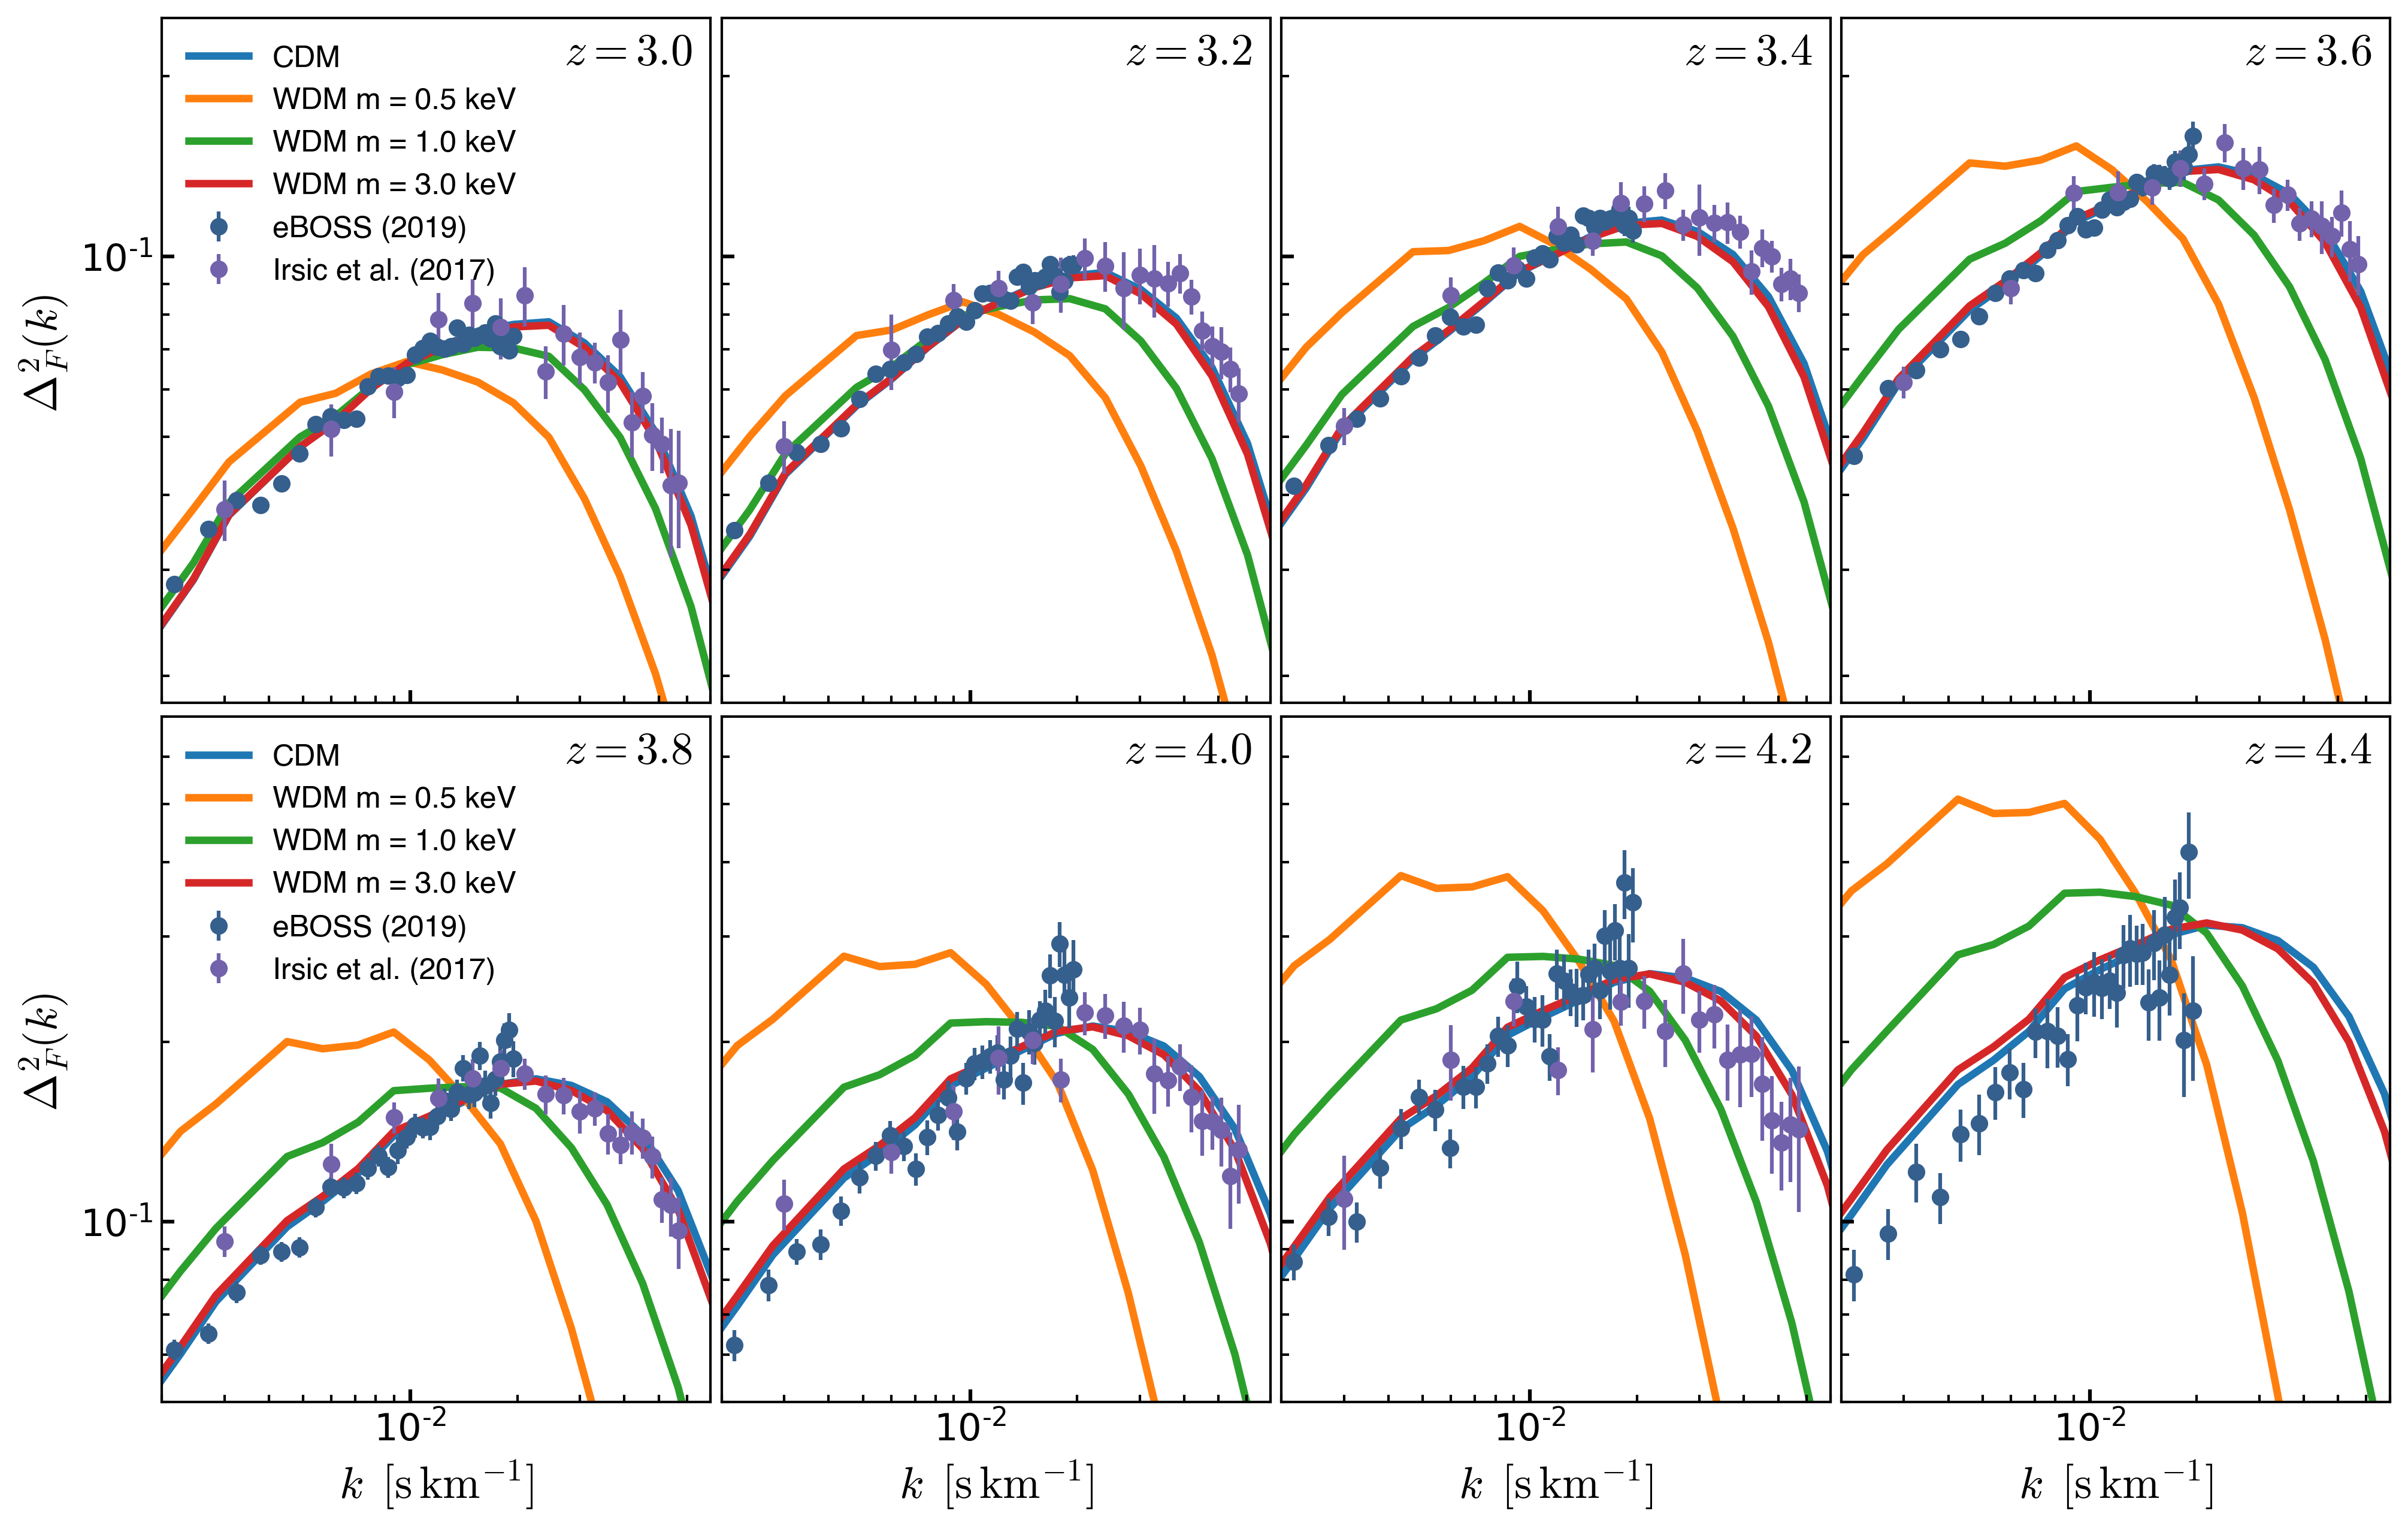
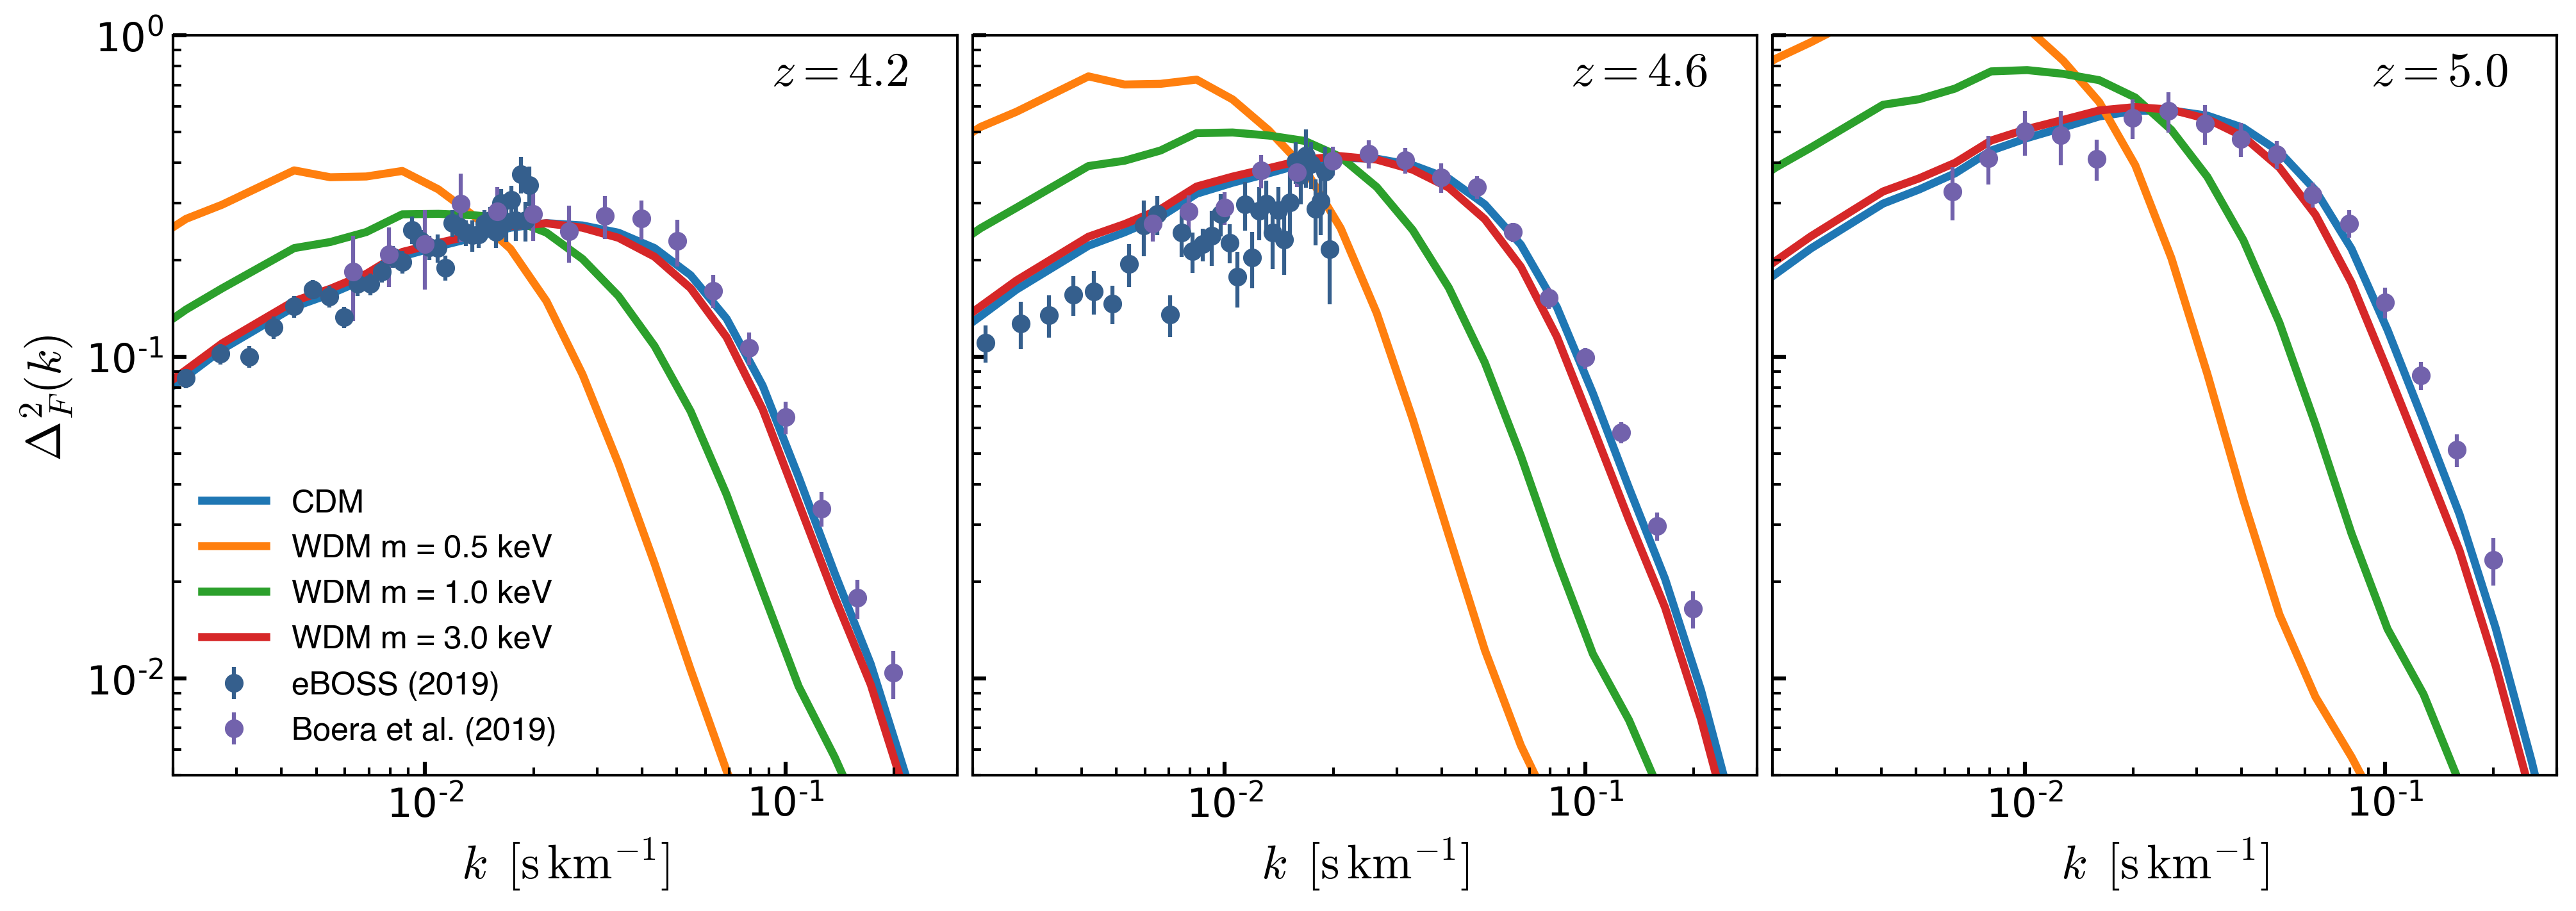
Flux Power Spectrum Compared to Data