Fitted UVB rates to BOSS
Below are the posterior distribution of the parameters for the fit:
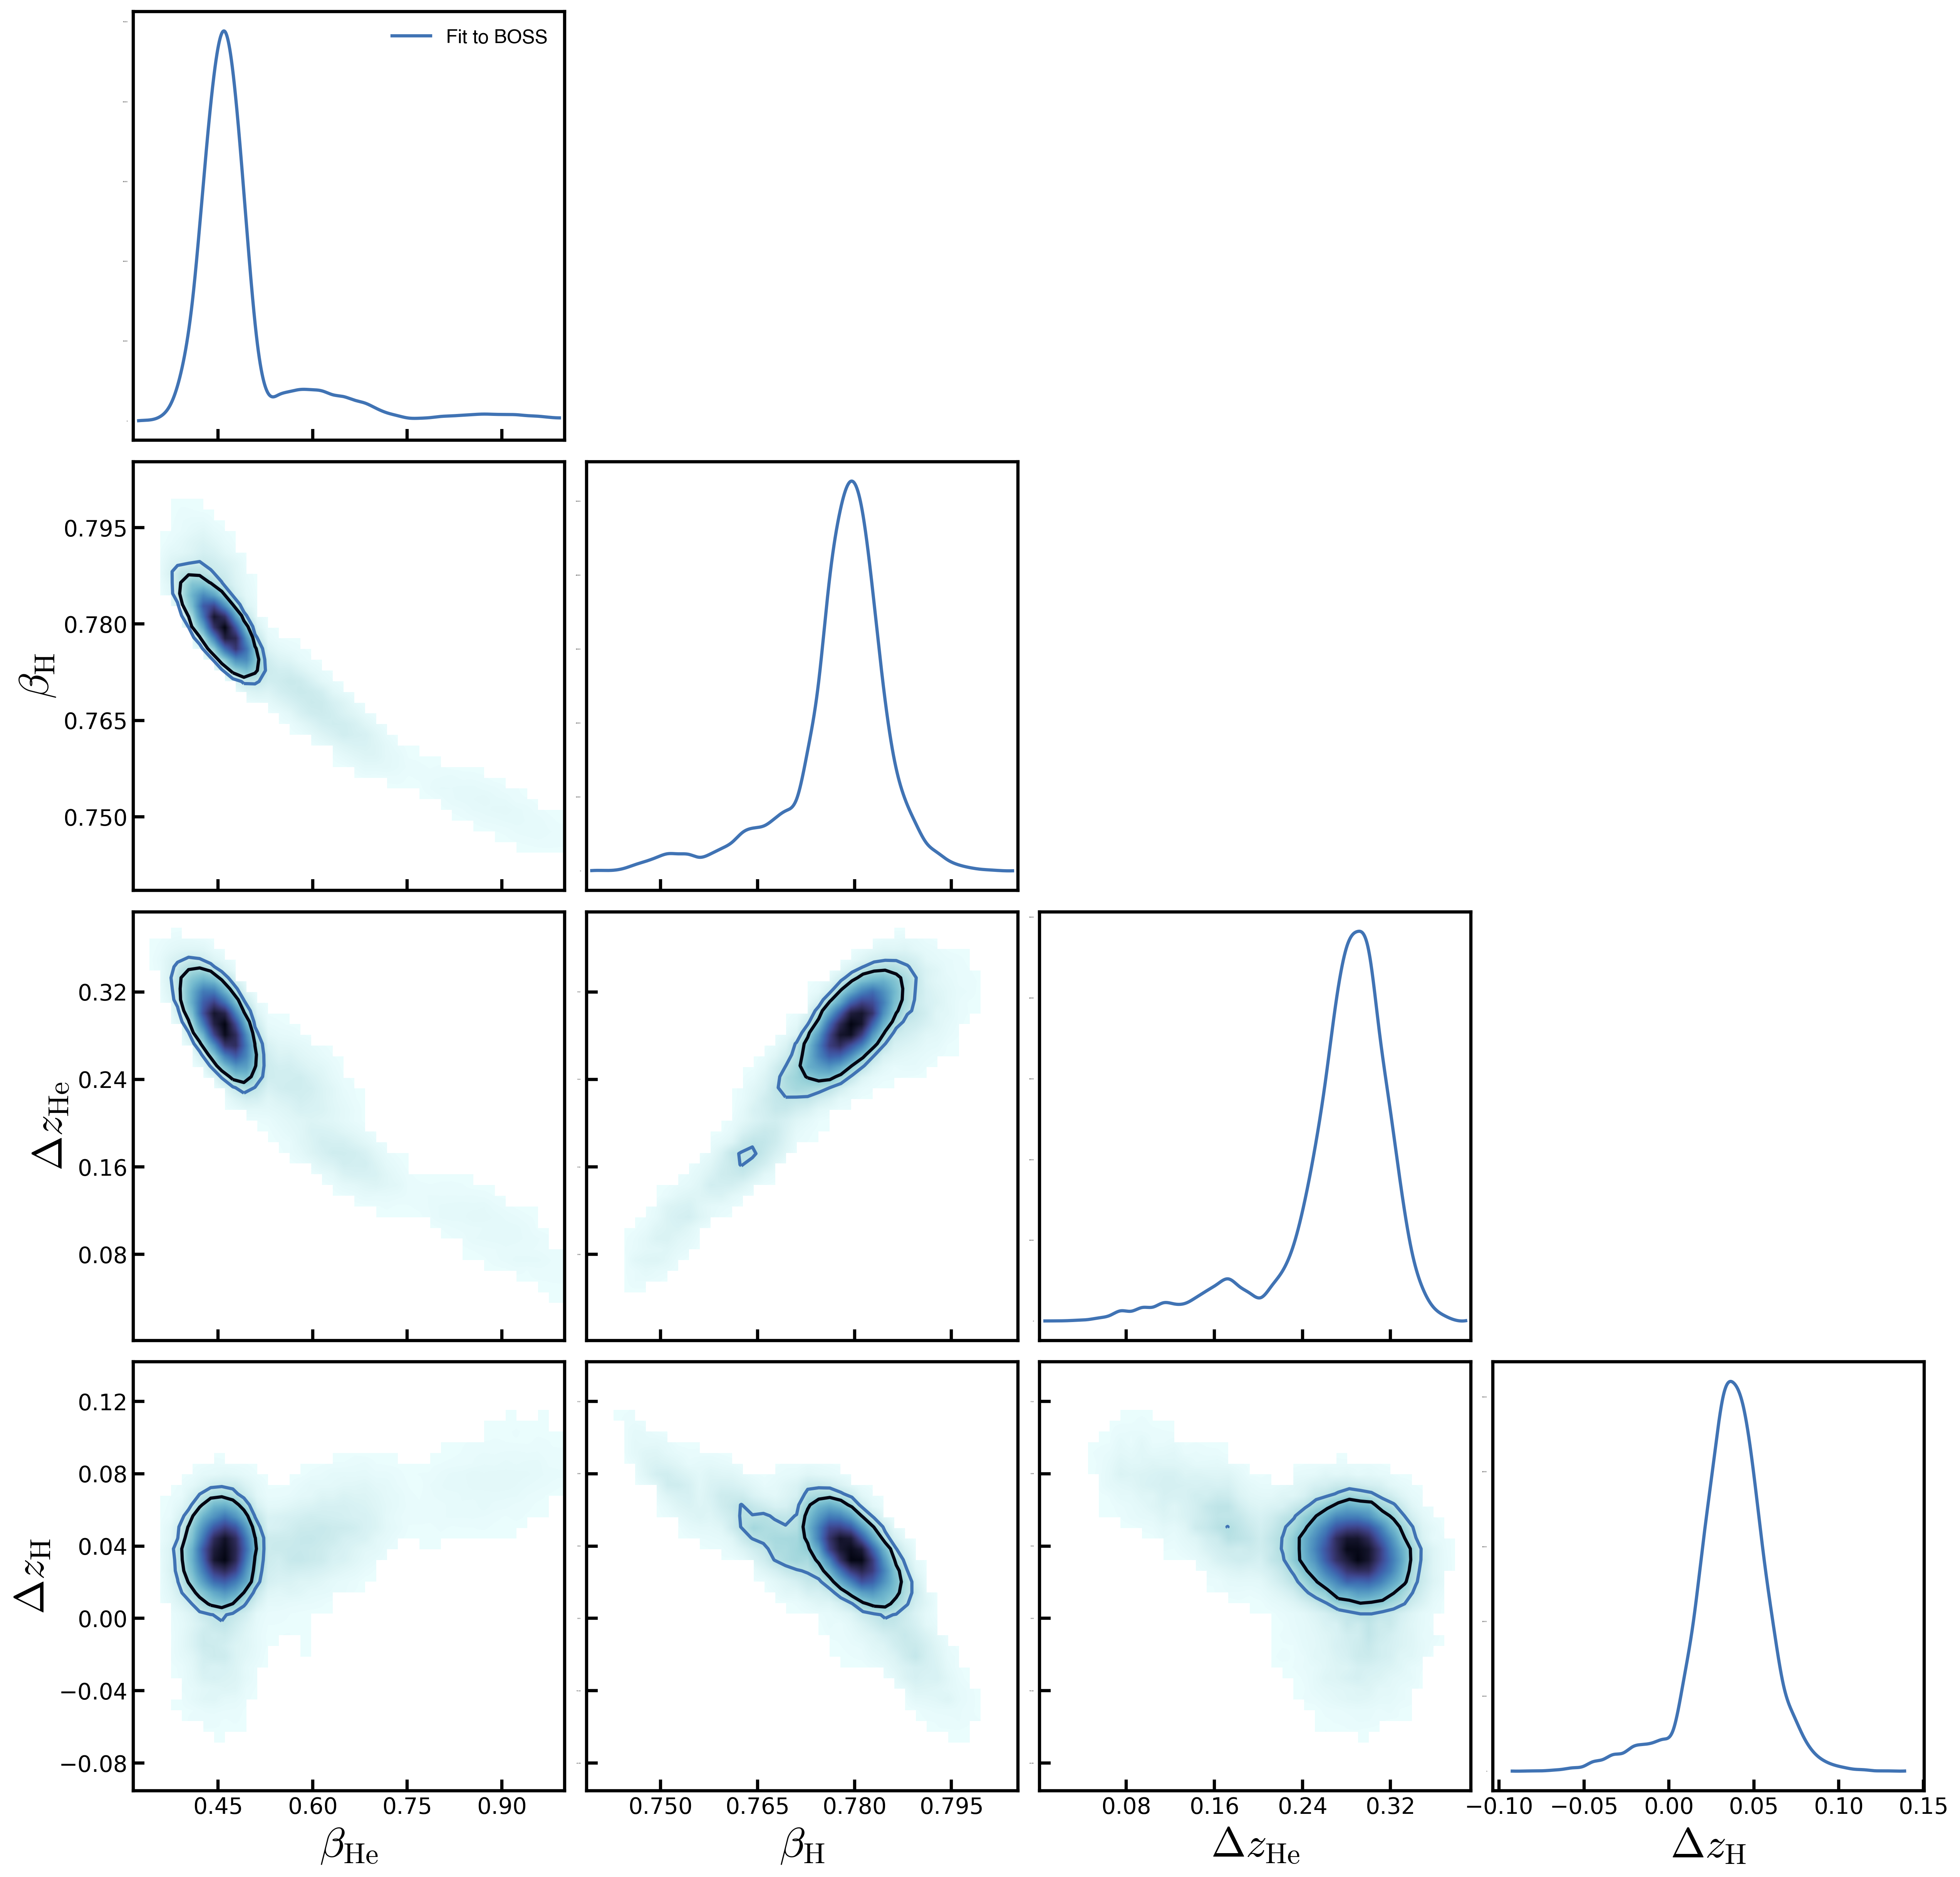
From my fit to the BOSS P(k) and tau_HeII the values for the best fit parameters are (brackets show the 95% HPD interval):
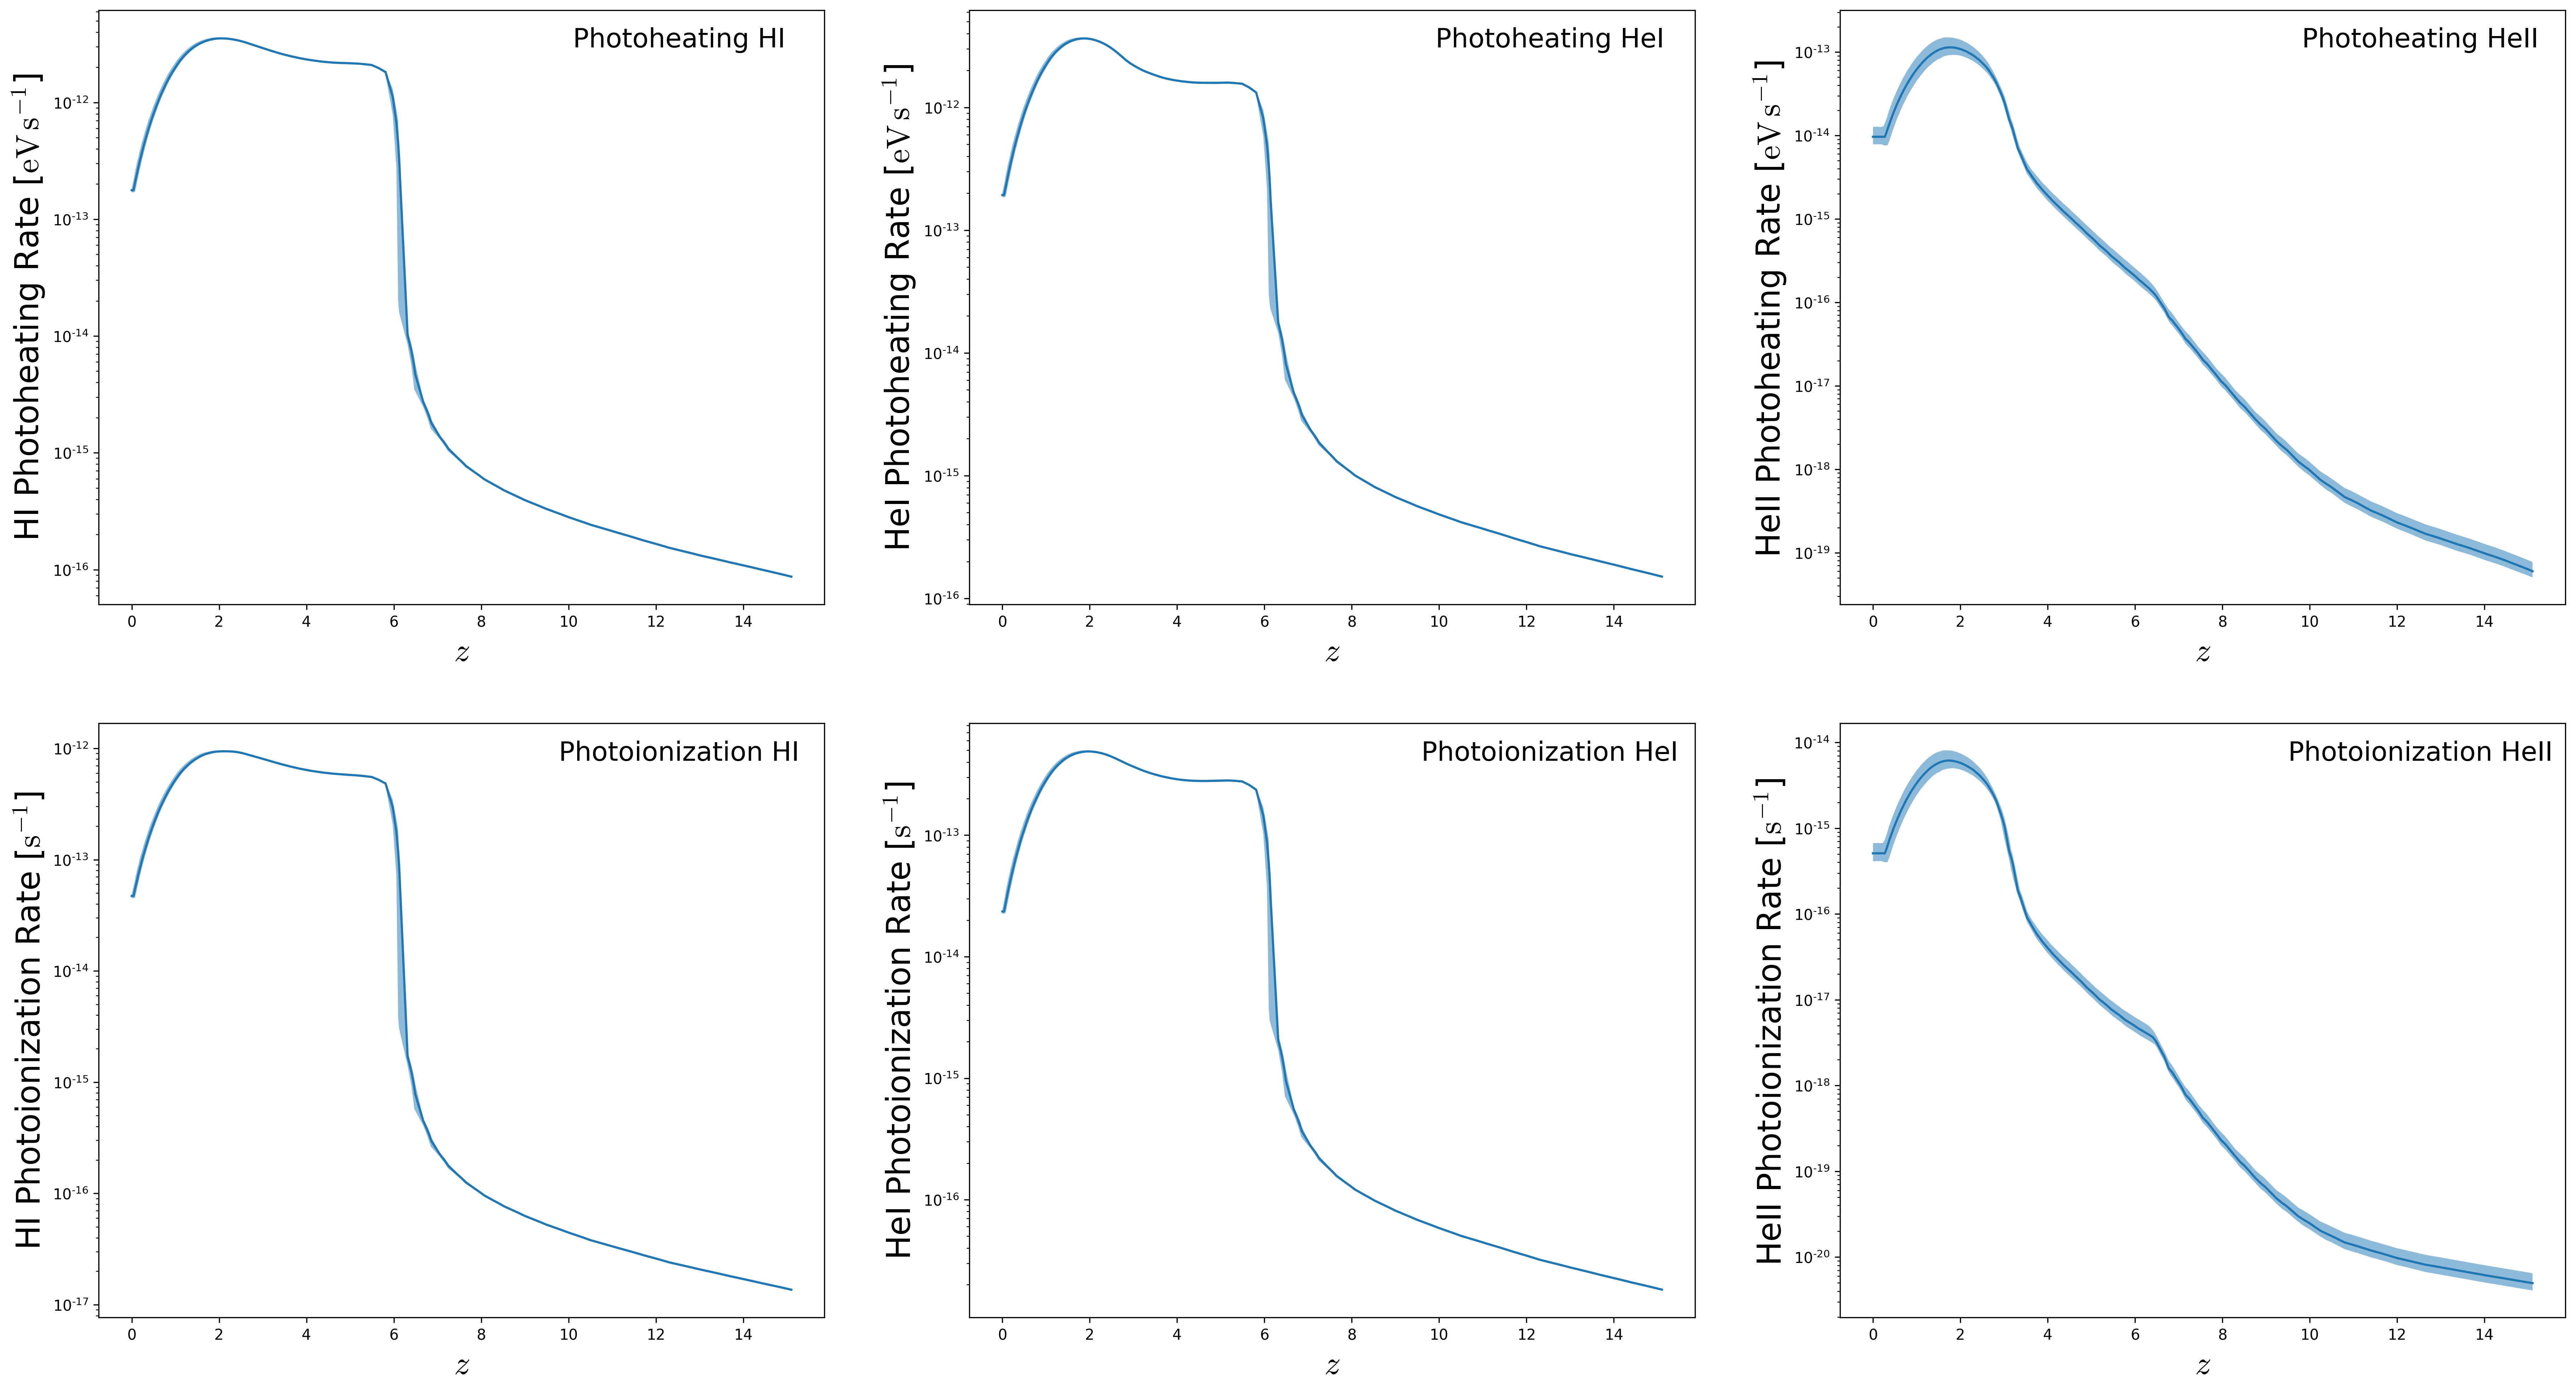
\[\beta_{\mathrm{He}} = 0.46 \,\,\, [ \, 0.37 \,\, 0.69 \, ]\] \[\beta_{\mathrm{H}} = 0.78 \,\,\, [ \, 0.76 \,\, 0.79 \, ]\] \[\Delta z_{\mathrm{He}} = 0.28 \,\,\, [ \, 0.15 \,\, 0.35 \,]\] \[\Delta z_{\mathrm{H}} = 0.04 \,\,\, [ \, -0.01 \,\, 0.08 \, ]\]Links to the text files containing the marginalized Photoheating and Photoionization rates are below:
In each file the columns correspond to:
- 0: Redshift
- 1: HI Photoheating Rate
- 2: HeI Photoheating Rate
- 3: HeII Photoheating Rate
- 4: HI Photoionization Rate
- 5: HeI Photoionization Rate
- 6: HeII Photoionization Rate
File with UVB rates evaluated at the Highest Likelihood values of the parameters
File with UVB rates evaluated at the lower end of the 95% HPD Interval
File with UVB rates evaluated at the higher end of the 95% HPD Interval
The marginalized Photoheating and Photoheating rates for H and He are plotted below:
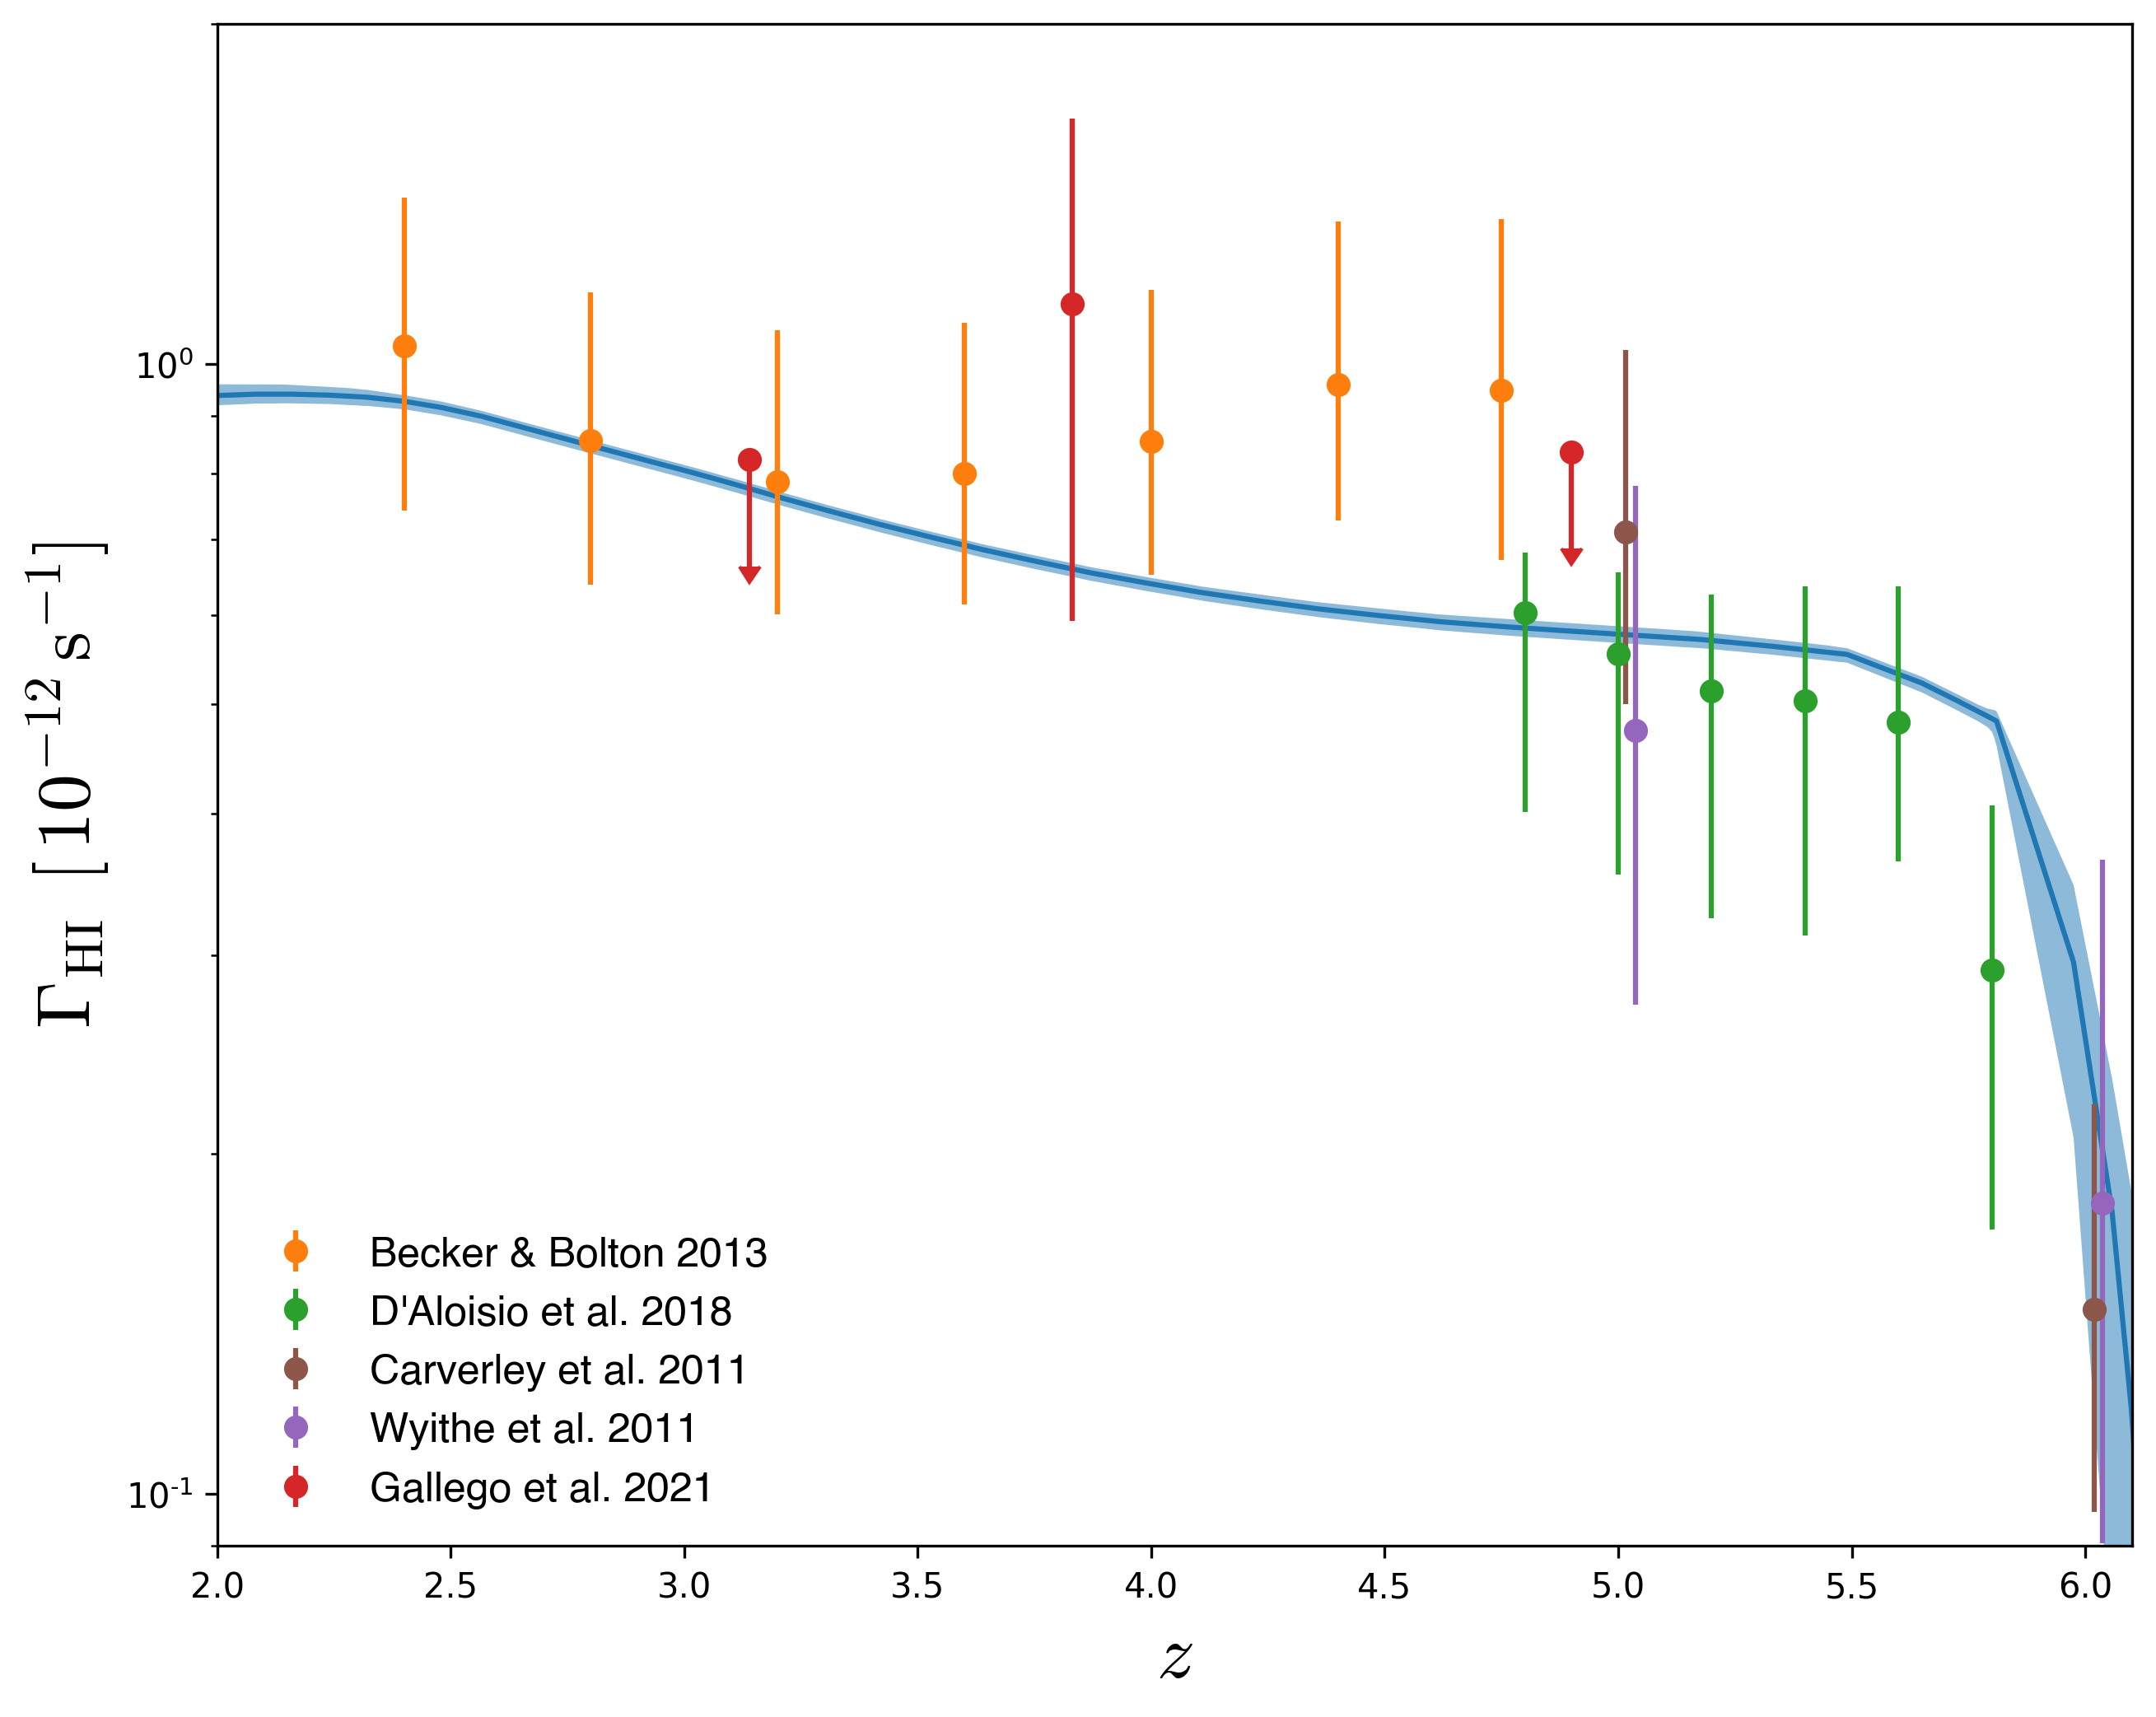
Comparing the HI Photoionization Rate to the data presented in Gallego et al. 2021: