P(k) MCMC Fit to Boss and Walther Data
From a set of 256 \(1024^3\) simulations where the parameters are:
\[\beta_{\mathrm{He}} = [ 0.3, \, 0.53, \, 0.76, \, 1.0 ]\] \[\beta_{\mathrm{H}} = [ 0.6, \, 0.73, \, 0.86, \, 1.0 ]\] \[\Delta z_{\mathrm{He}} = [-0.1, \, 0.2, \, 0.5, \, 0.8 ]\] \[\Delta z_{\mathrm{H}} = [ -0.6, \, -0.4, \, -0.2, \, 0.0 ]\]I fit to the temperature data and the power spectrum from different data sets.
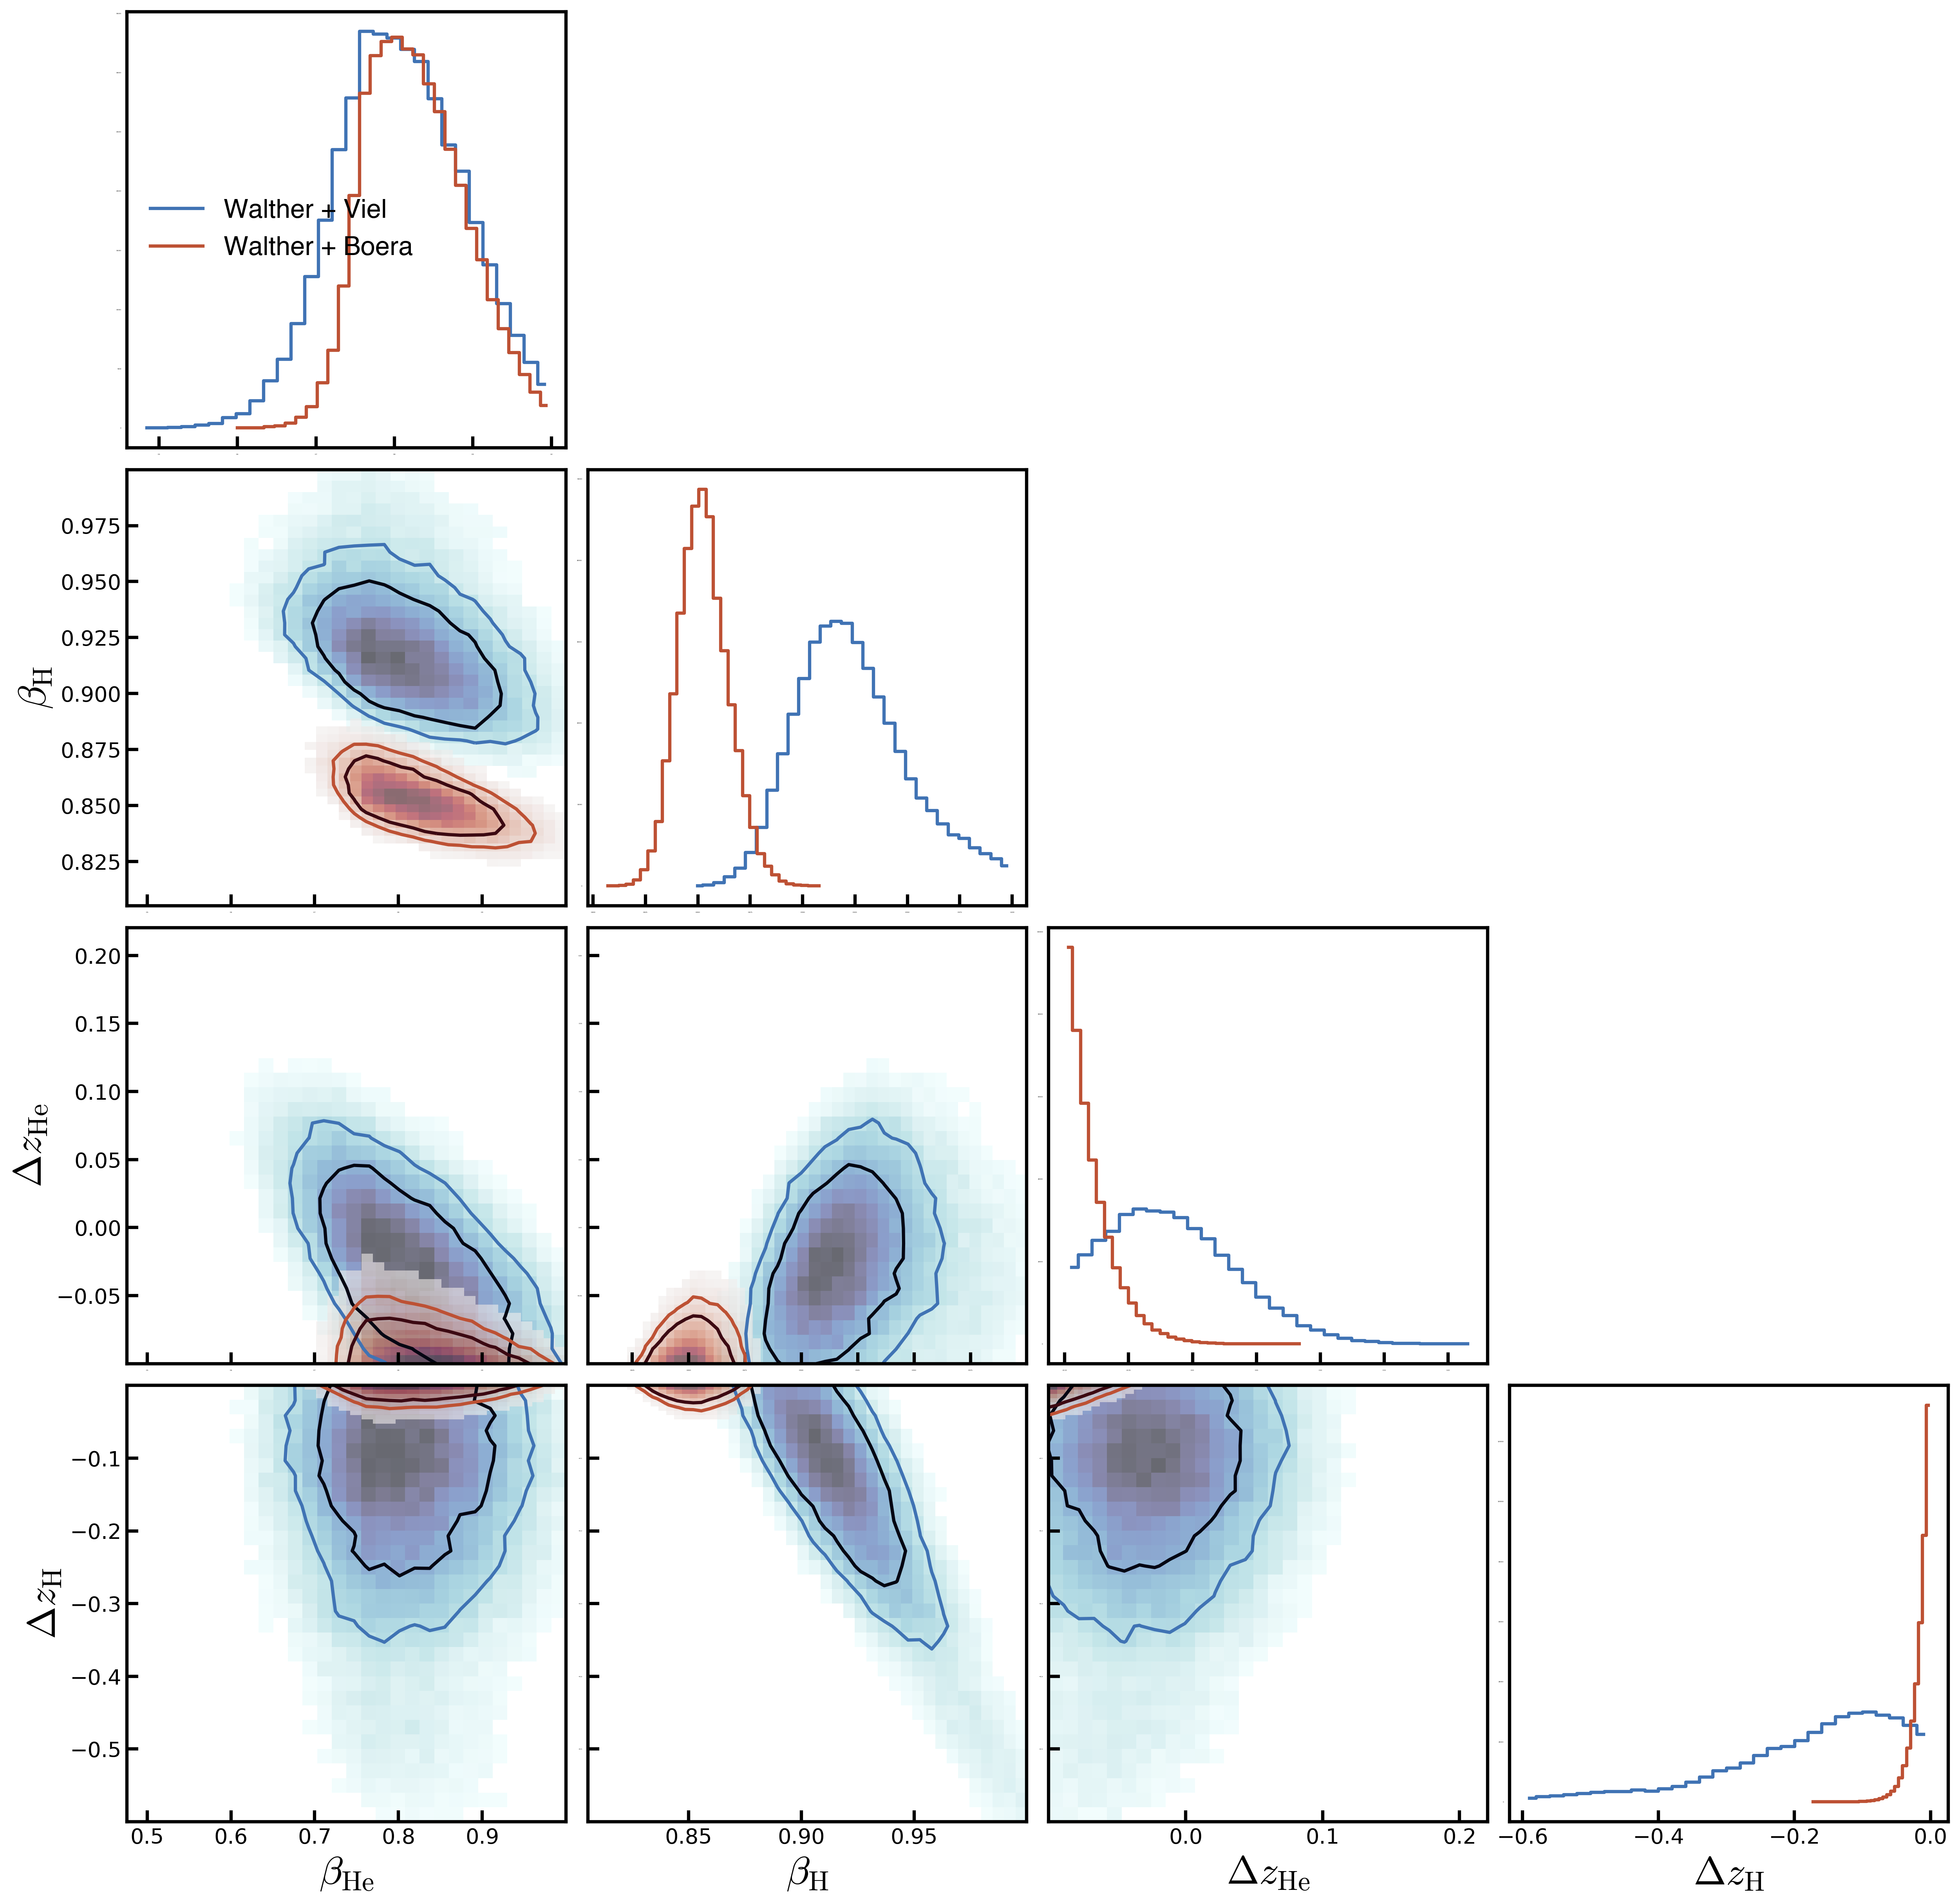
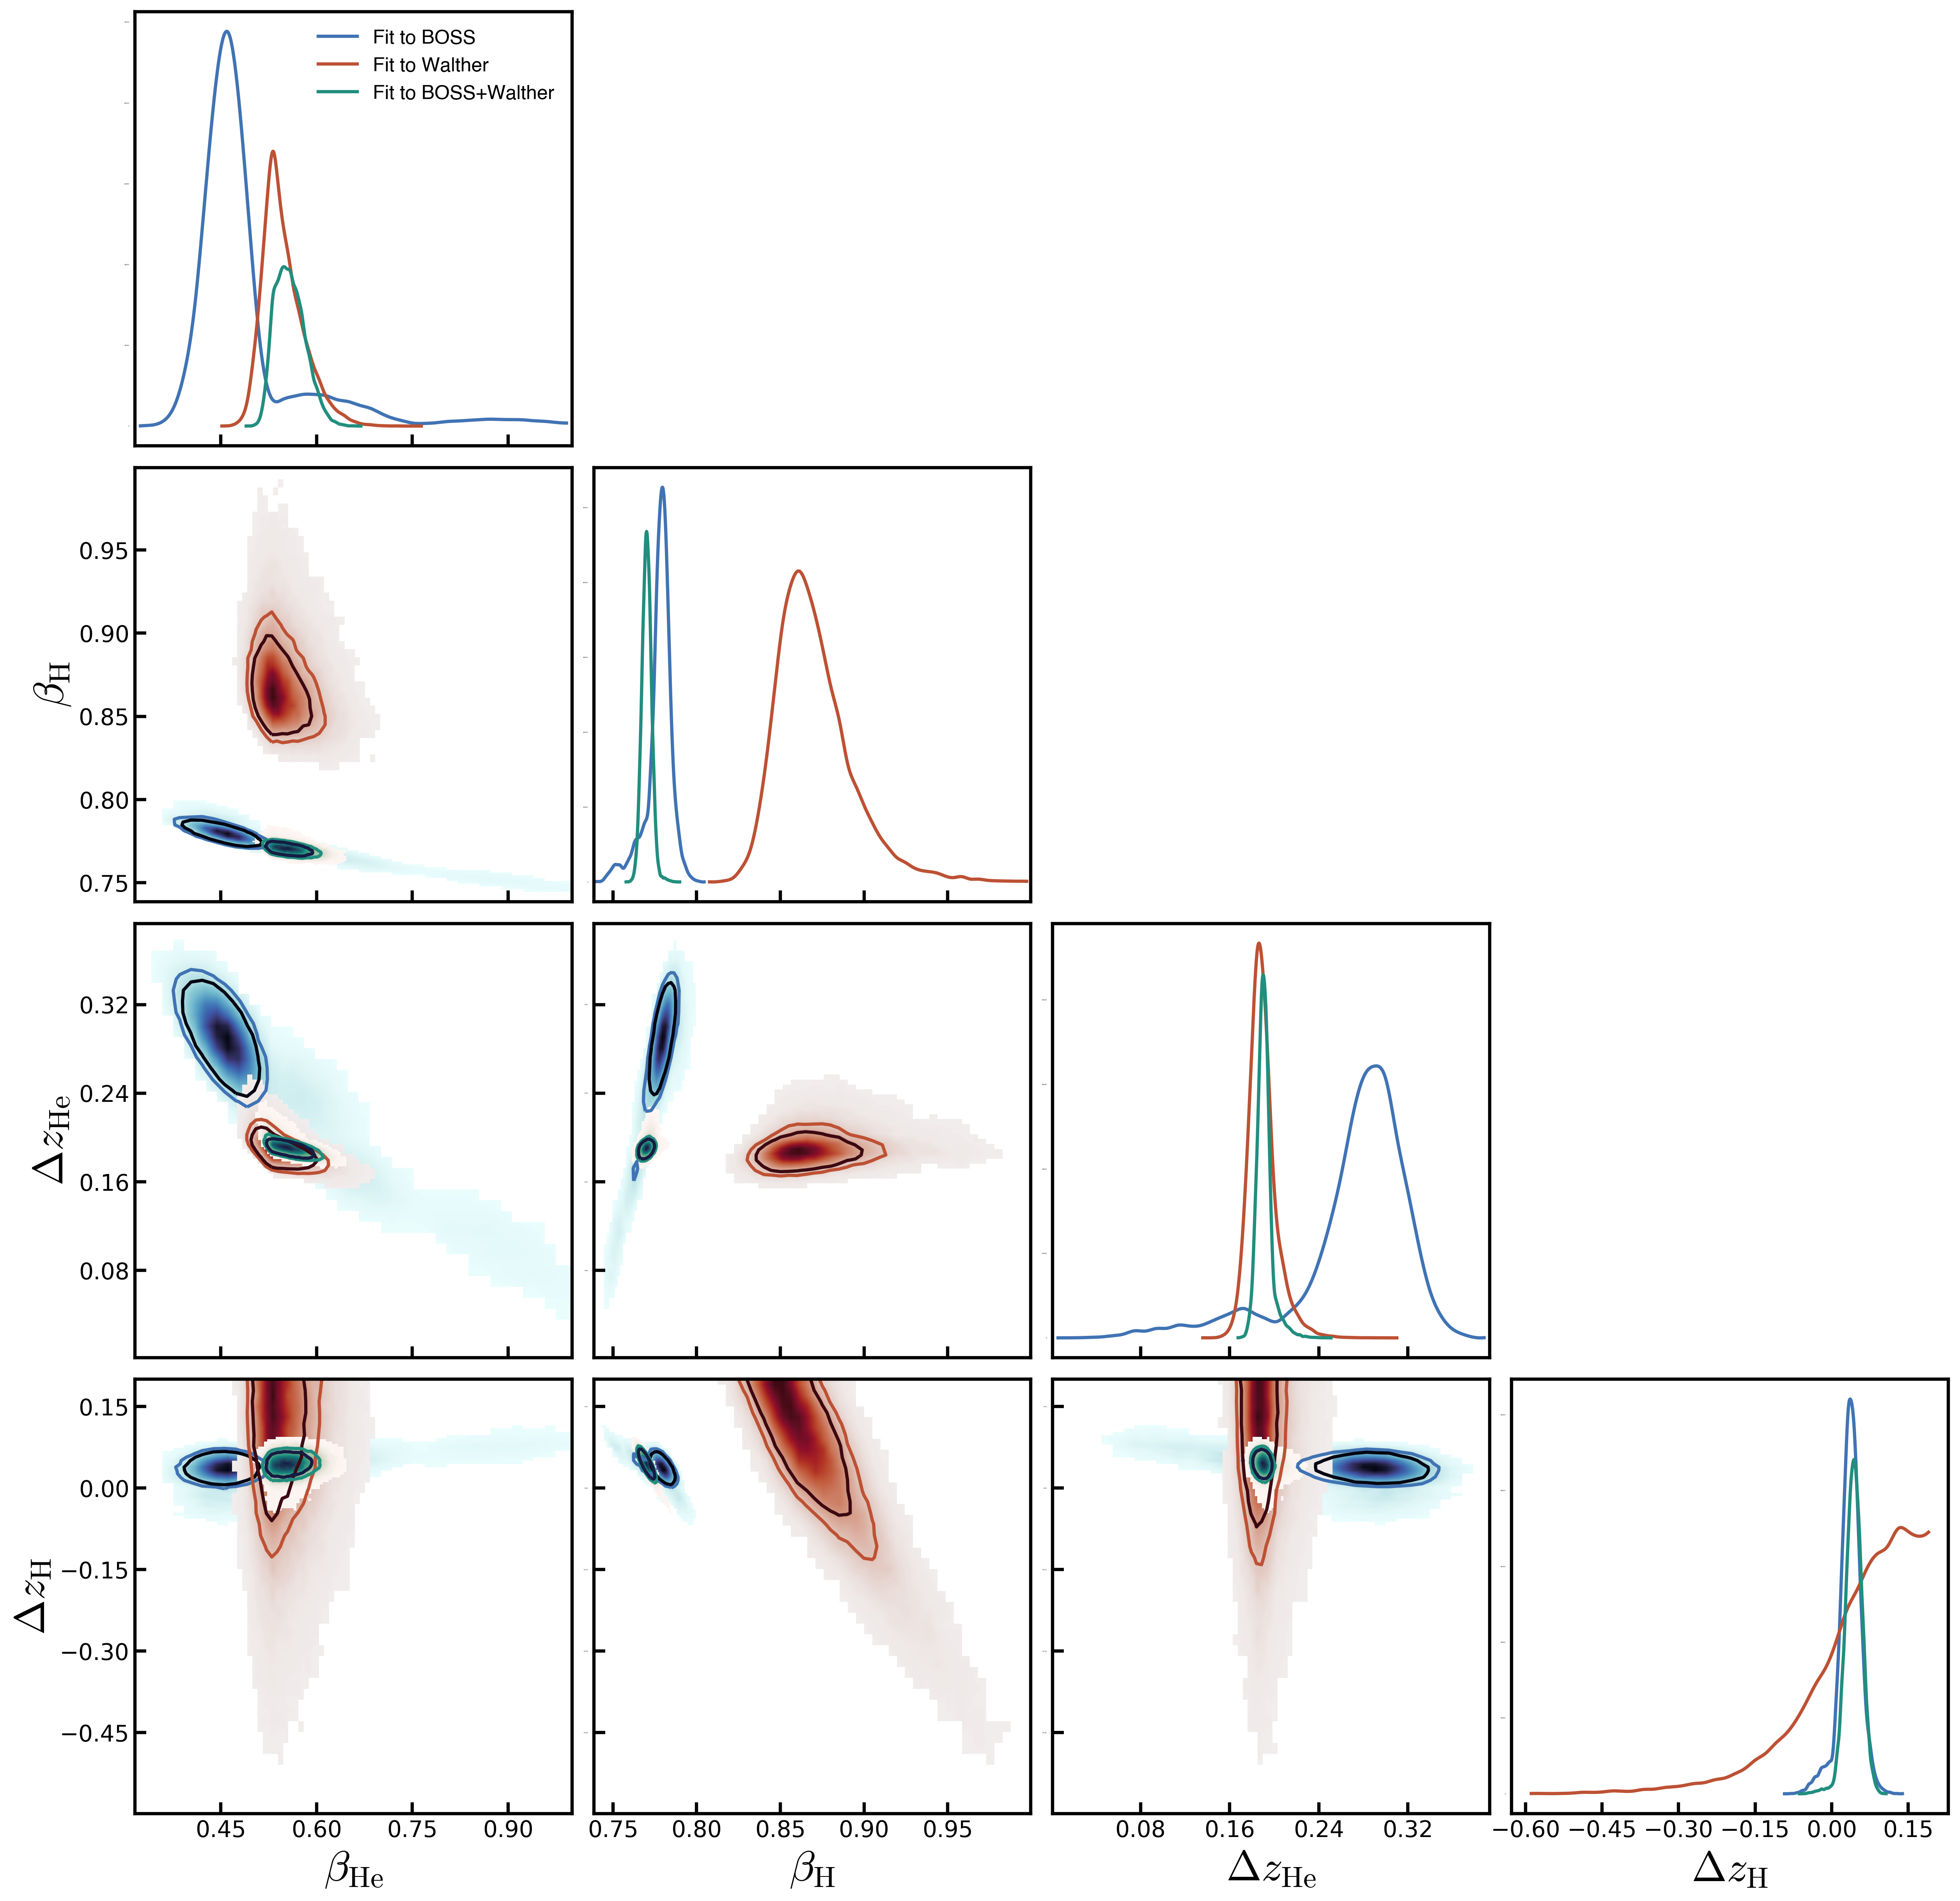
The distributions from fitting to the Boss and Walther data separately are:
When I fit to bot datasets simultaneously the results are very different:
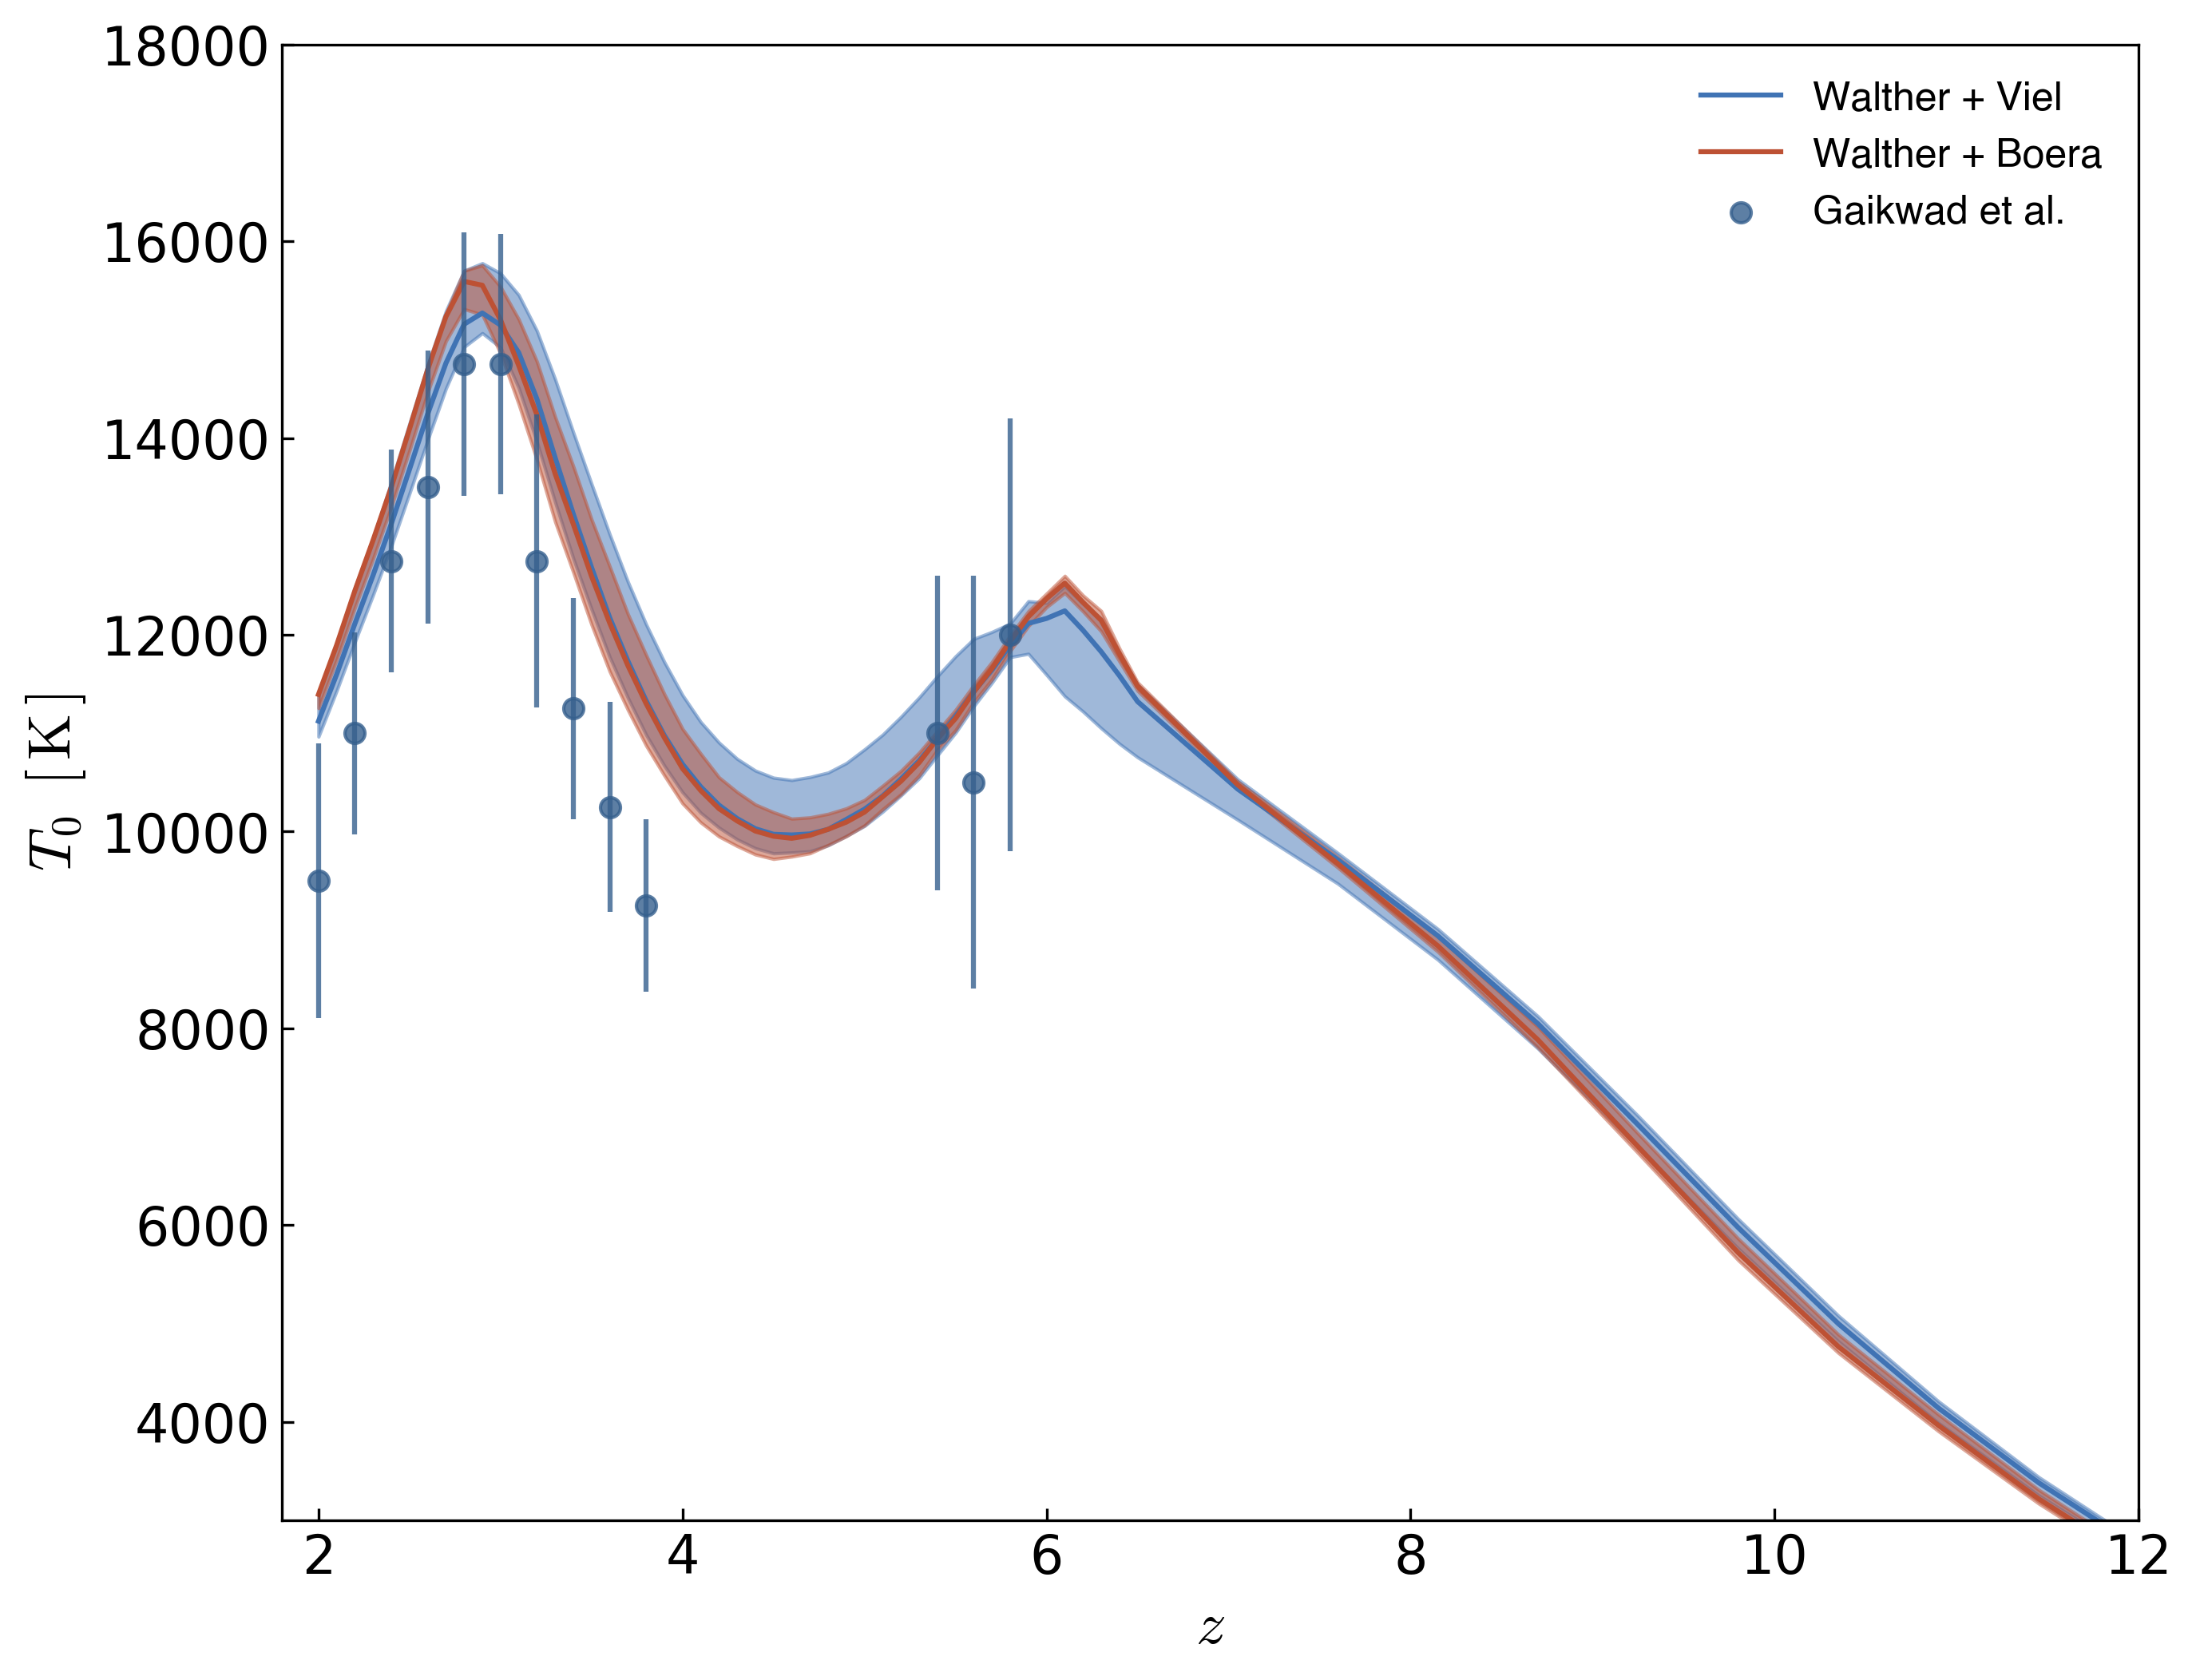
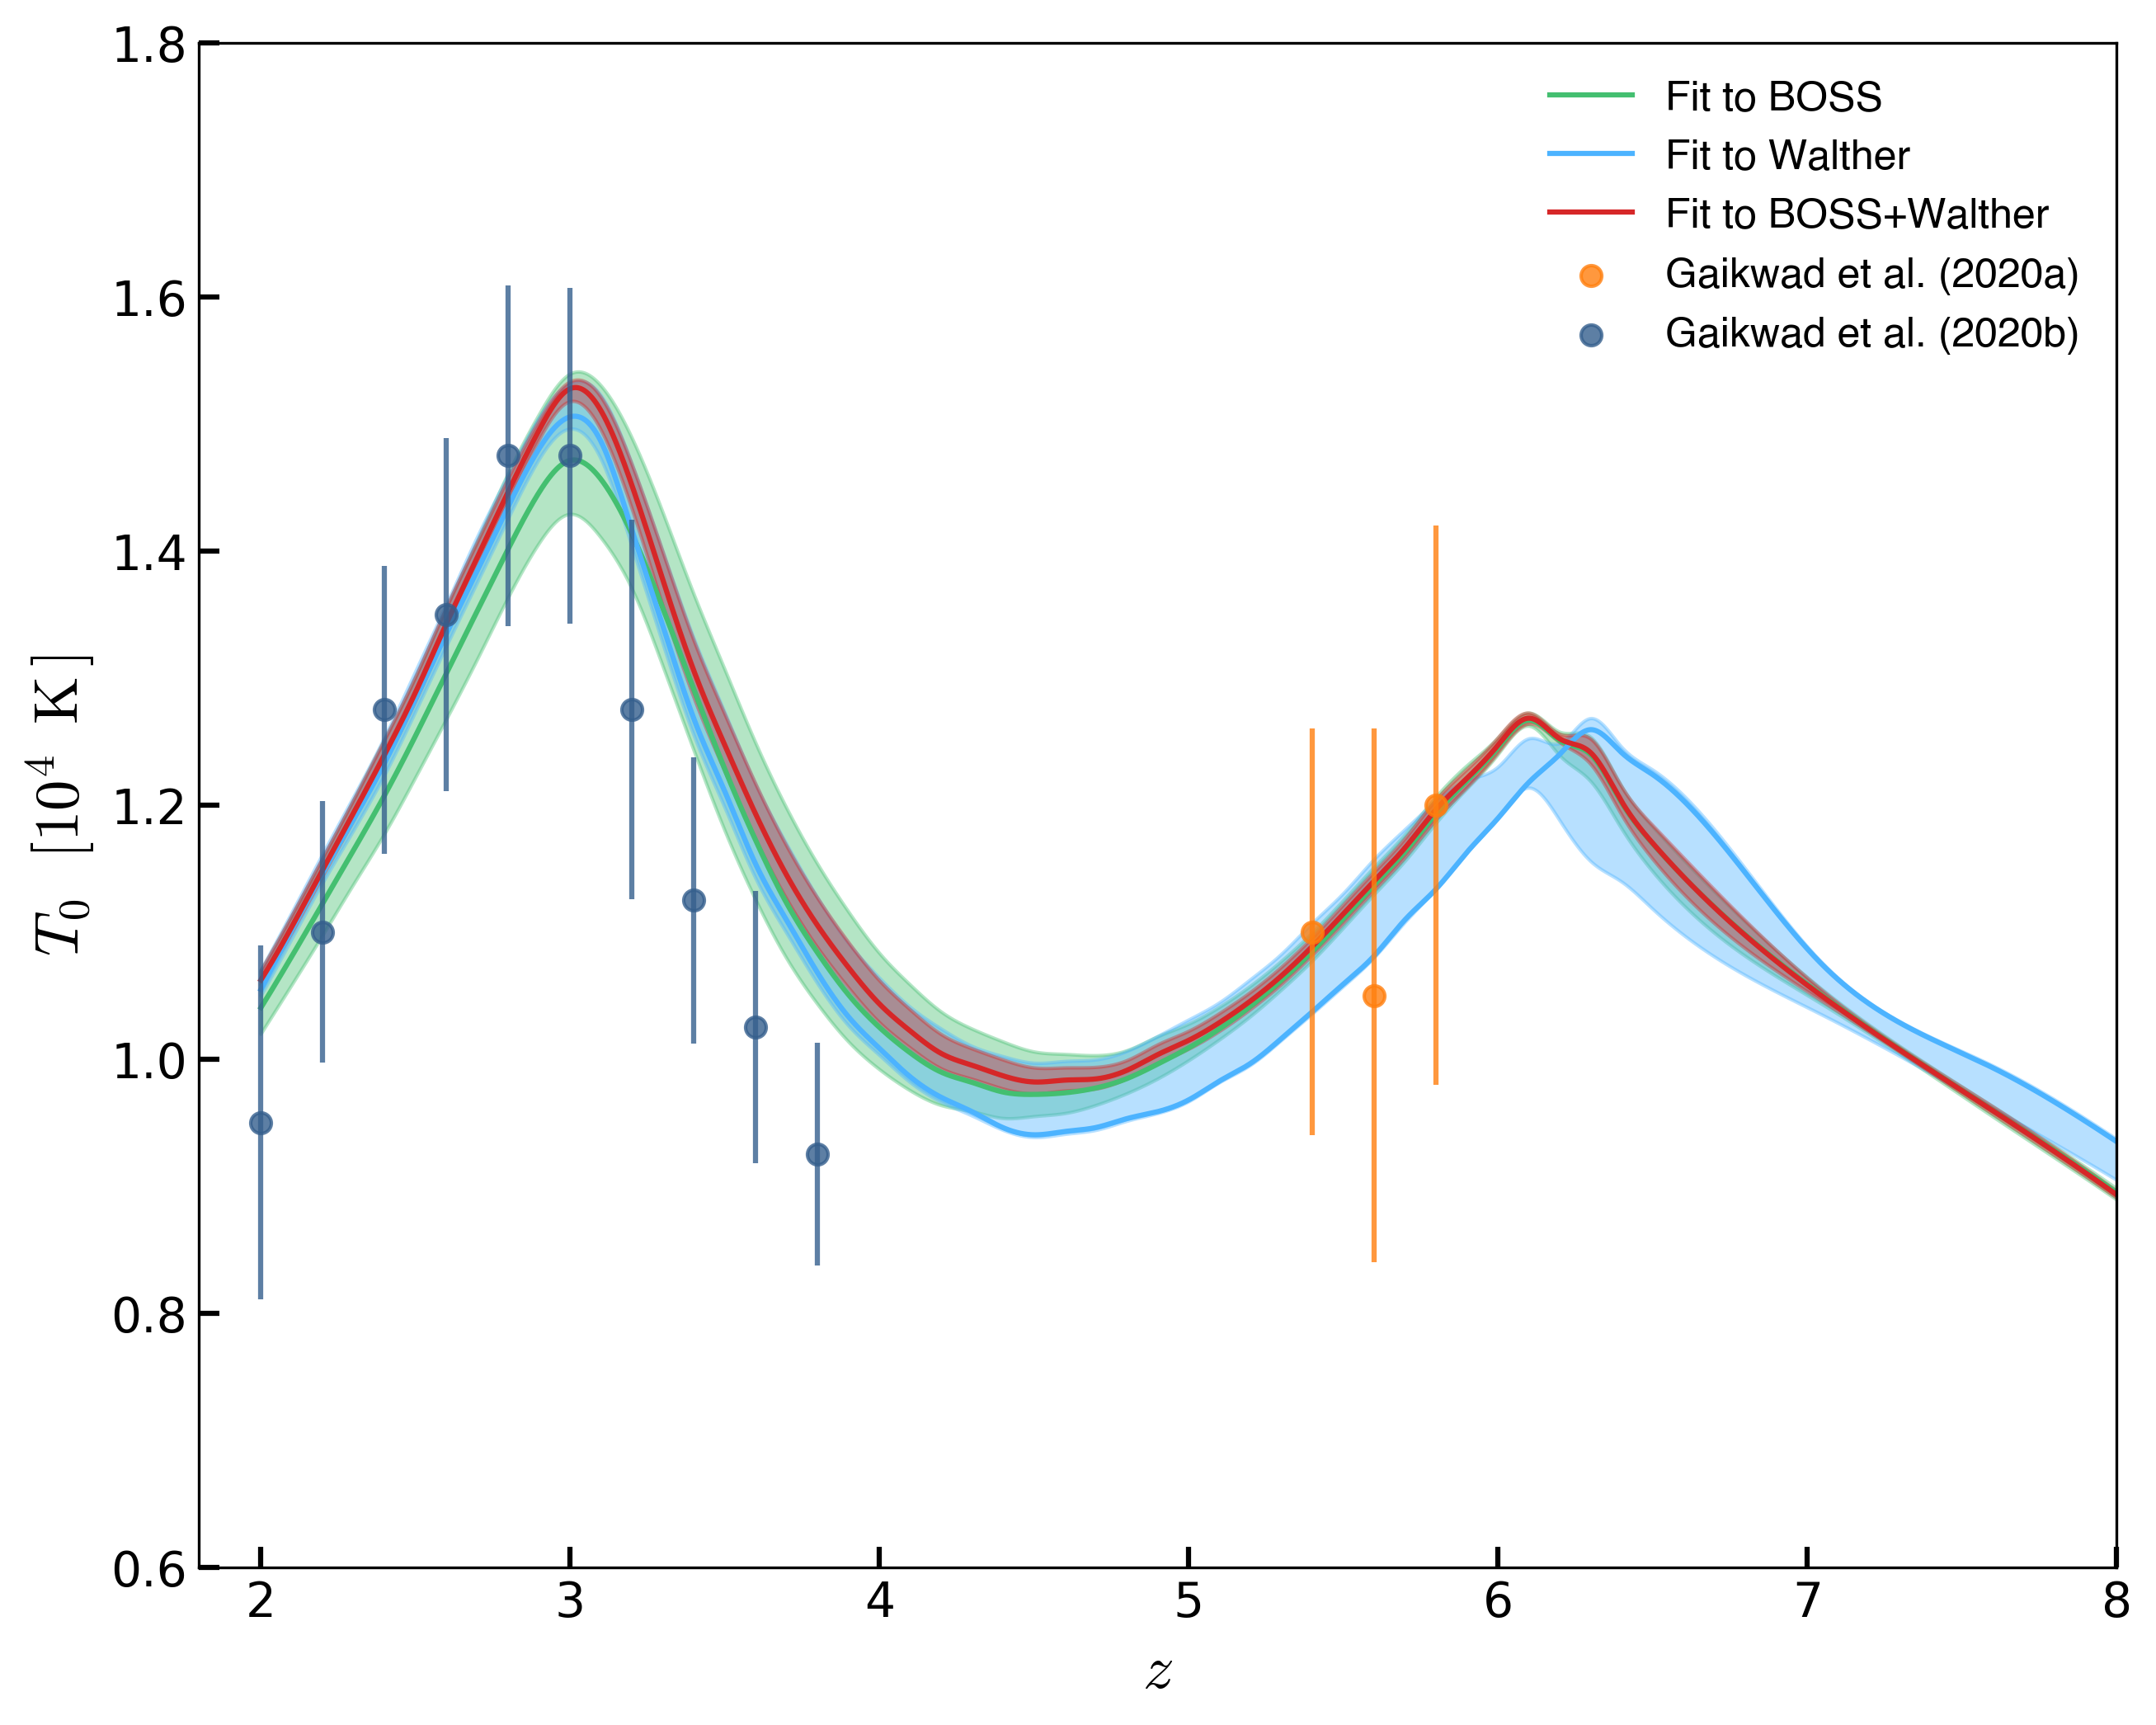
Below is the evolution of the temperature from the fitted posterior distribution of the parameters:
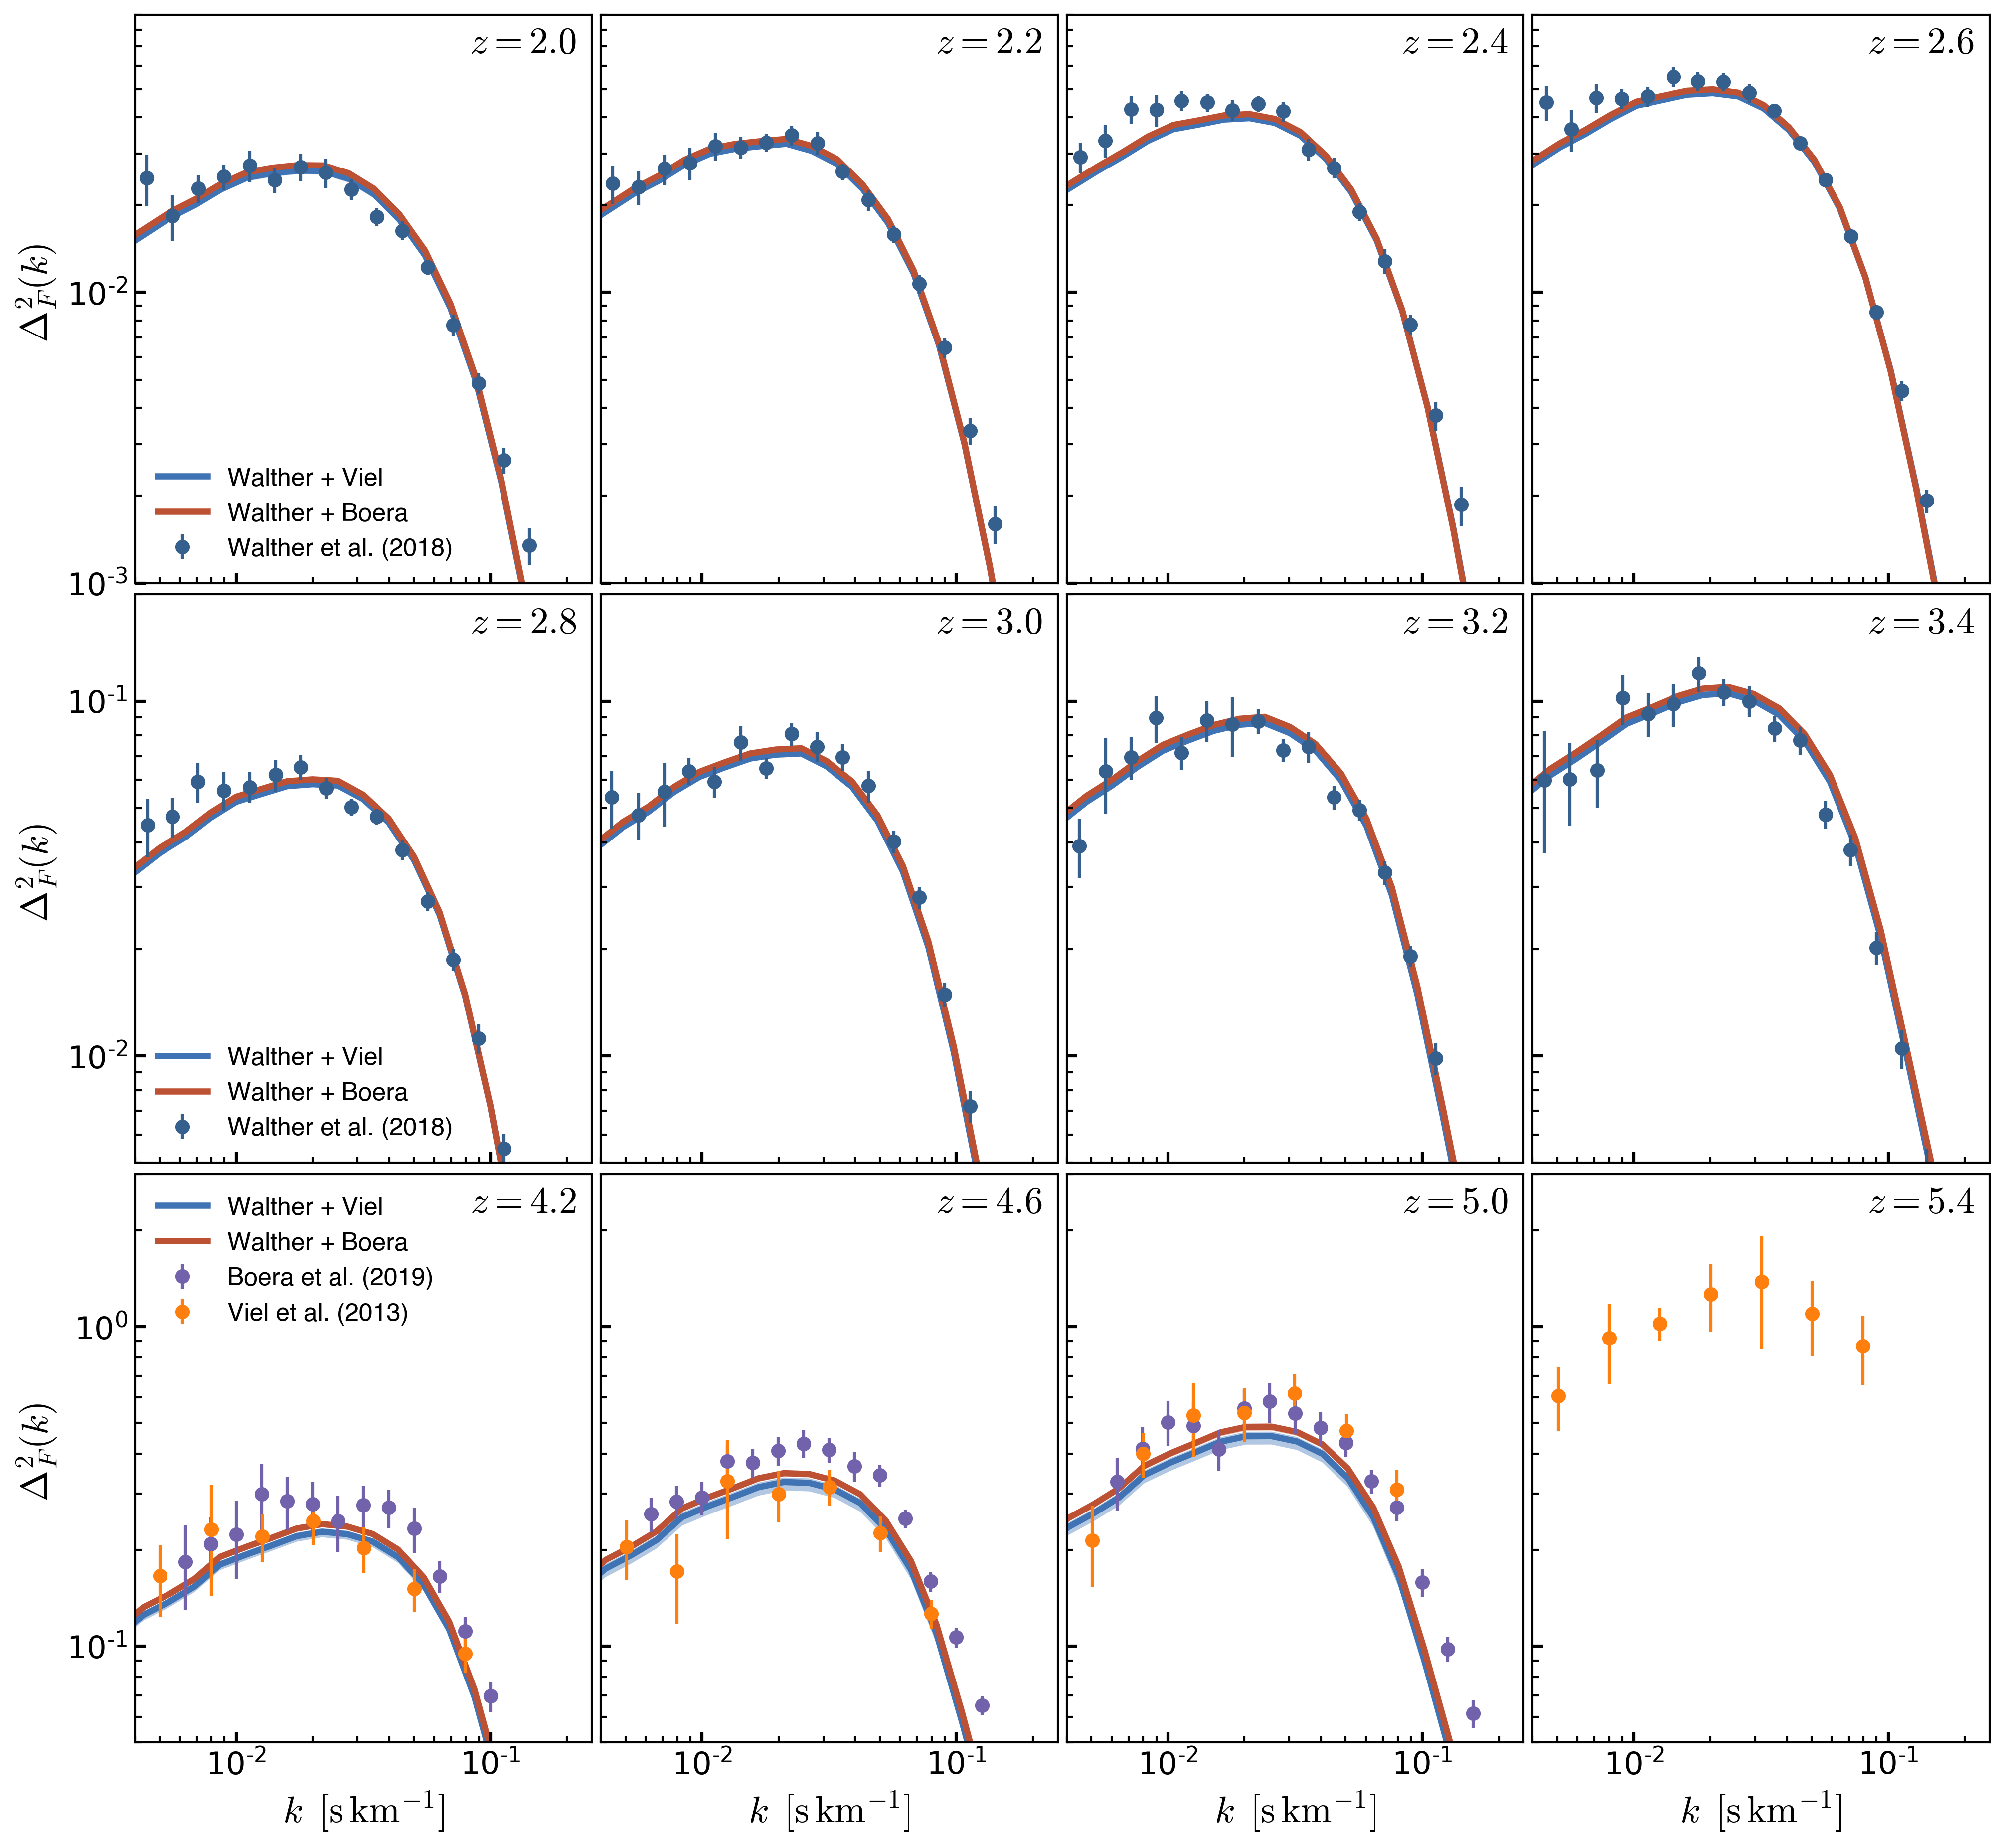
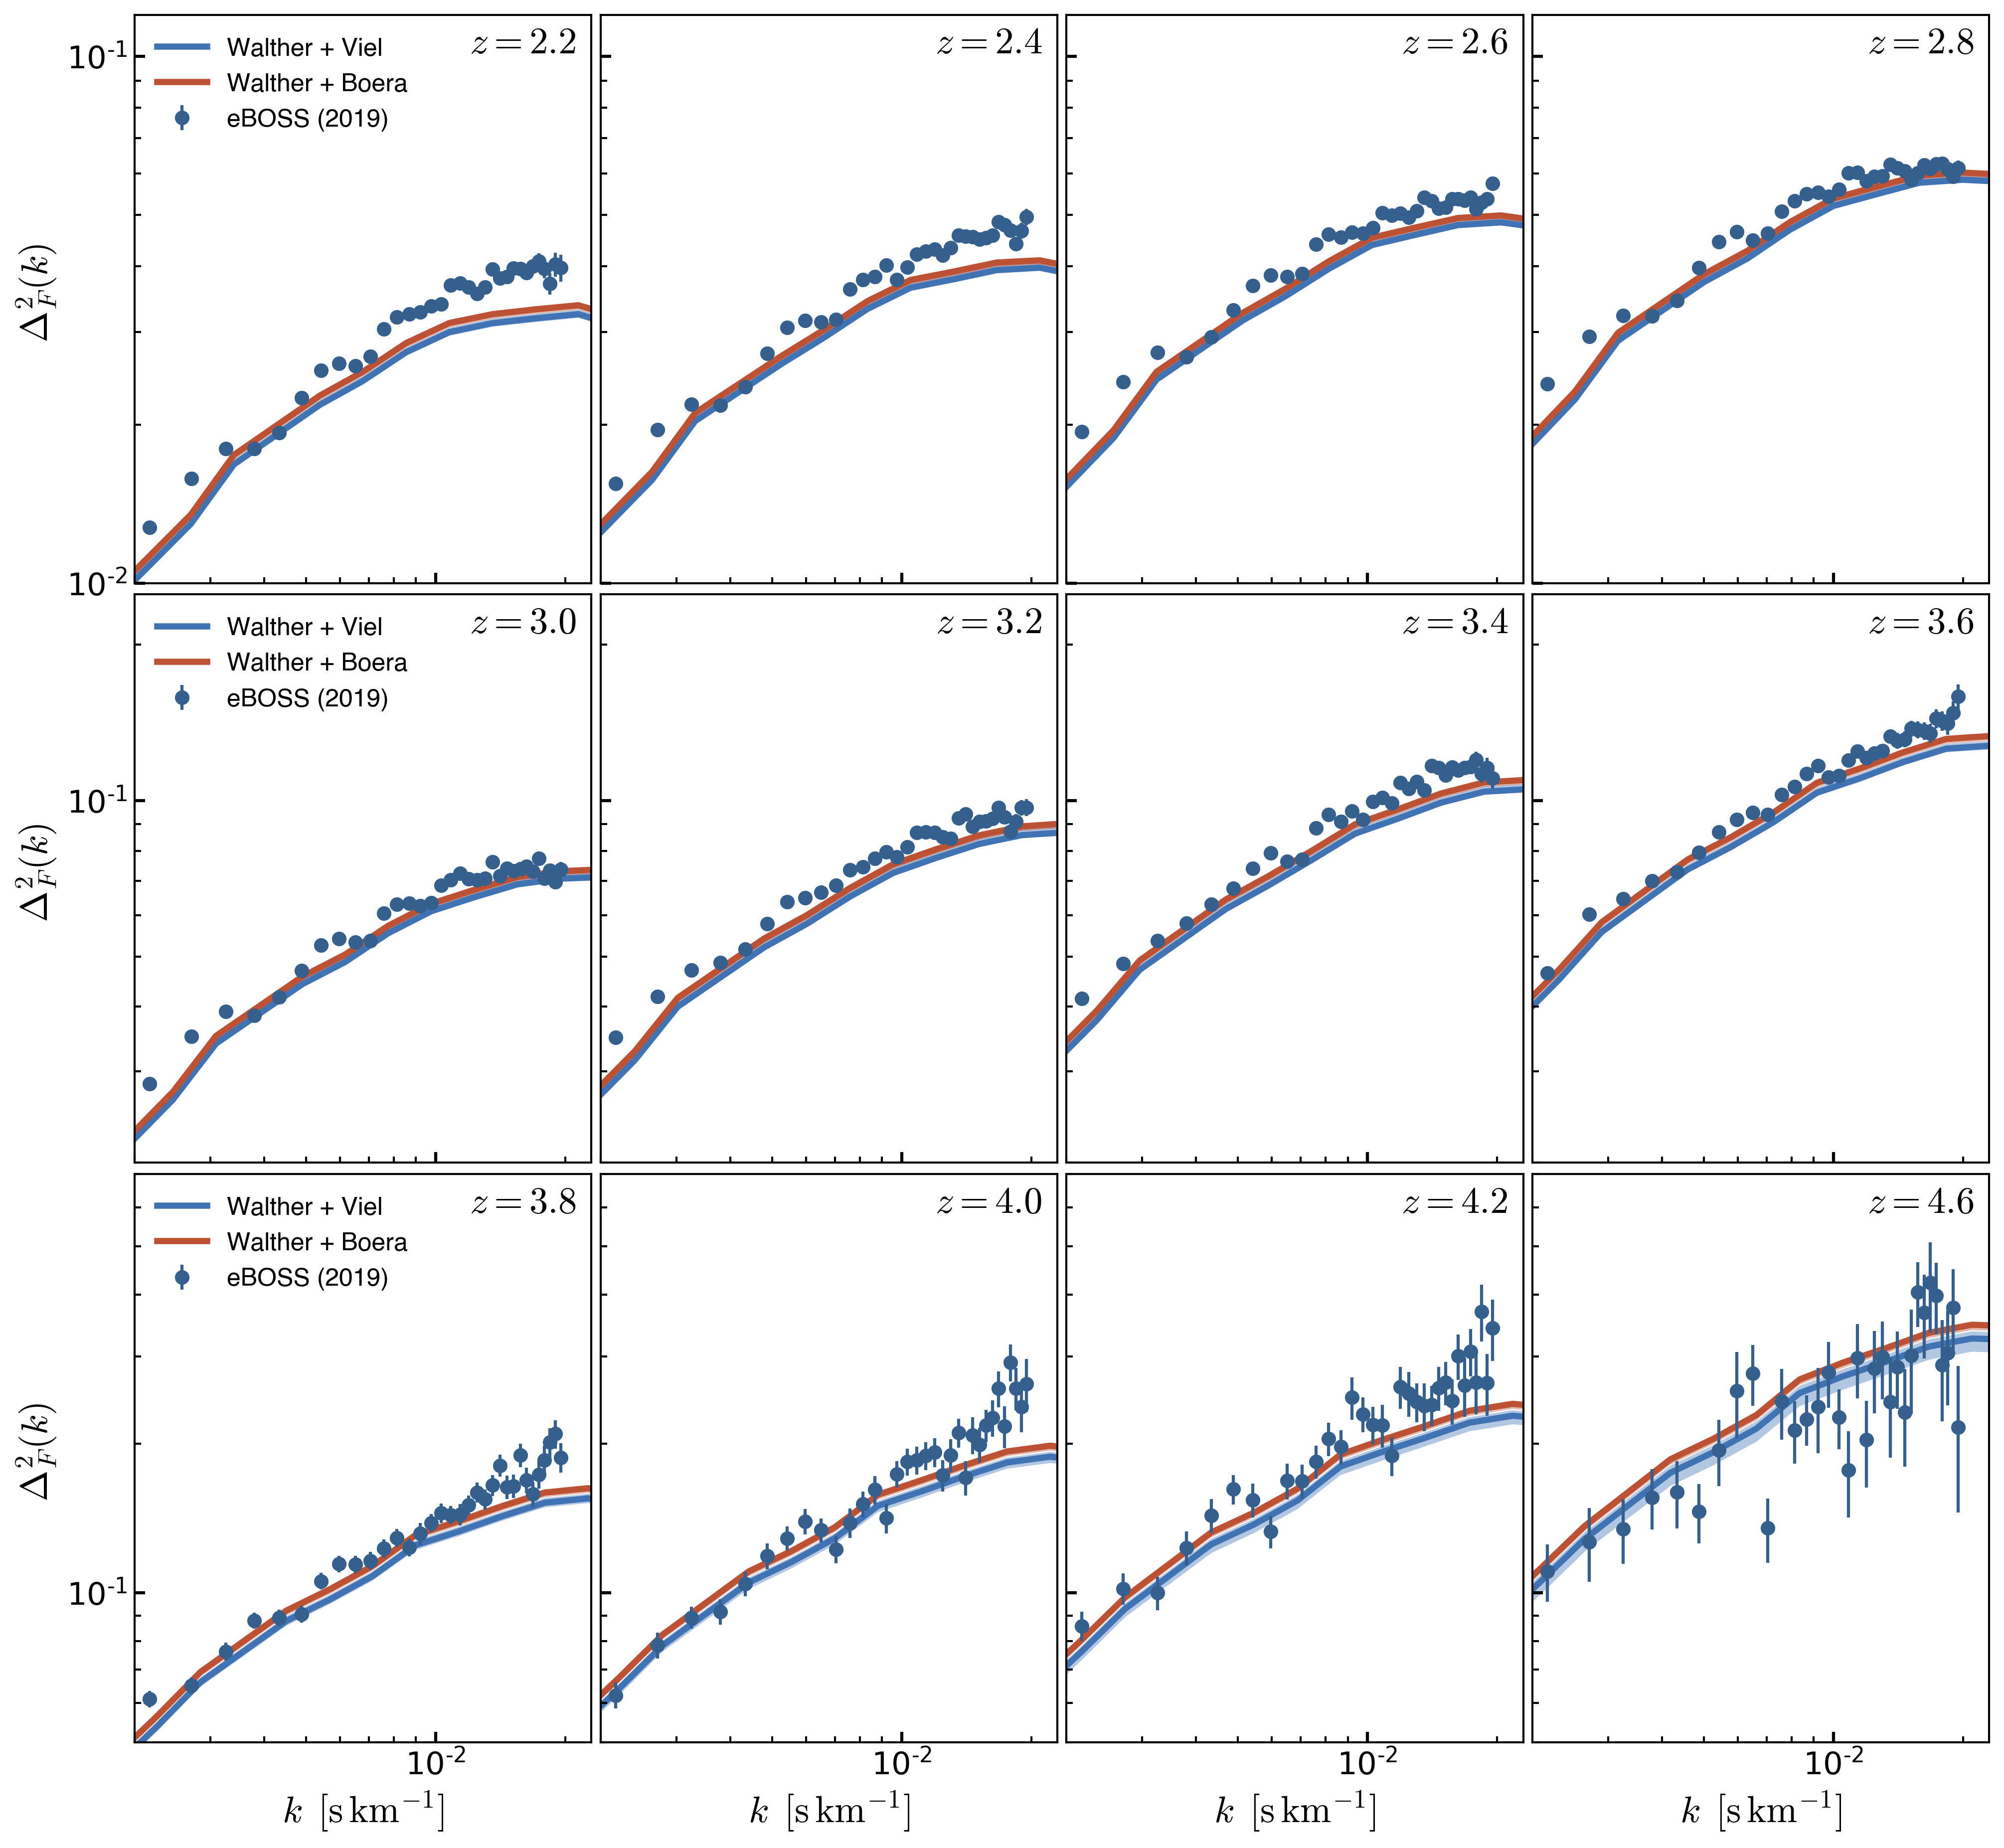
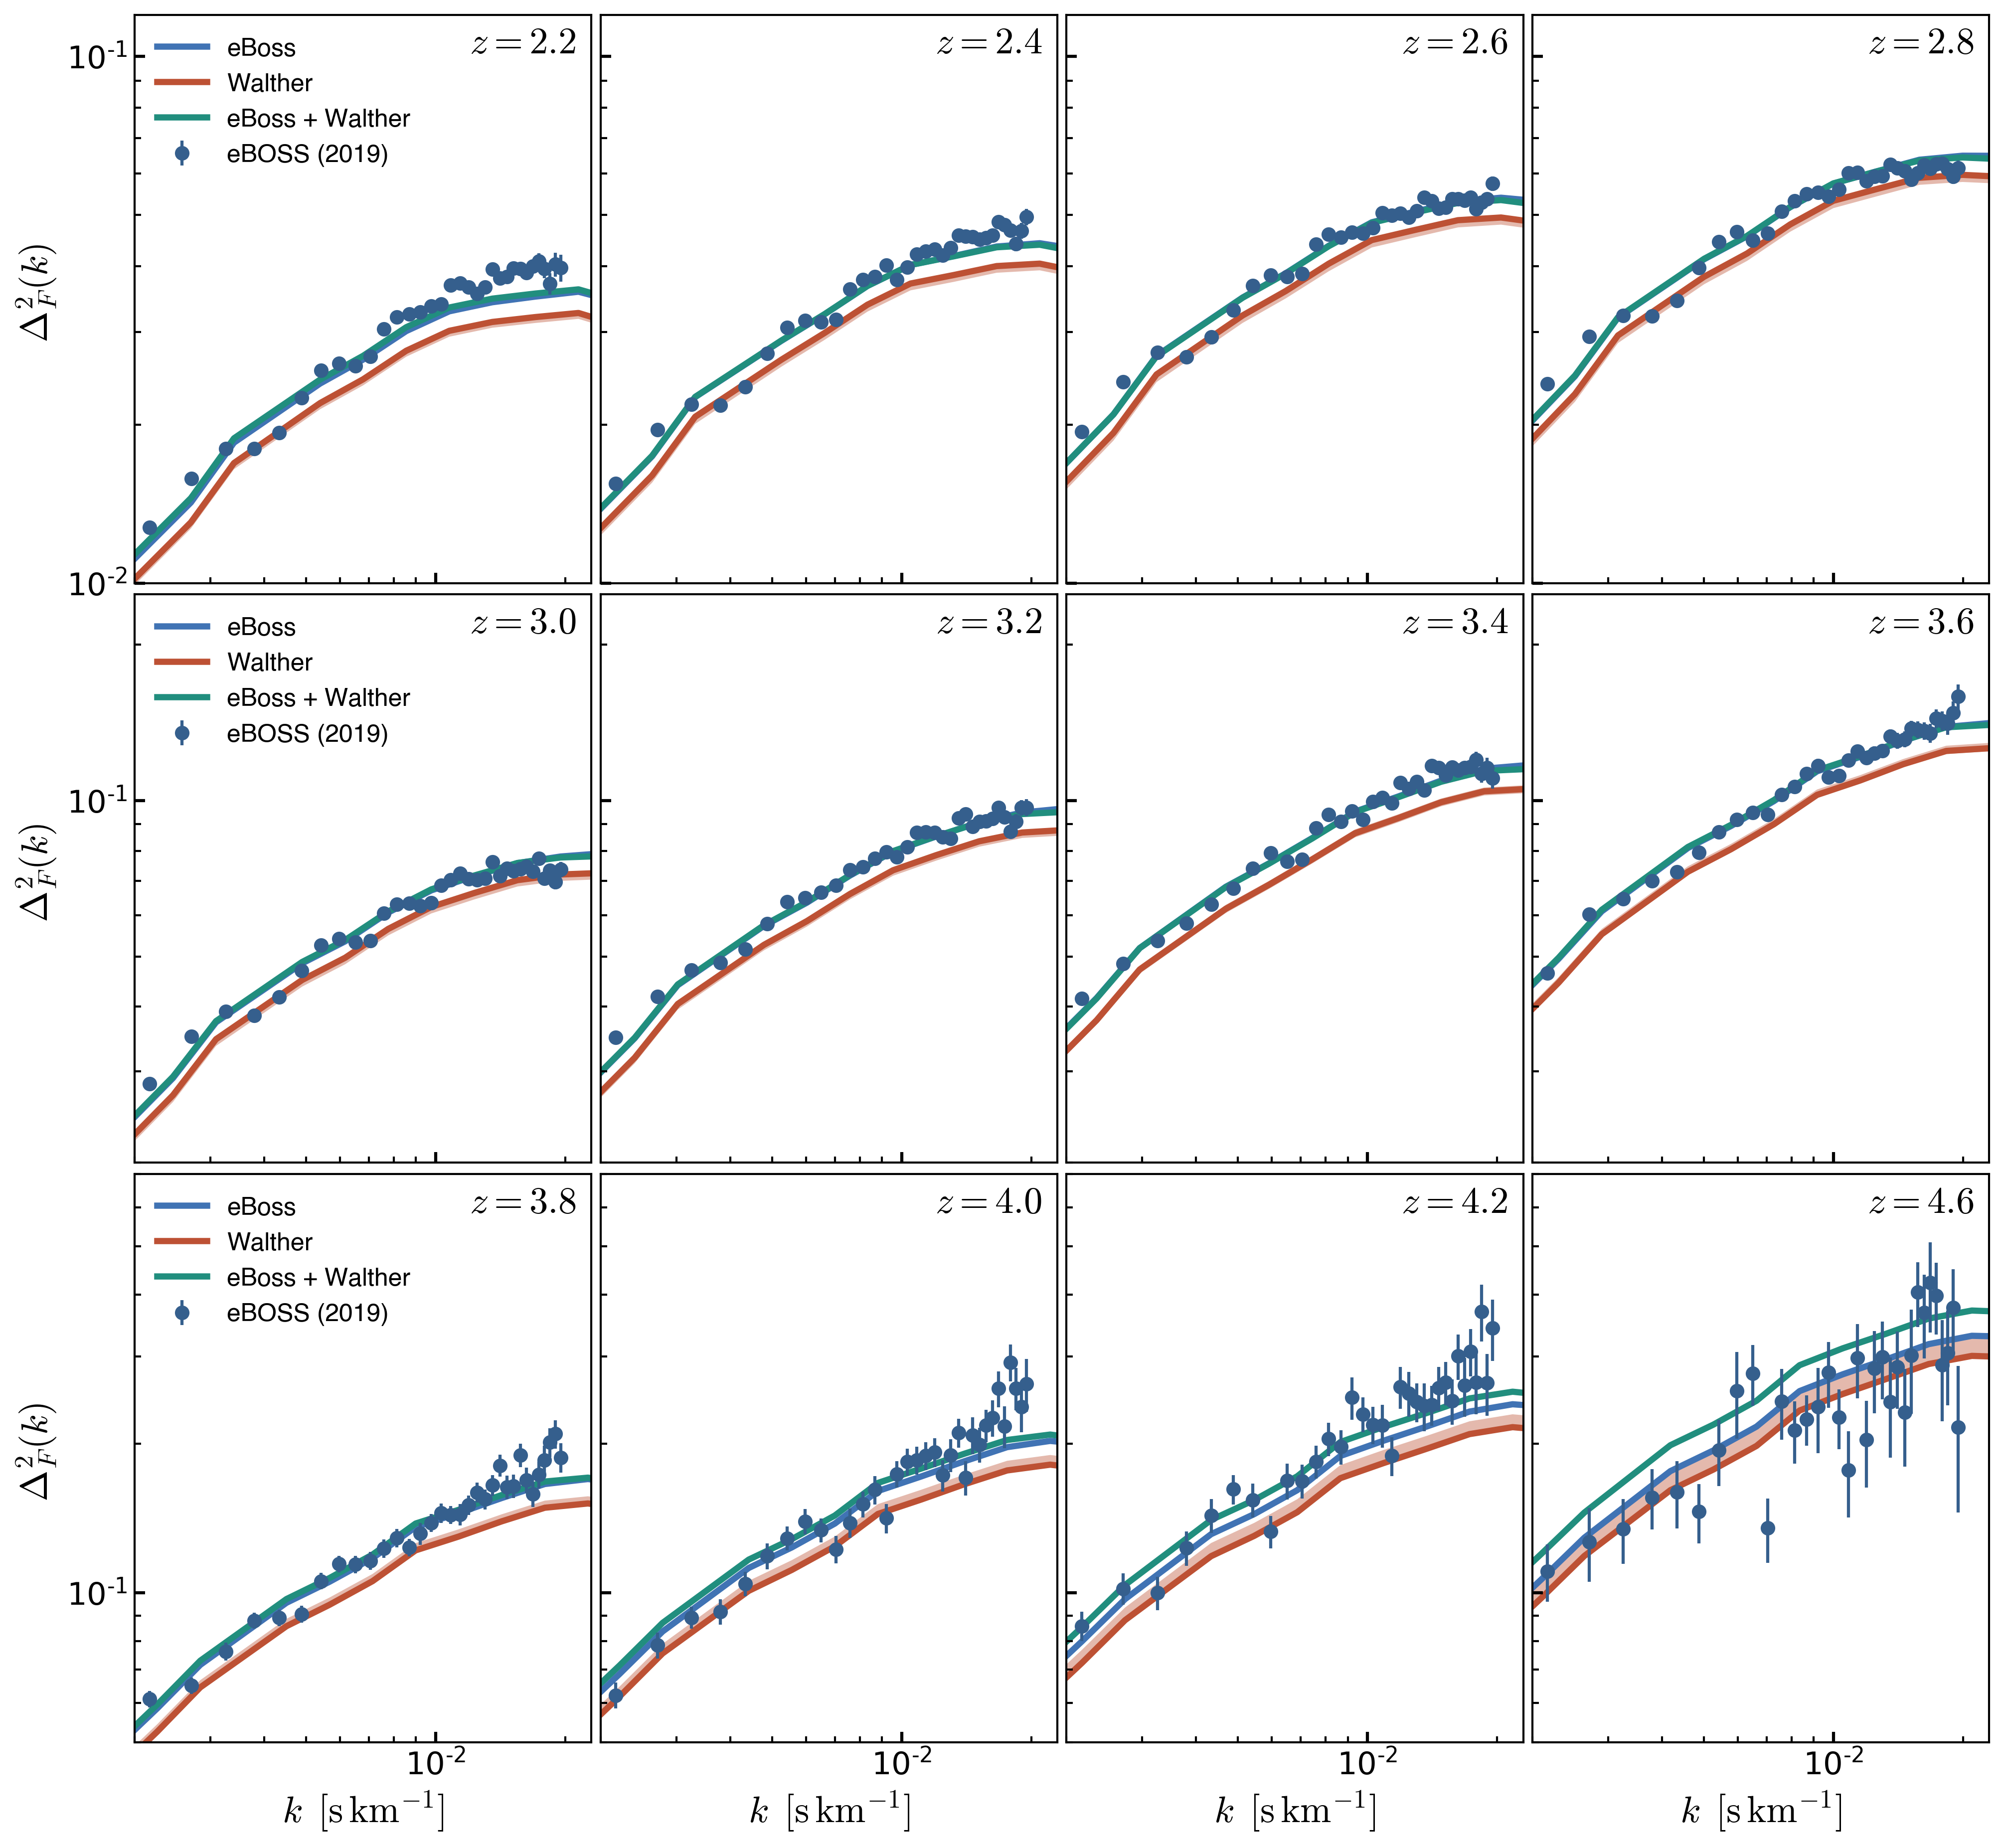
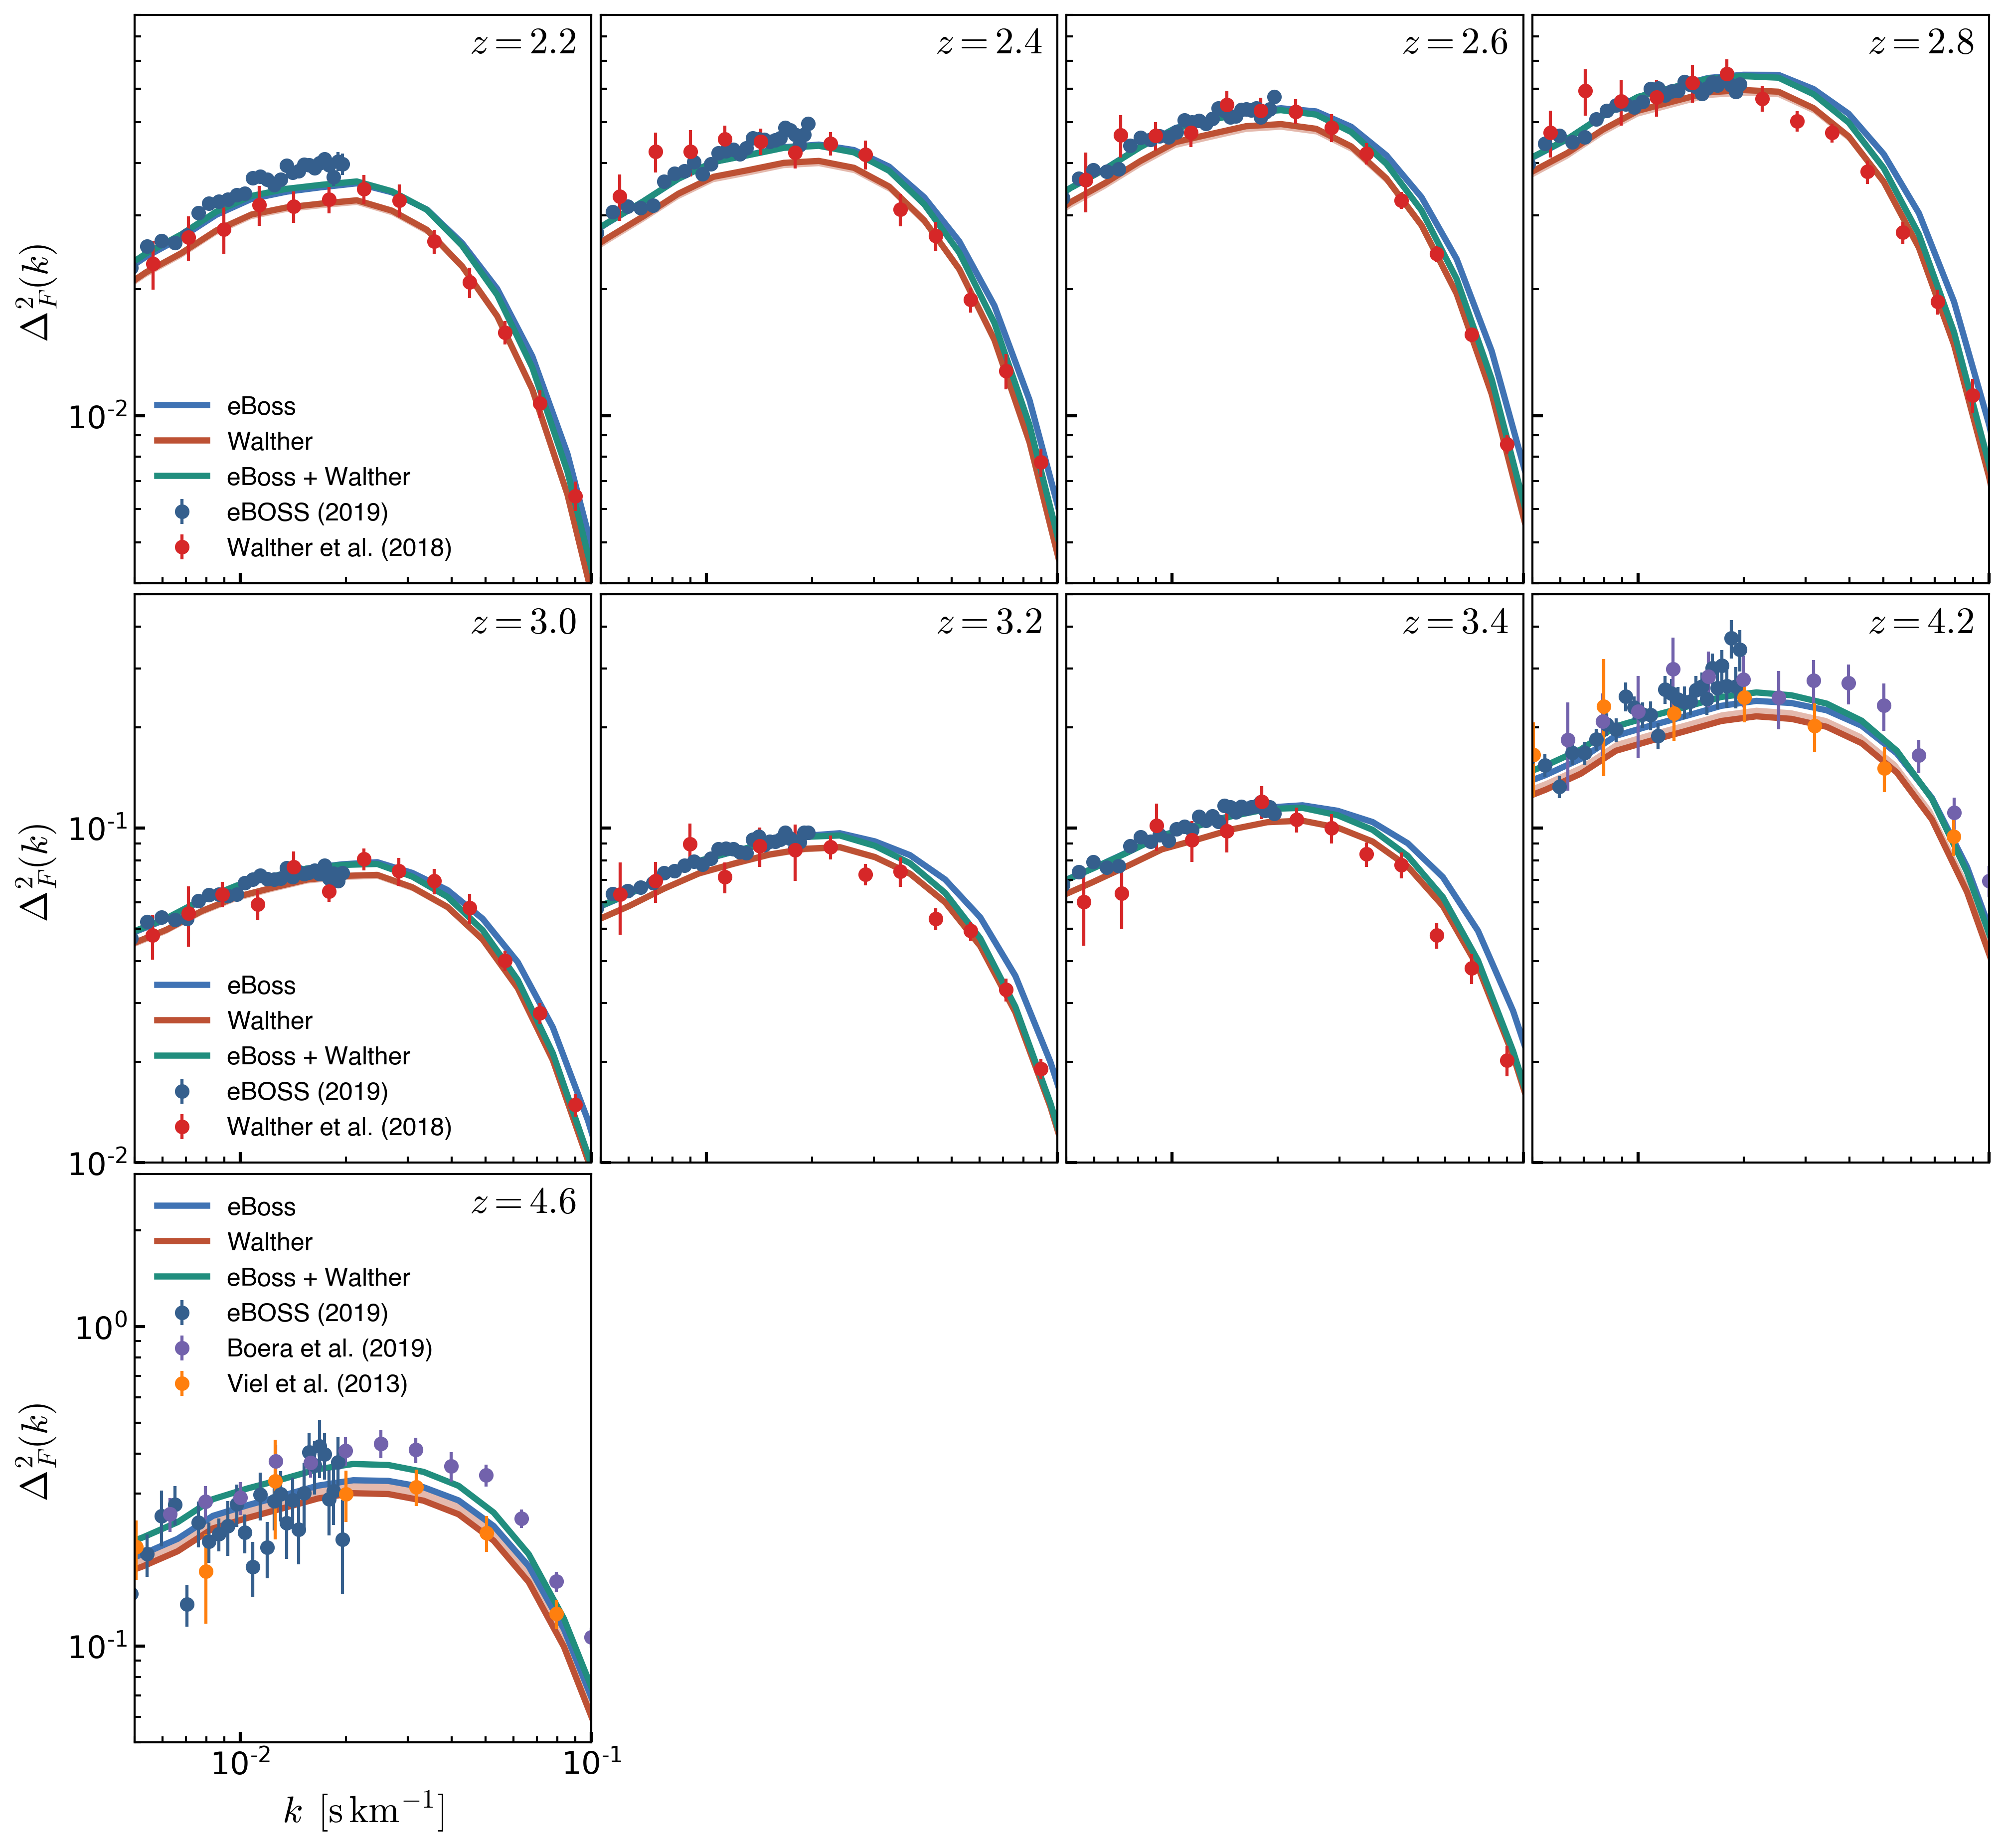
Below is the evolution of the power spectrum from the fitted posterior distribution of the parameters:
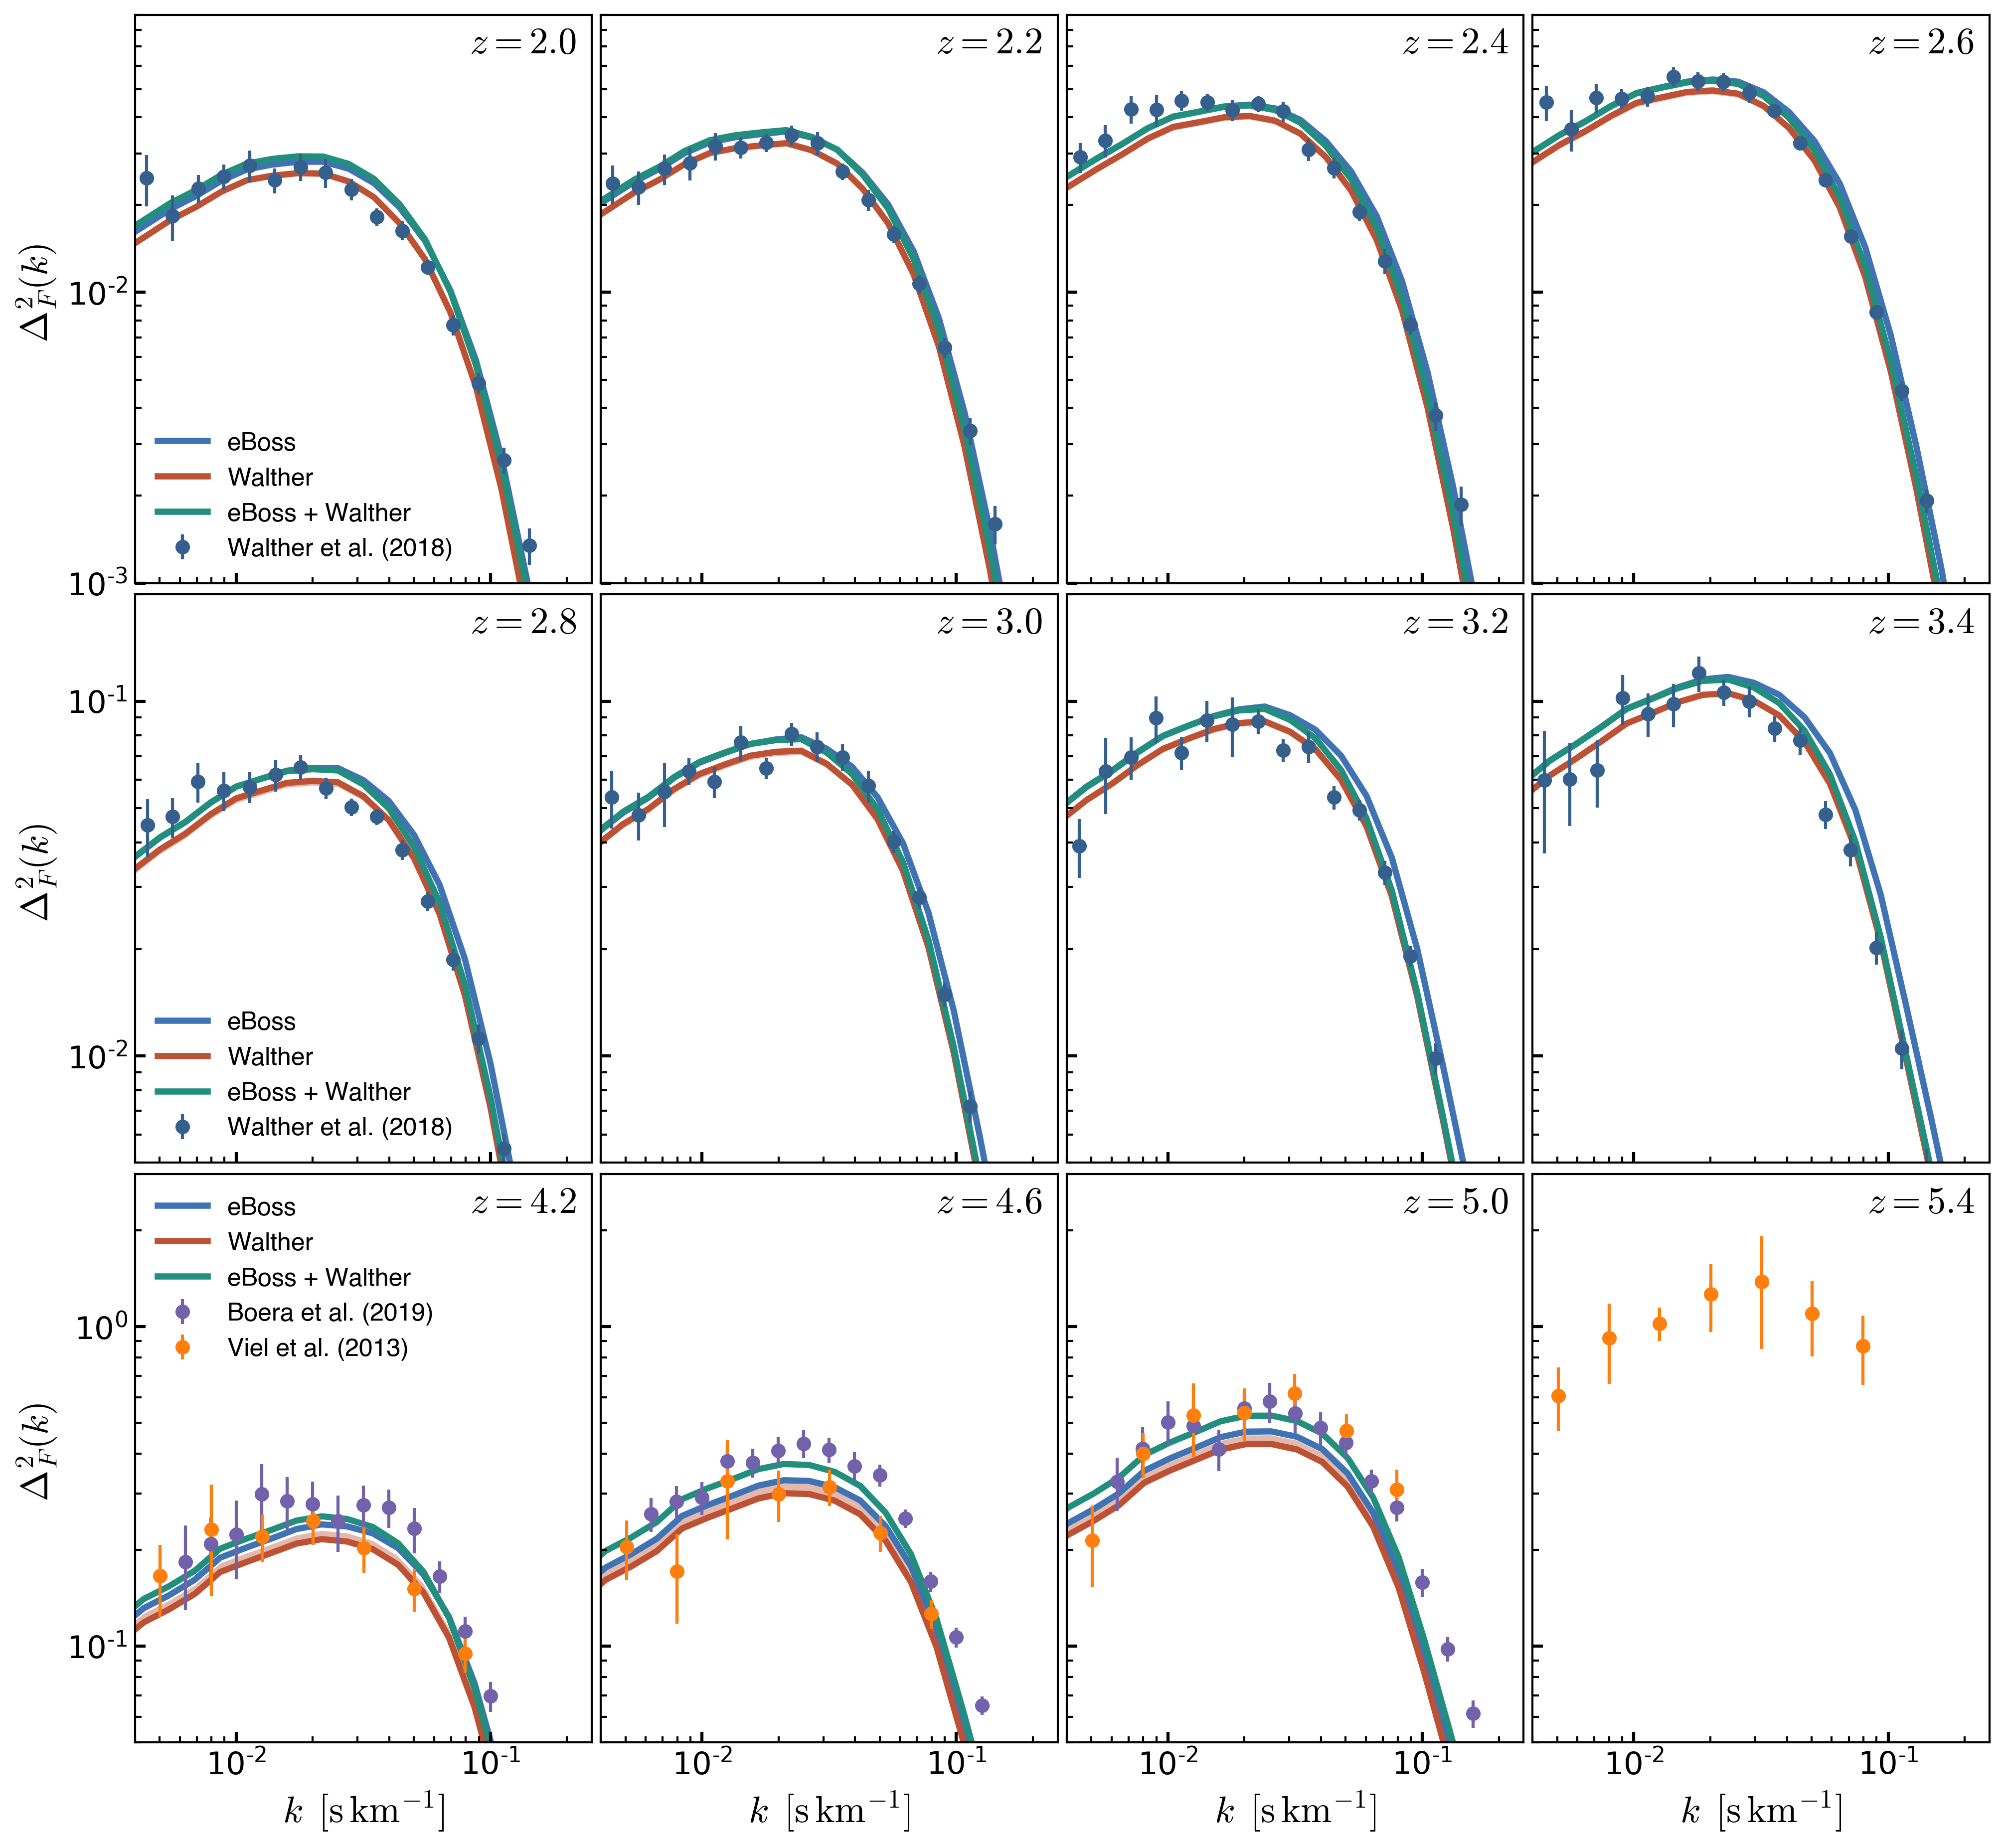
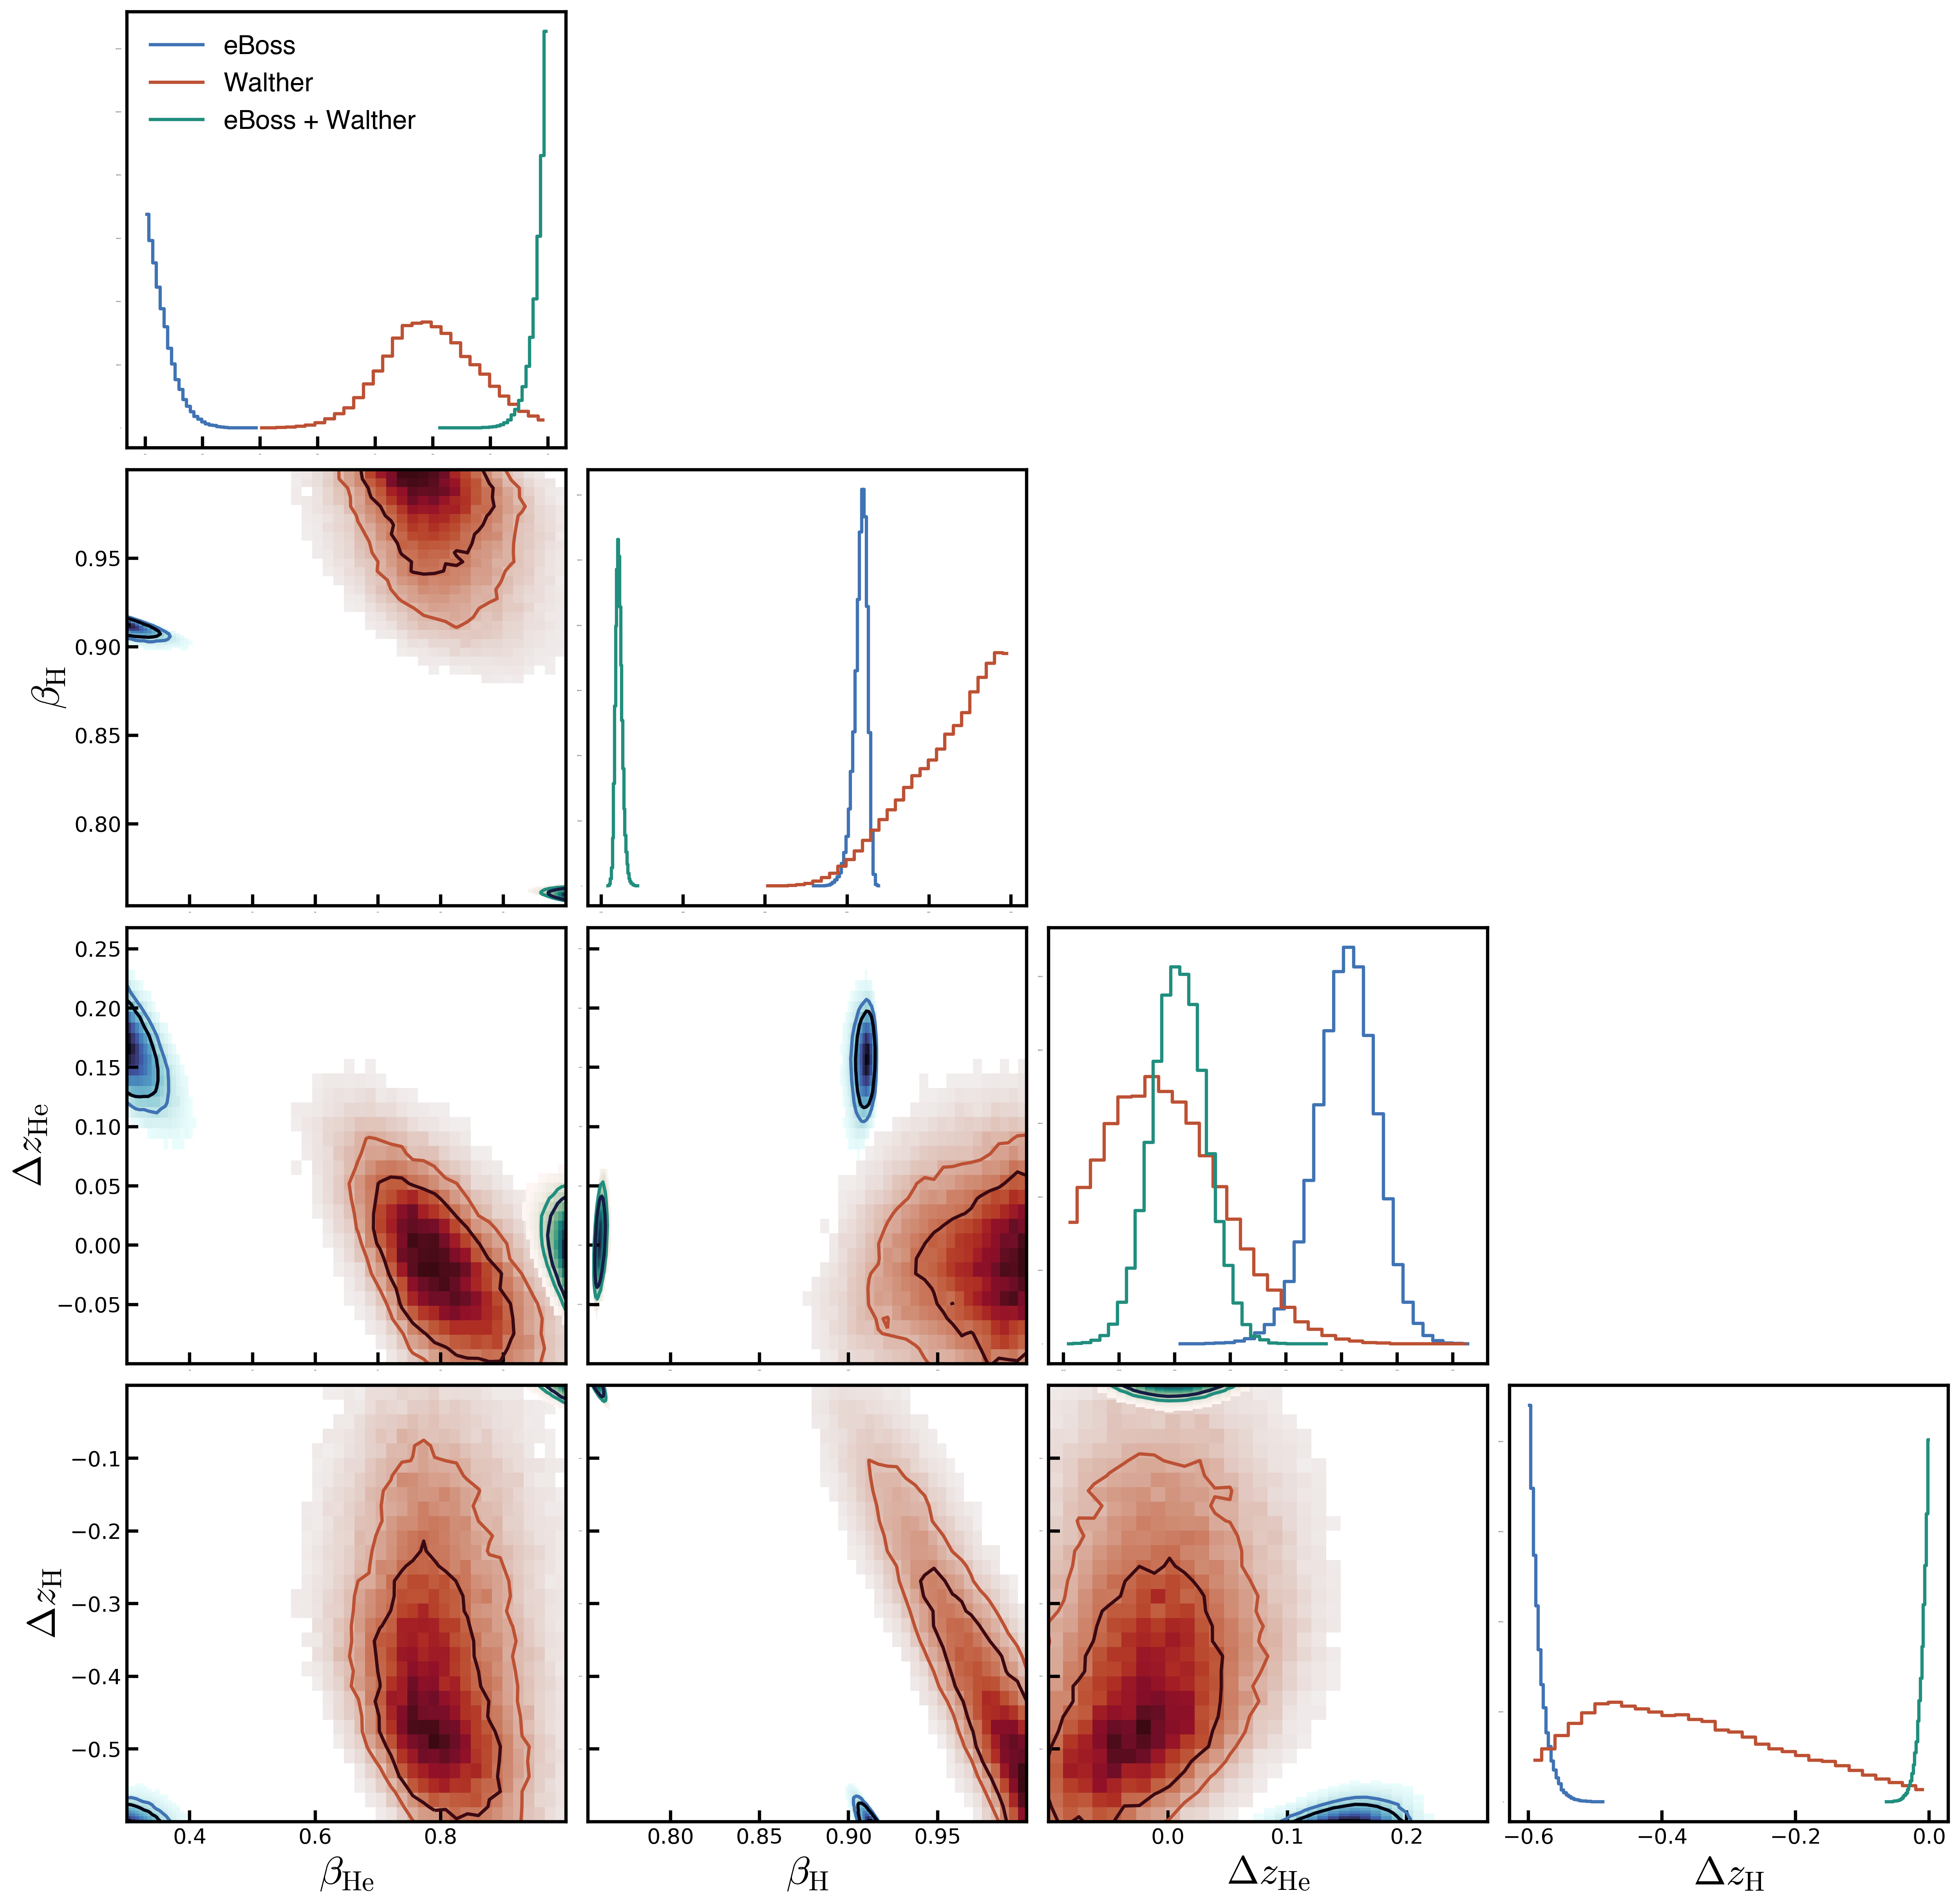
Now fitting to Walther, Boera and Viel data sets: