P(k) Error bars
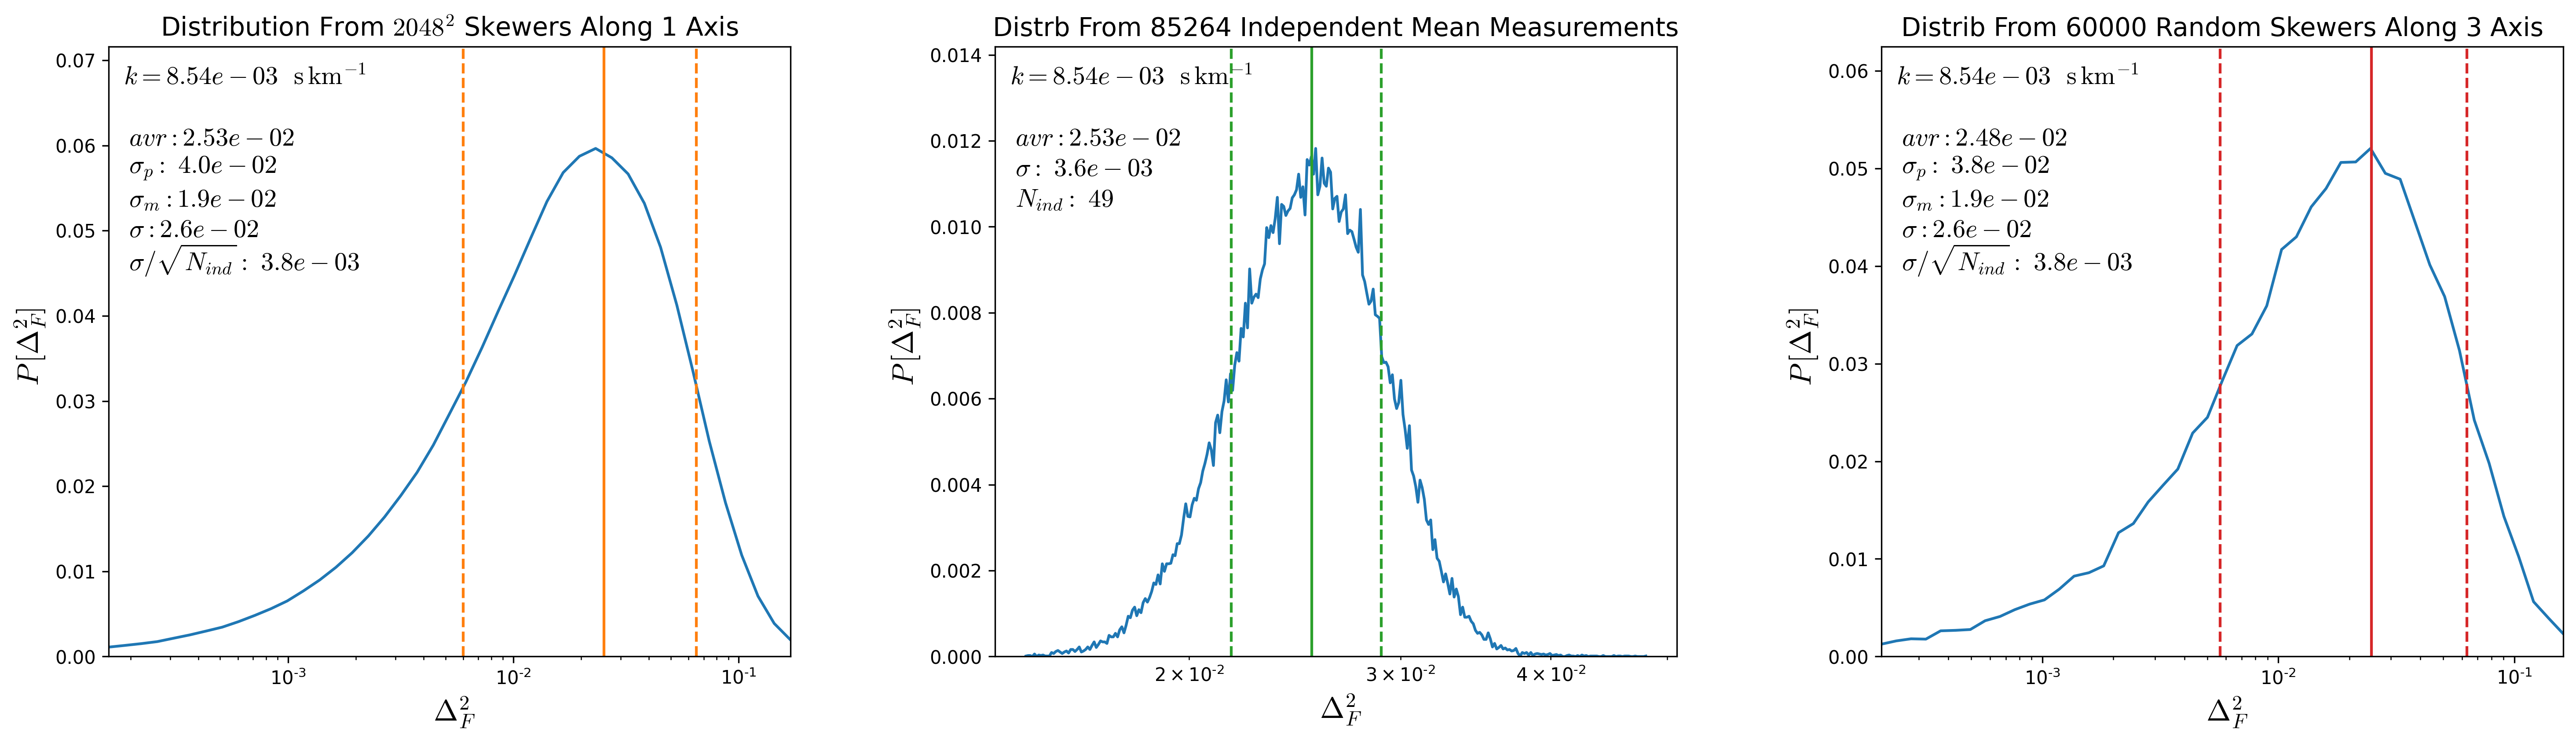
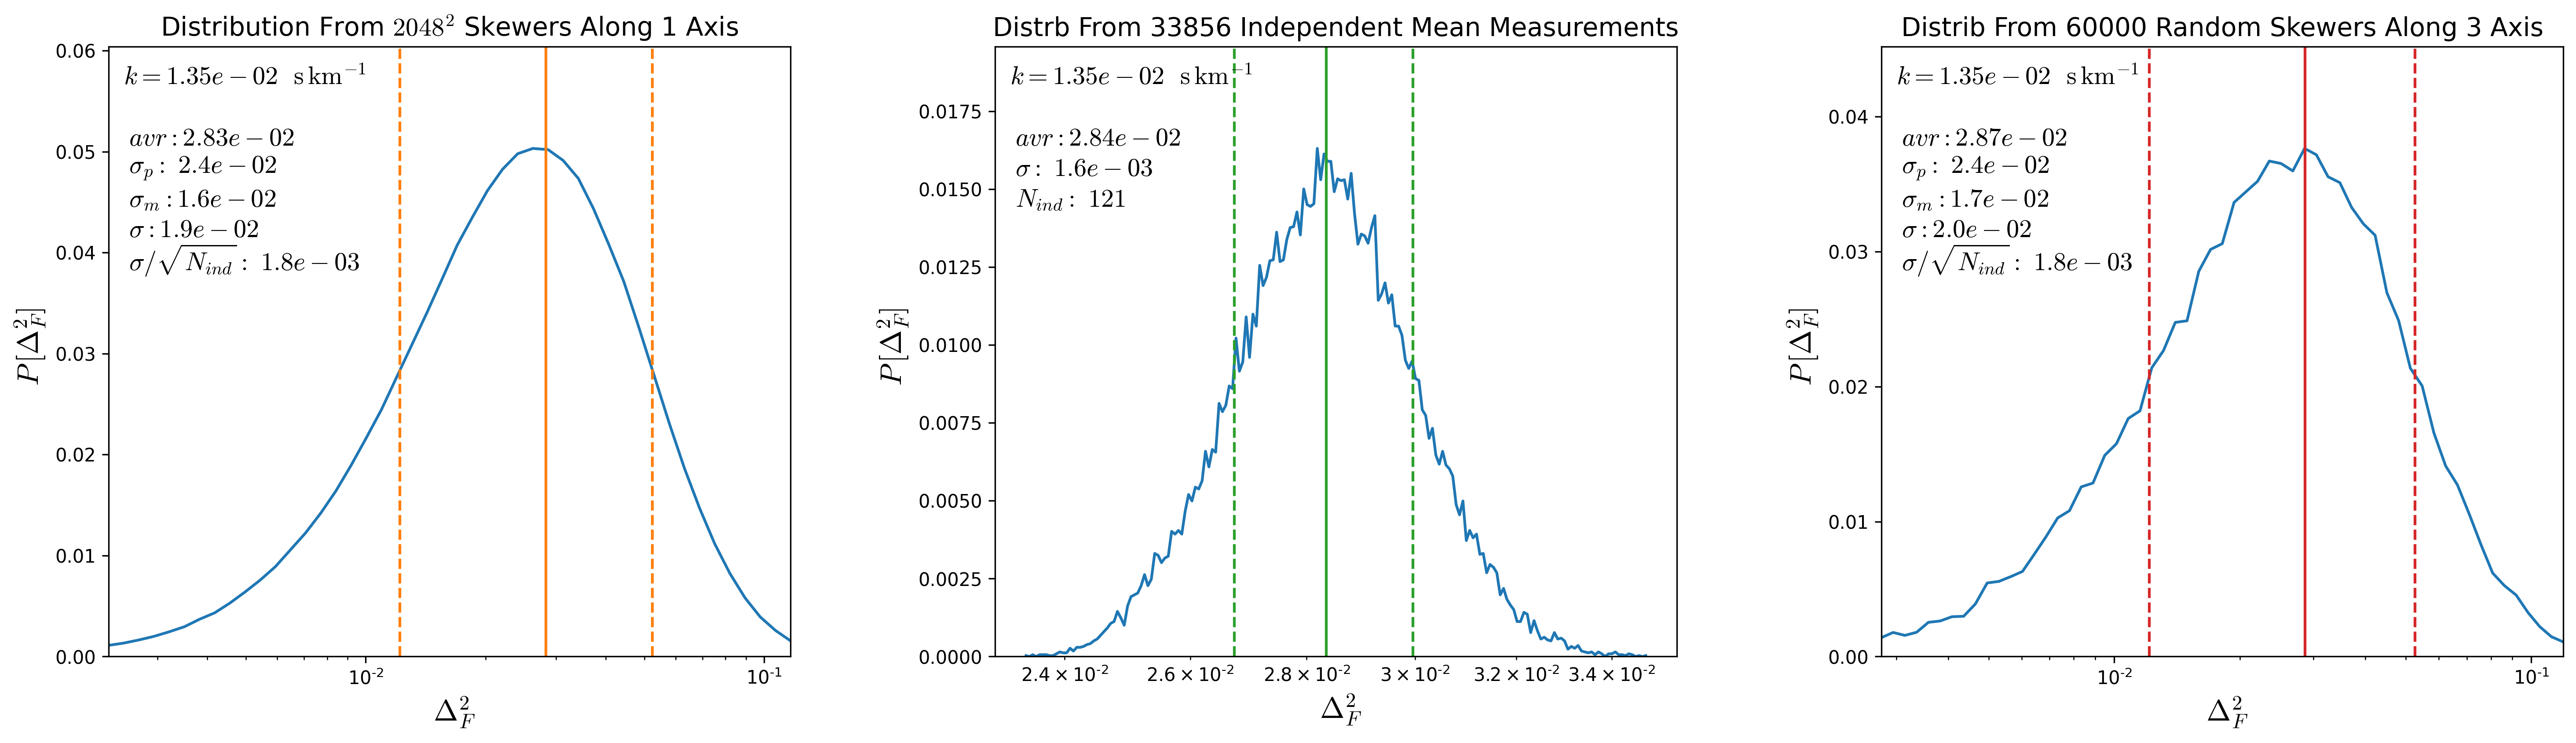
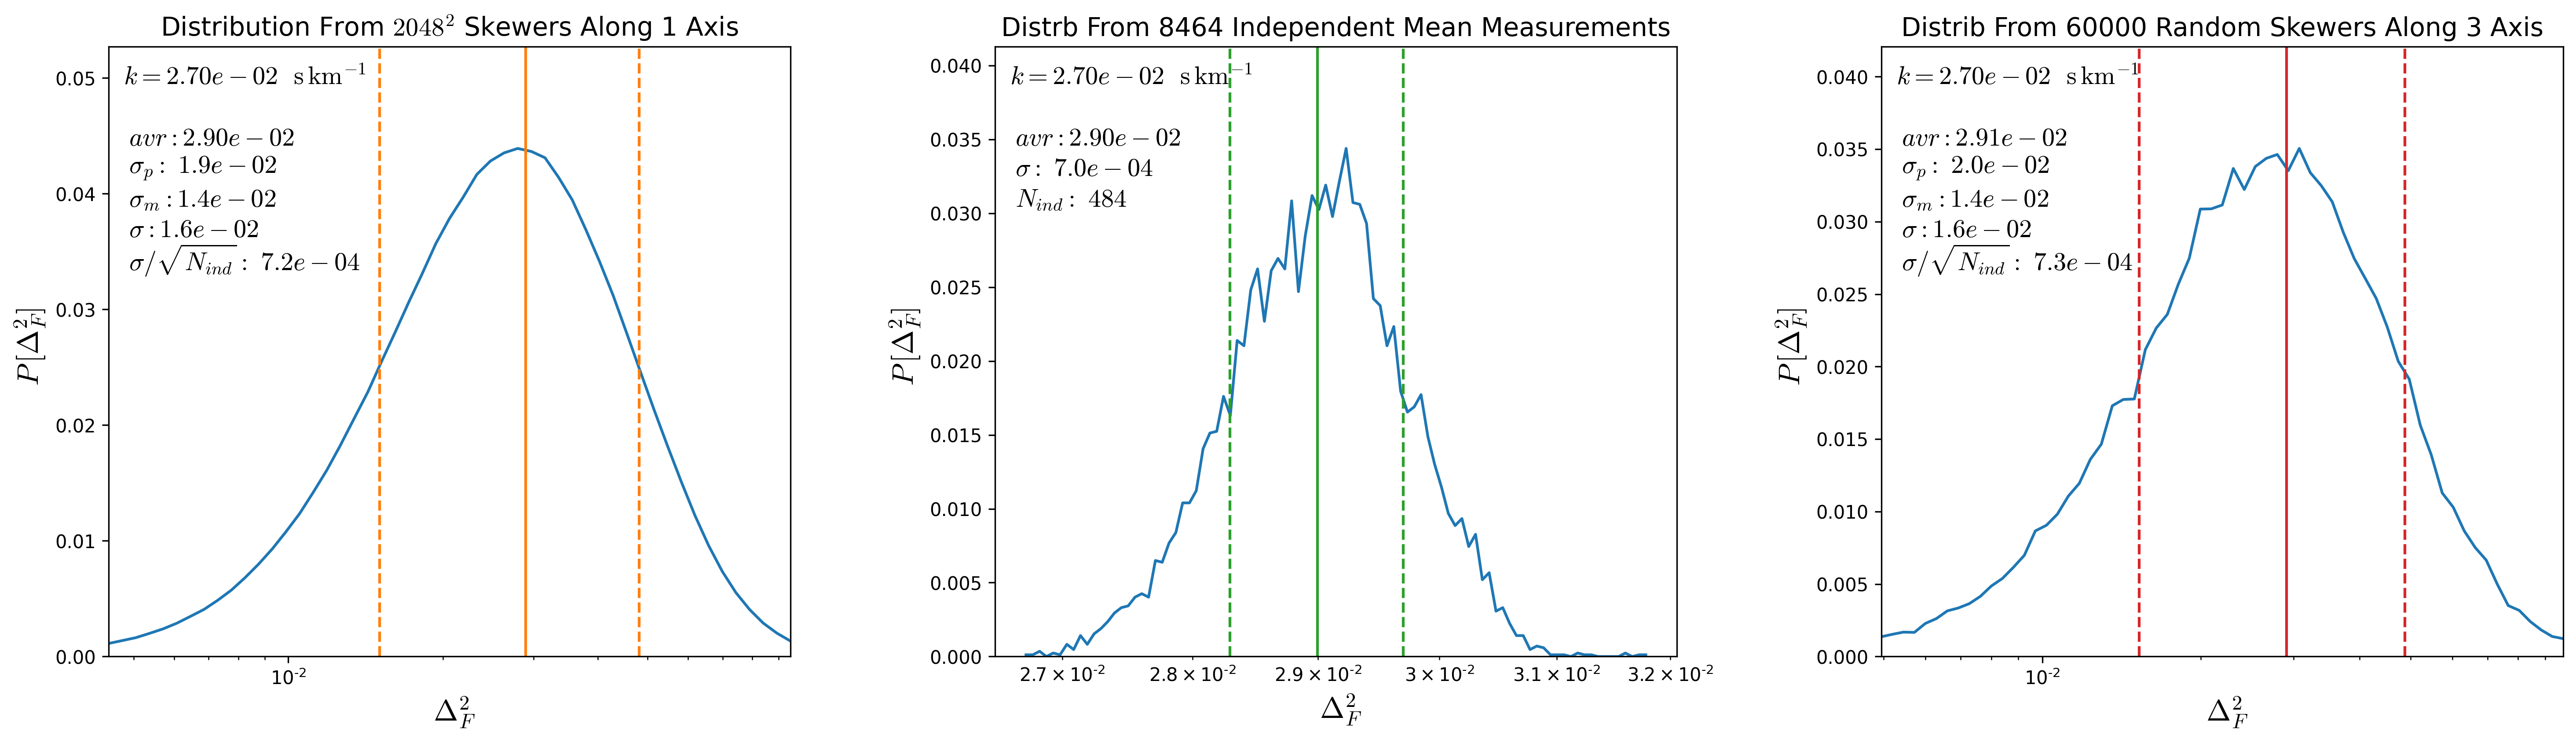
To compute the error bars in the mean \(P(k)\) we think that the distribution should be determined by the distribution of mean \(P(k)\) evaluated in different groups of independent skewers.
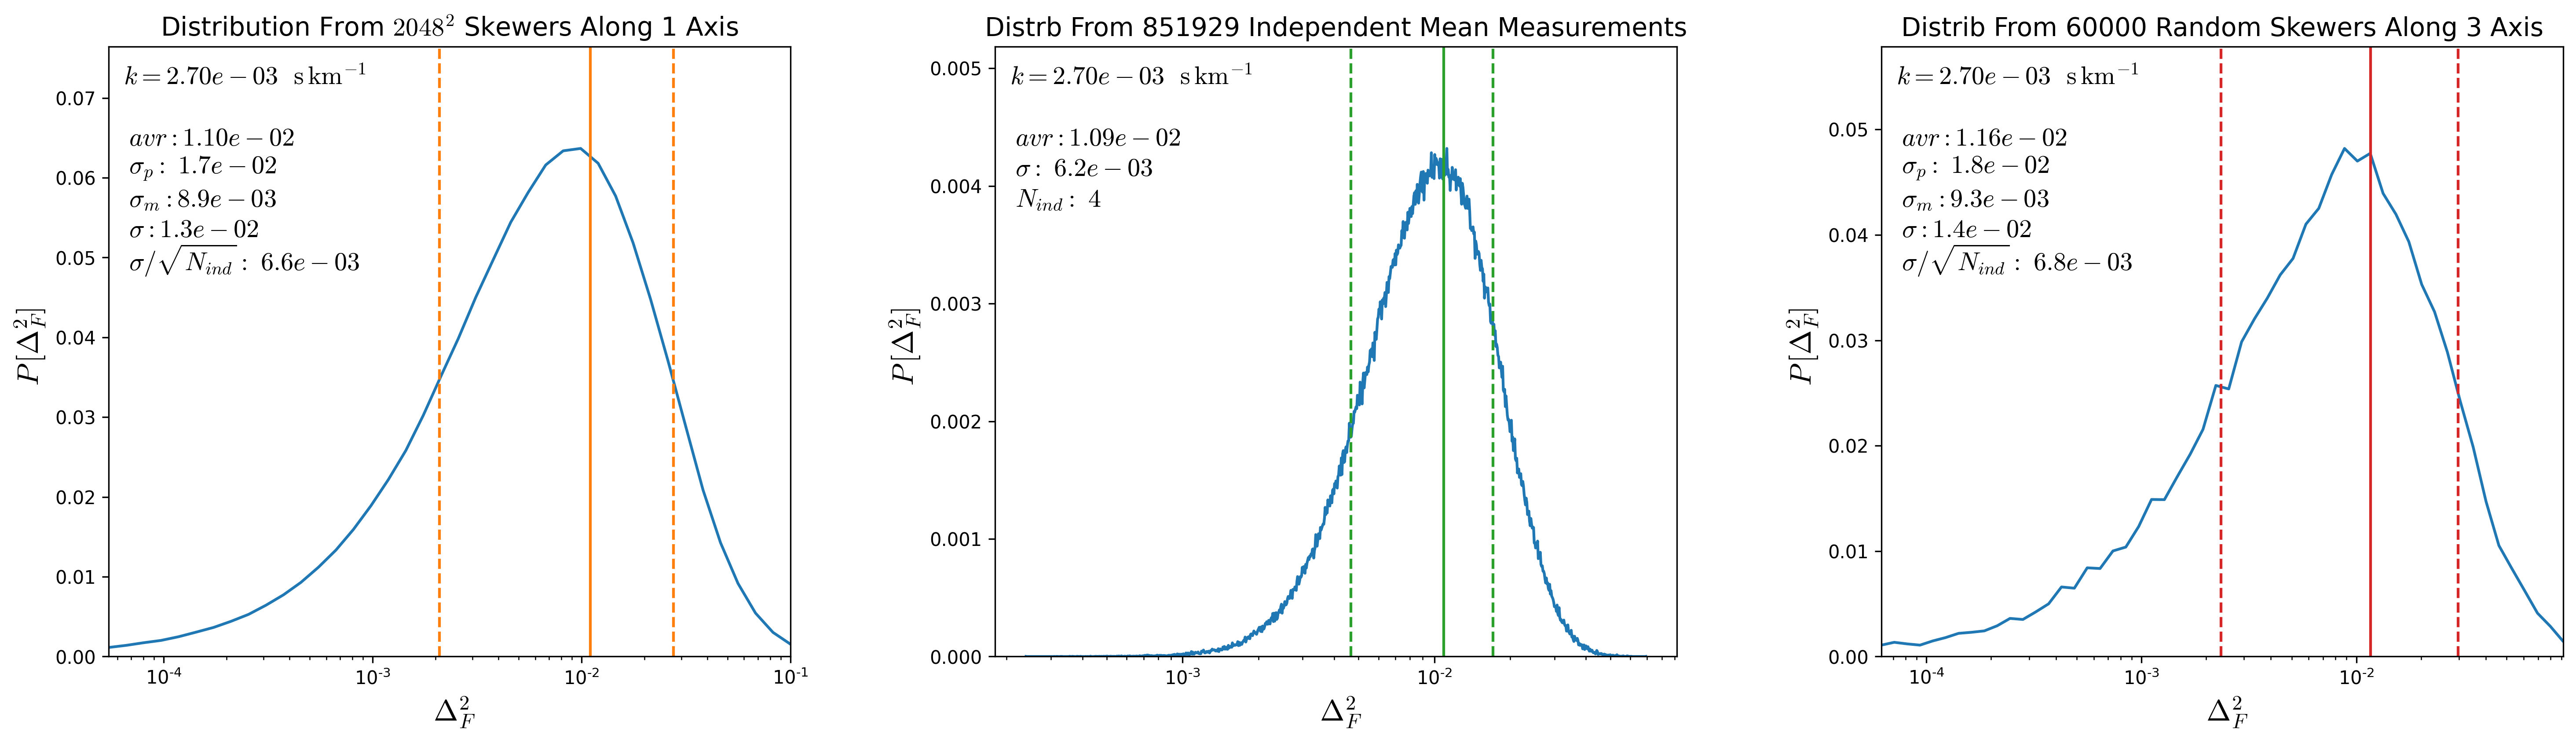
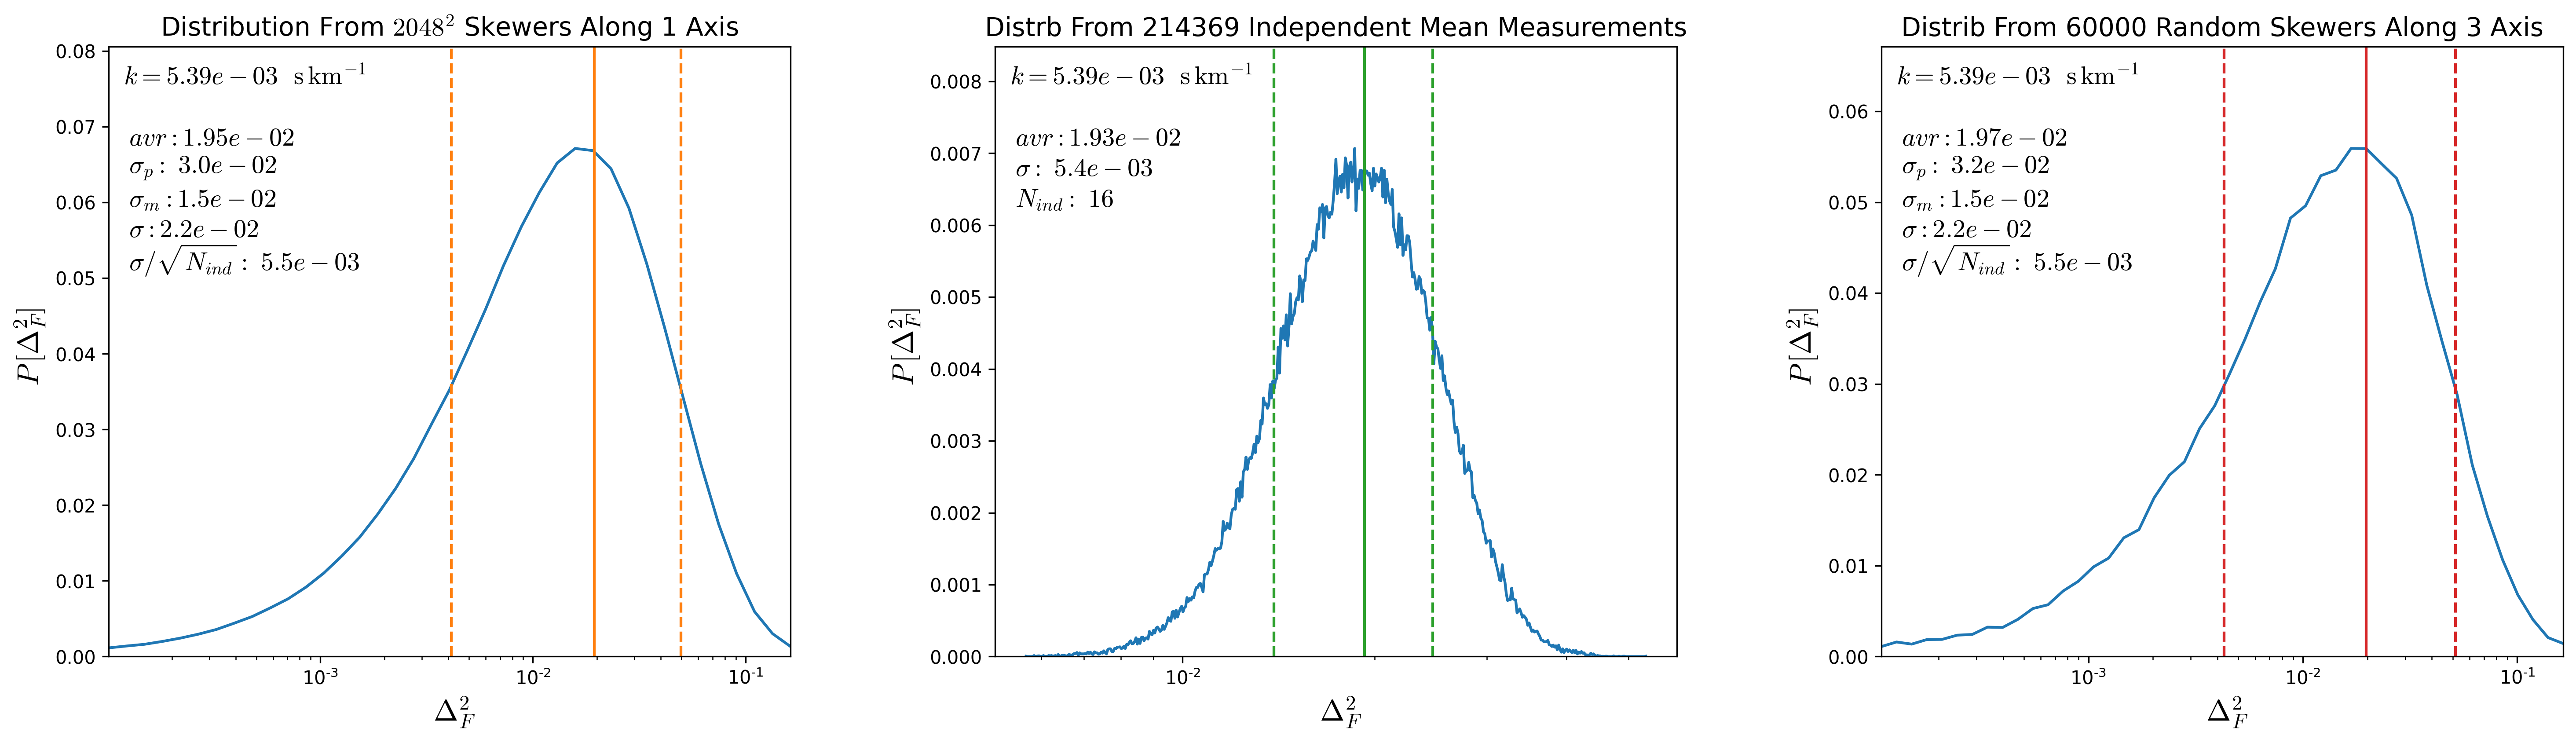
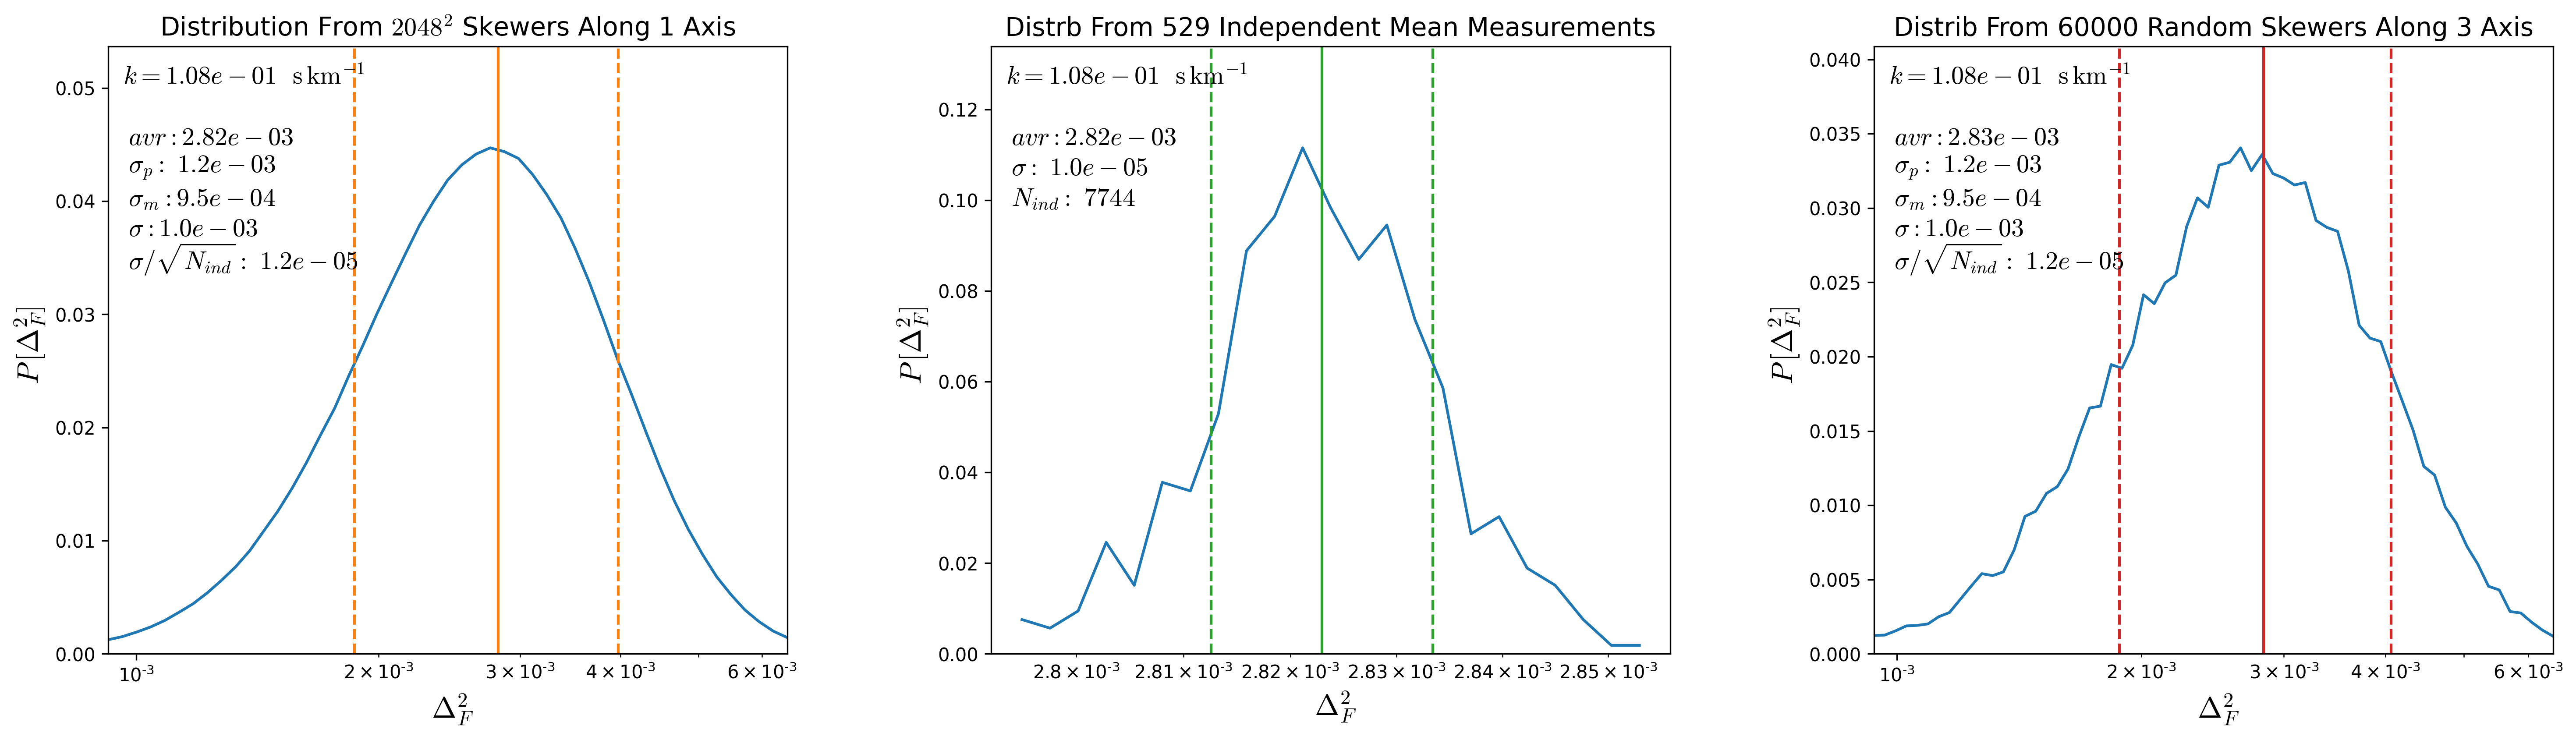
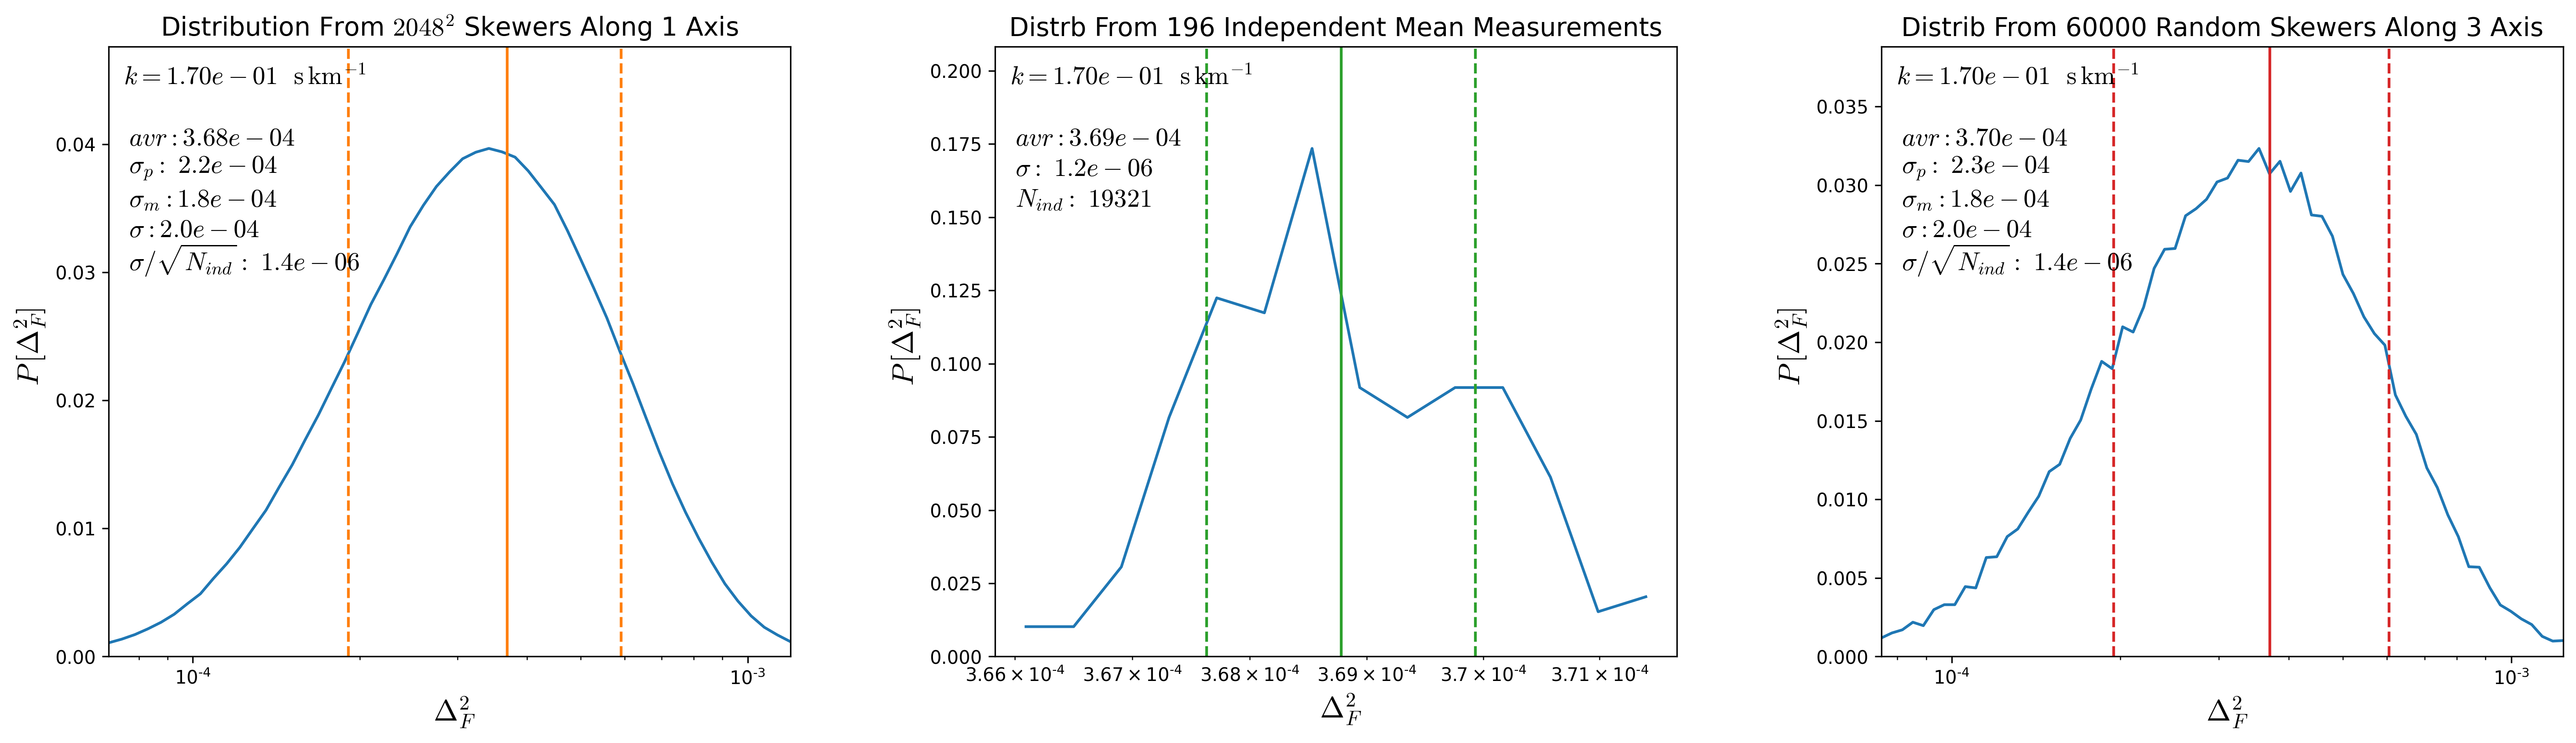
To test this, from a snapshot at \(z=2.5\) I compute the \(P(k)\) along each of the \(s048^3\) skewers along one direction. Then a given value of \(k\) corresponds to a distance and the grid of skewers separated by this distance are considered independent, the distribution of mean \(P(k)\) over all the possible independent groups are shown in the middle panels of the figures below for different \(k\) values, the green lines shot the mean and the \(1\sigma\) interval from such distributions, the number of independent skewers for a given \(k\) is shown in the middle panel as \(N_{ind}\)
The left panels show the distribution of \(P(k)\) over the entire \(2048^2\) skewers, orange lines denote the mean and the \(1\sigma\) regions. Adittionally I show the value of \(\sigma / \sqrt{N_{ind}}\) where \(\sigma\) corresponds to the standard deviation from the global distribution, as shown \(\sigma / \sqrt{N_{ind}}\) is comparable to the standard deviation in the distribution from the second panel.
So the standard deviation in the global distribution divided by \(\sqrt{N_{ind}}\) is comparable to \(\sigma\) from the distribution of mean \(P(k)\) over the independent groups.
Finally the right panel shows the distribution from 60000 random skewers drawn from the 3 directions, and again \(\sigma\) of this distribution divided by \(\sqrt{N_{ind}}\) is comparable to \(\sigma\) from the distribution of mean \(P(k)\) over the independent groups.
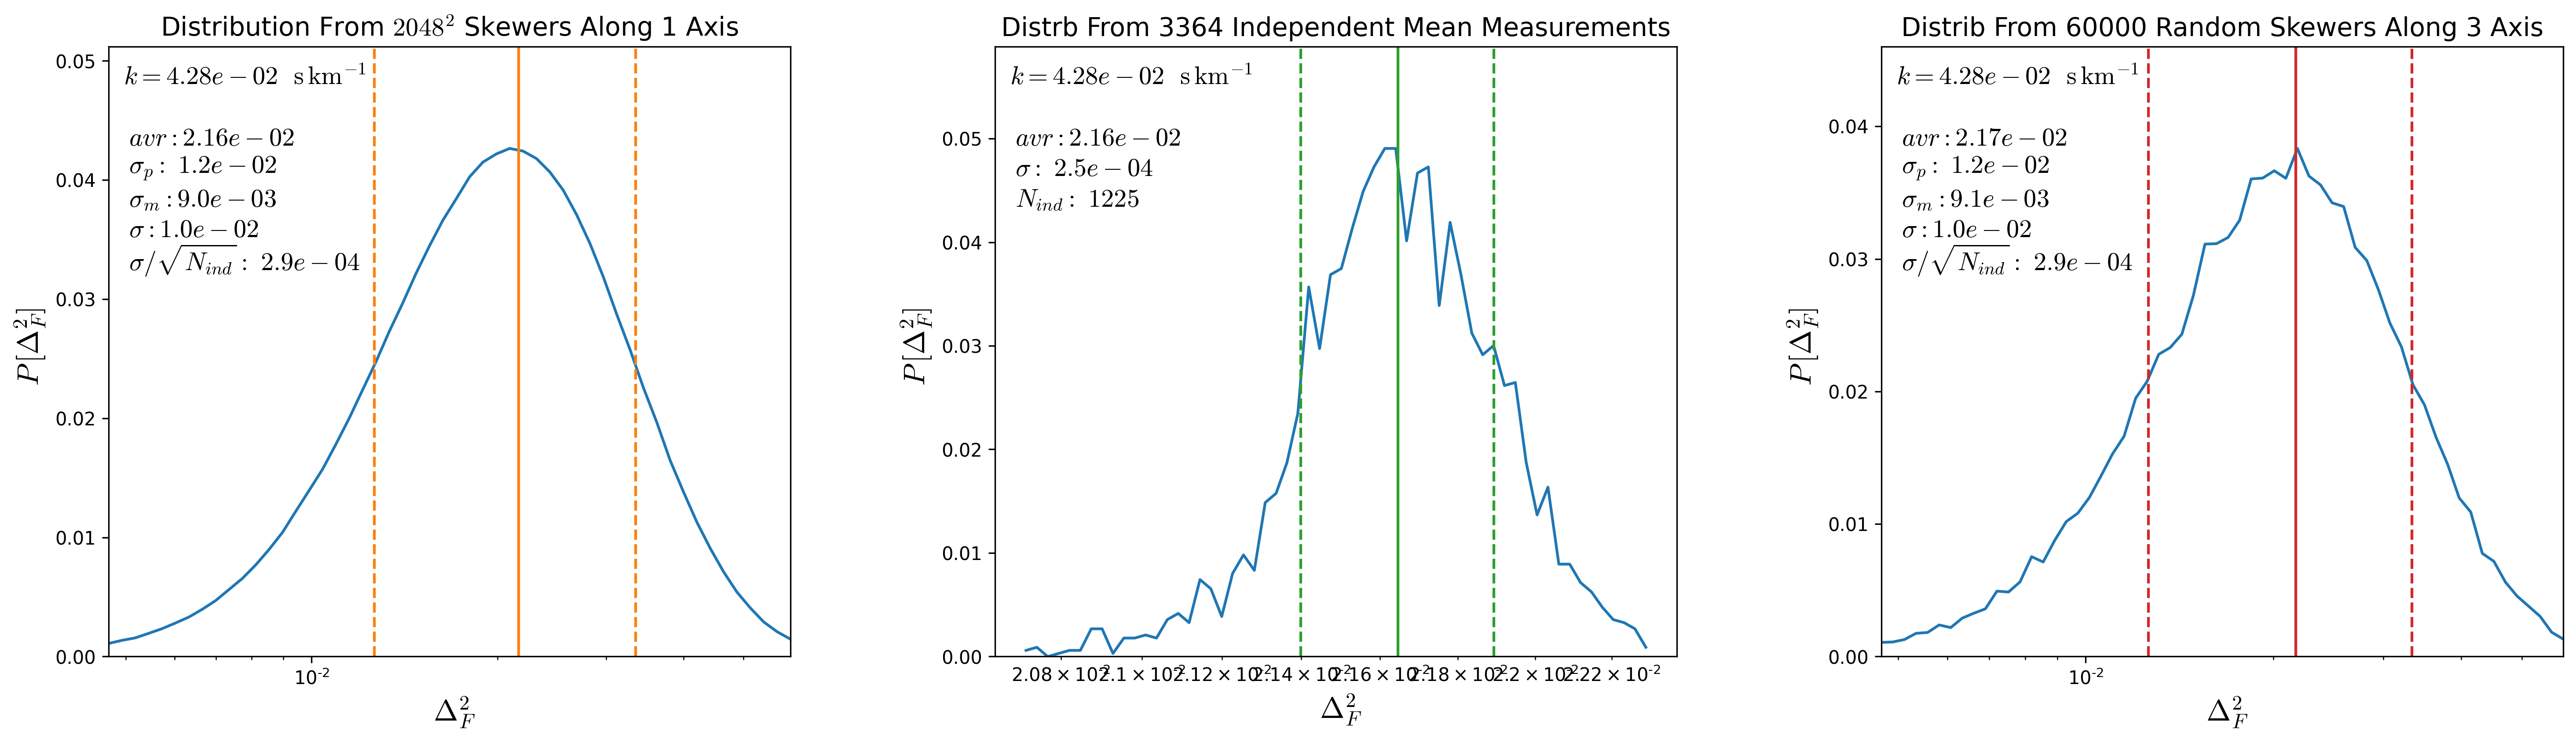
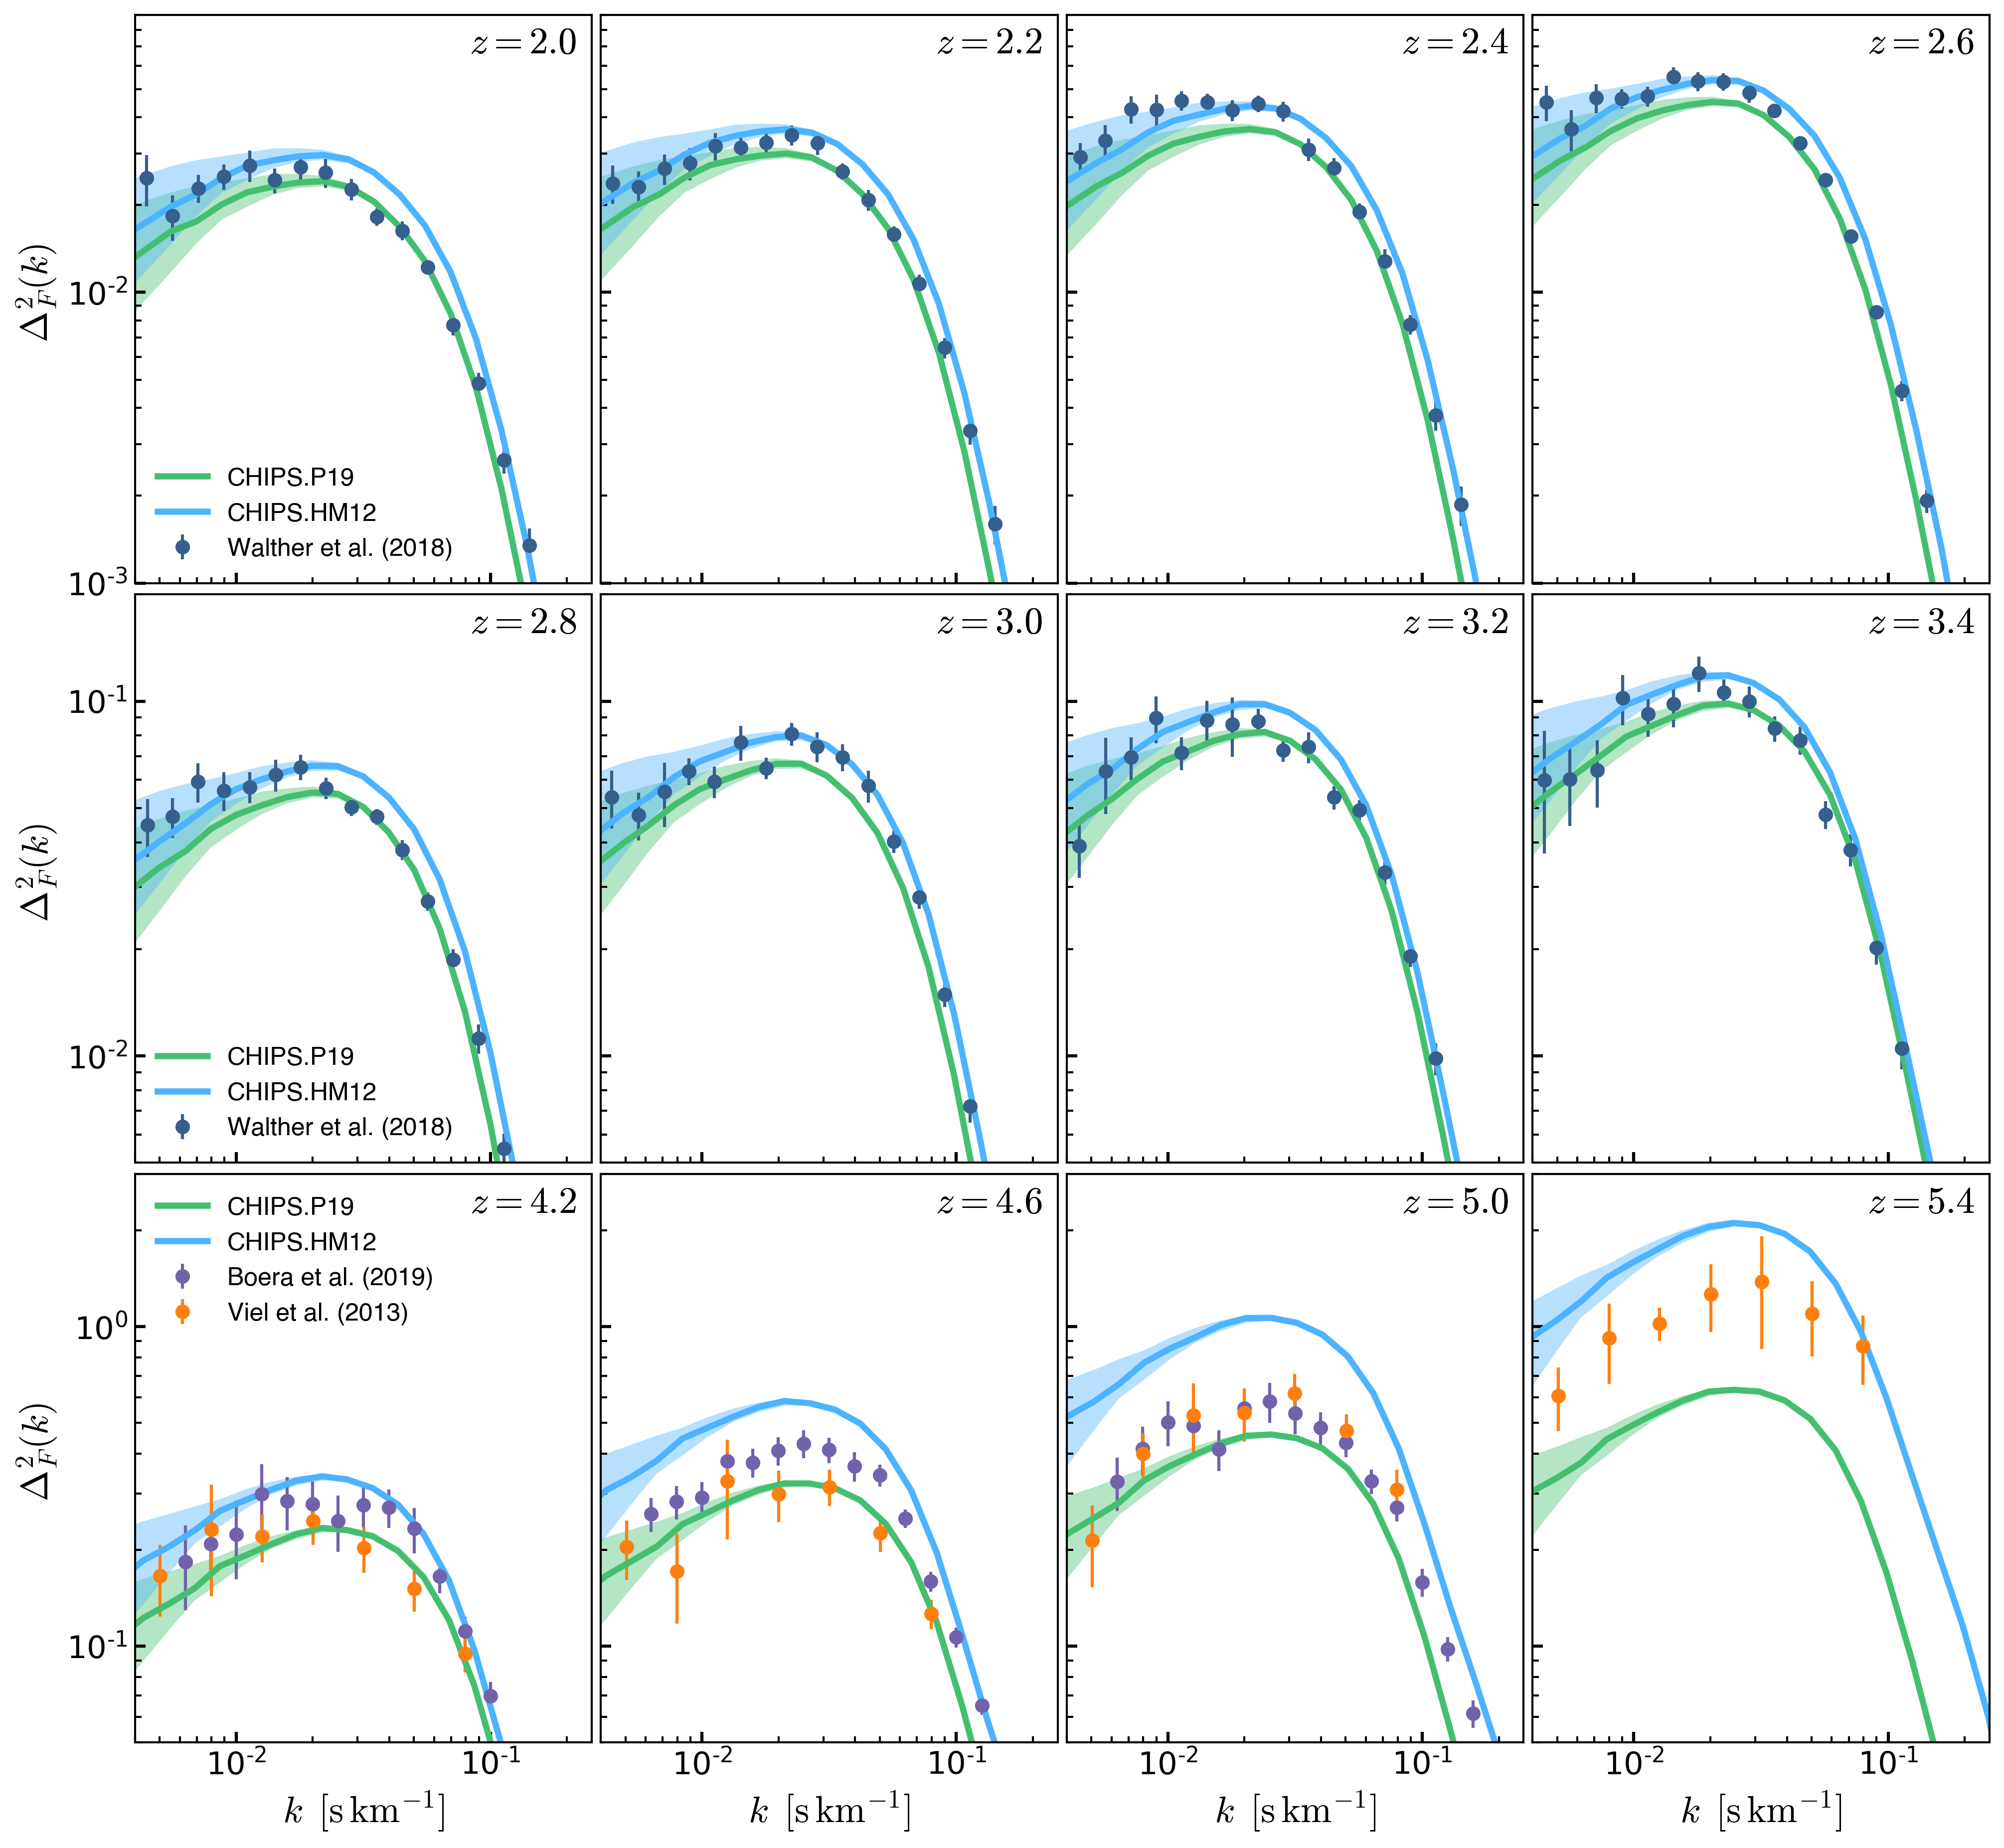
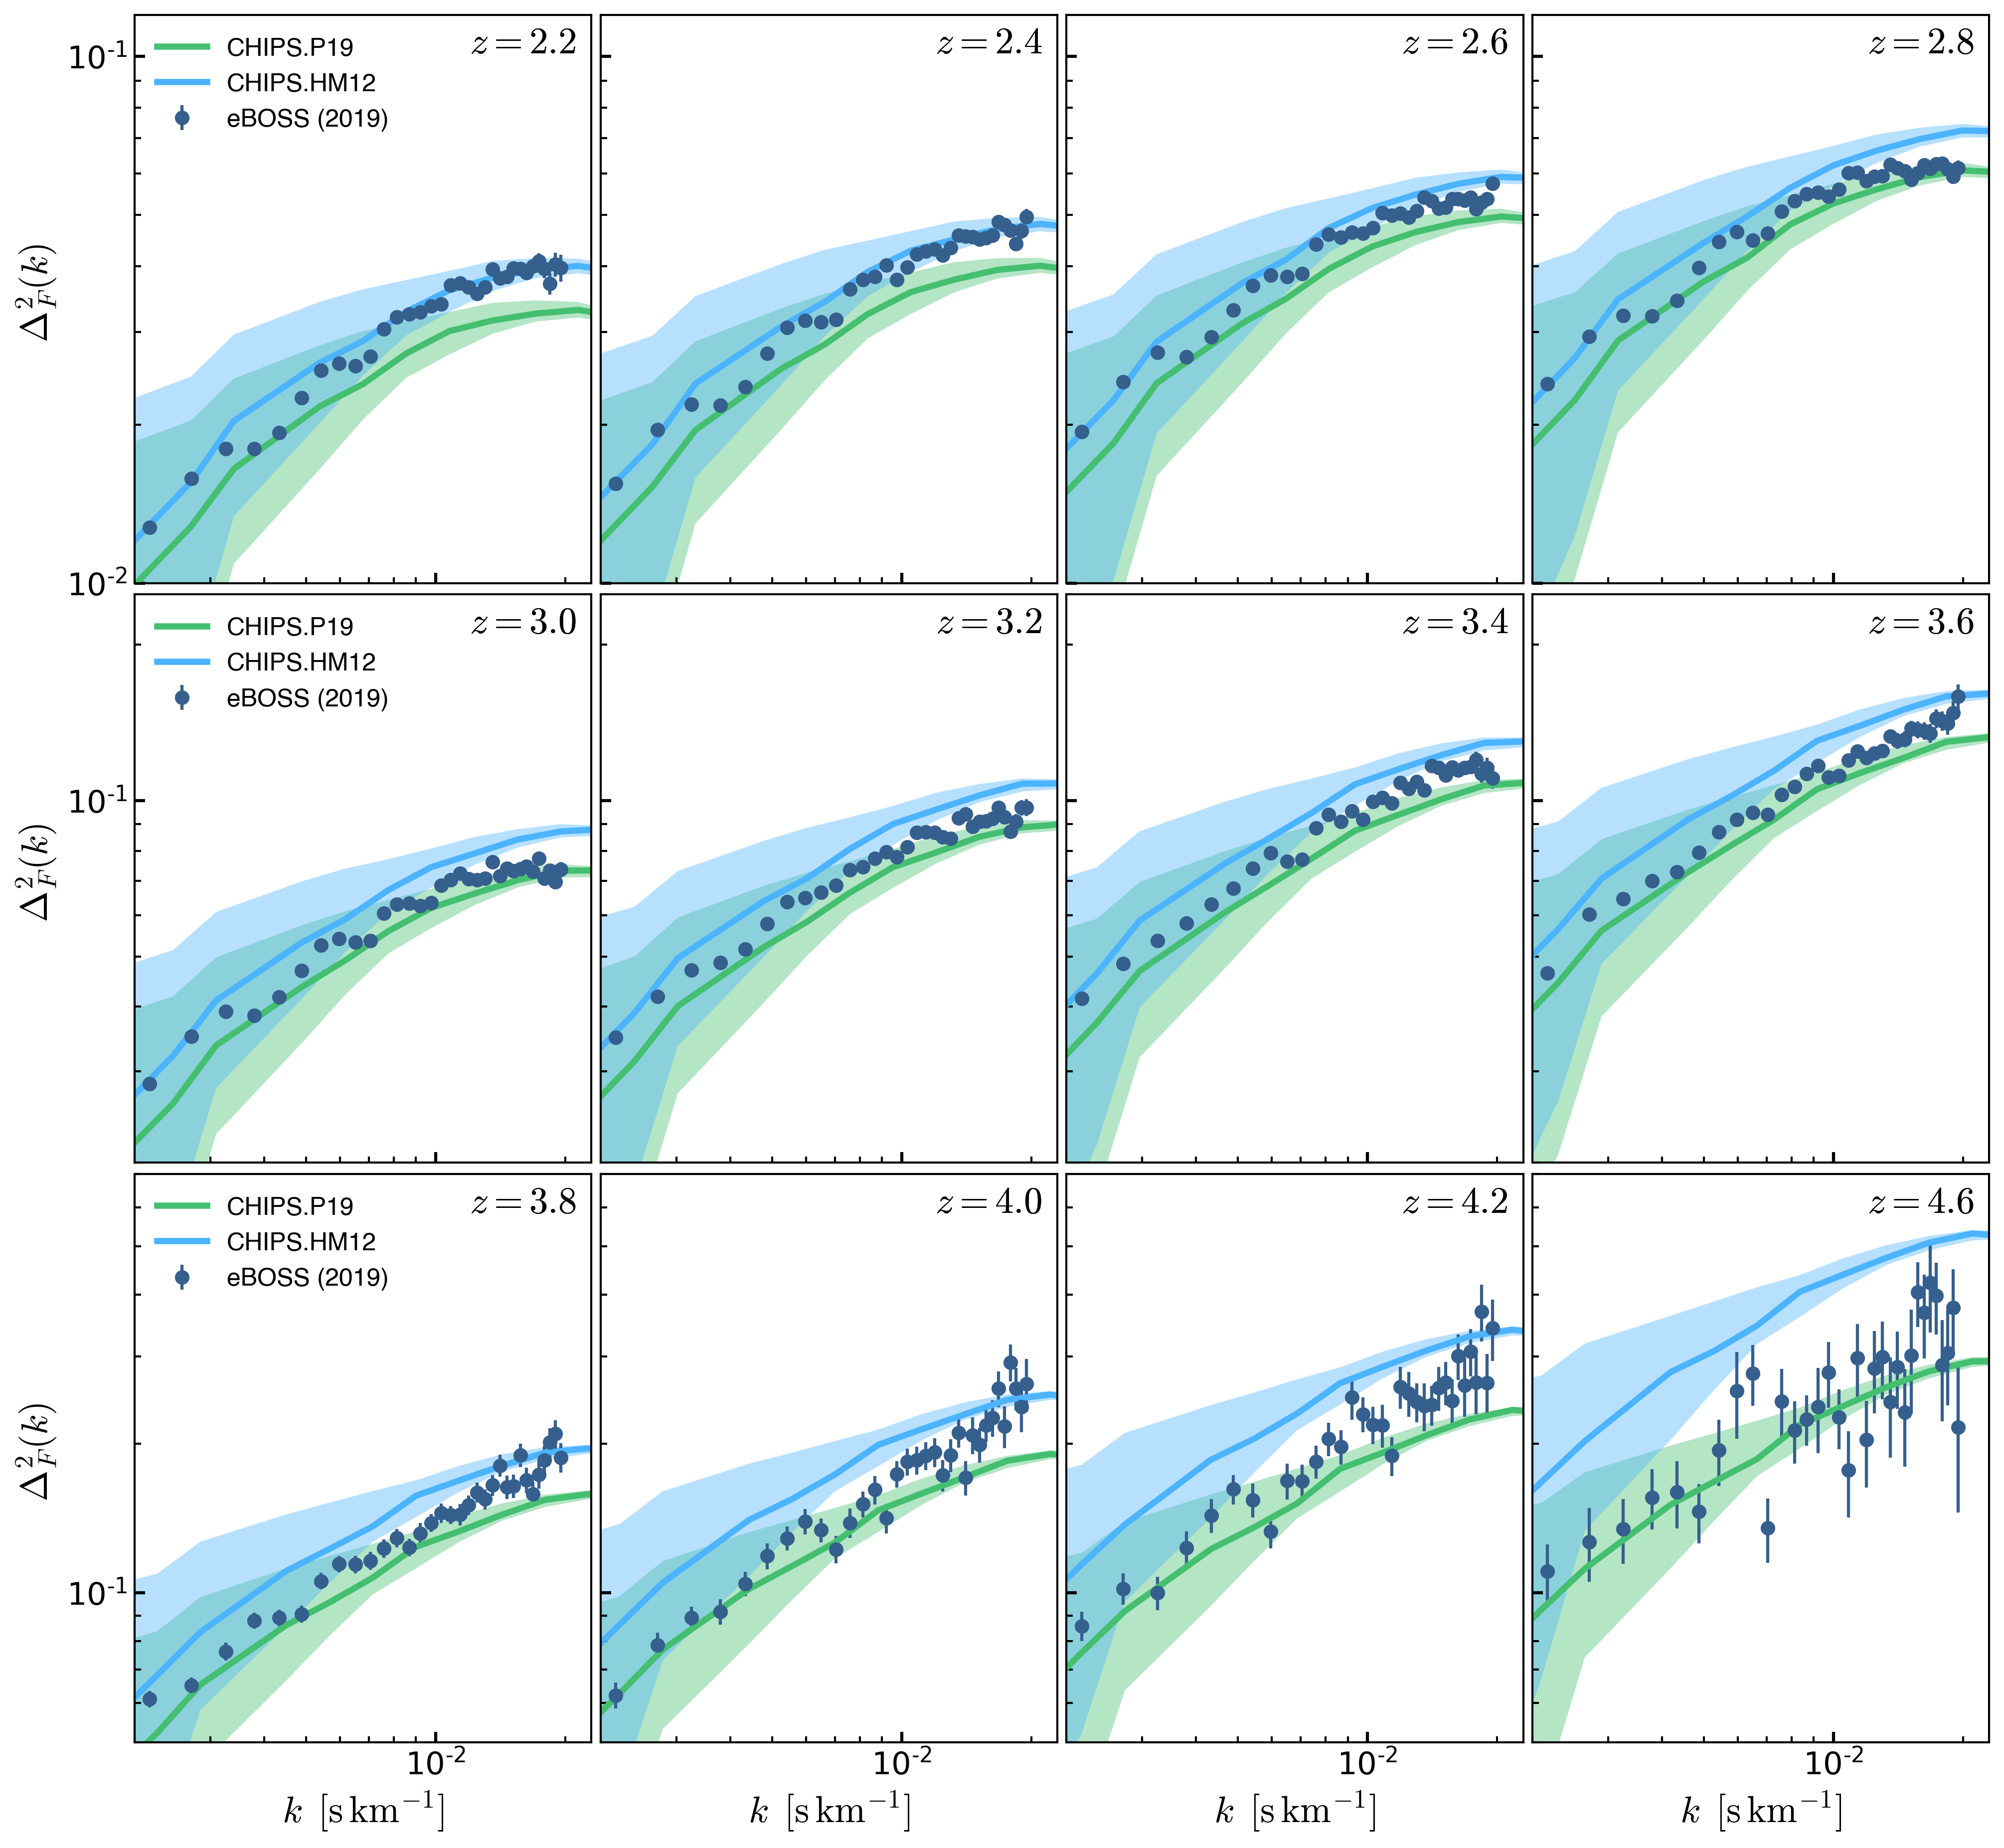
Since computing the \(P(k)\) for all \(2048^2\) skewers is very expensive, I’m going to take the distributions of \(P(k)\) evaluated from 60000 skewers and divide the standard deviation by \(\sqrt{N_{ind}}\). These new calculation for the uncertainty bars in \(P(k)\) are shown below: