Simplified Model of the Temperature of the IGM
The temperature evolution of the IGM can be modeled by integrating the following equation:
\[\frac{d T}{d t}=-2 H T+\frac{2 T}{3 \Delta} \frac{d \Delta}{d t}+\frac{2}{3 k_{B} n_{t o t}} \frac{d Q}{d t}\]where the first term corresponds to the adiabatic cooling due to the expansion of the universe, the second term accounts for the heating due to gravitationally driven compression of the gas (this term has little impact and is ignored), and the last term adds all the heating and cooling rates which are expanded below:
\[\frac{d Q}{d t}=\sum_{X} \frac{d Q_{\gamma, X} } {d t}+\frac{d Q_{C o m p t o n}}{d t}+\sum_{i} \sum_{X} R_{i, X} n_{e} n_{X}\]here the first term is the photoheating of species \(X=\{ \mathrm{HI}, \mathrm{HeI}, \mathrm{HeII} \}\) from the ionizing UV background, the second term is the cooling resulting from inverse Compton cooling due to electrons scattering with the CMB radiation. Finally the last term corresponds to the cooling rates due to collisional processes of all ions, cooling processes are listed below:
-
Collisional excitation cooling.
-
Collisional ionization cooling.
-
Recombination cooling.
-
Free-Free emission (Bremsstrahlung)
The cooling and photoheating rates depend on the ionization fractions of H and He, for these reason the ionization states of both elements have to be integrated simultaneously with the temperature. The number density of the chemical species \(X\) follows the following equation:
\[\frac{d n_X}{d t}= -3 H n_X + \Gamma_{\gamma, X} n_X + \Gamma_{e,X} n_e n_X + \alpha_X n_e n_X\]where the first term corresponds to the expansion of the universe, the second and third terms account for photoionization from the UV background and collisional ionization with free electrons and the last term corresponds to recombination of ions.
Figure below show the evolution of the temperature at mean density \(T_0\) resulting from integrating the model using the Puchwein et al. 2019 rates compared to the results of a high resolution simulation using the same photoionization and photoheating rates.
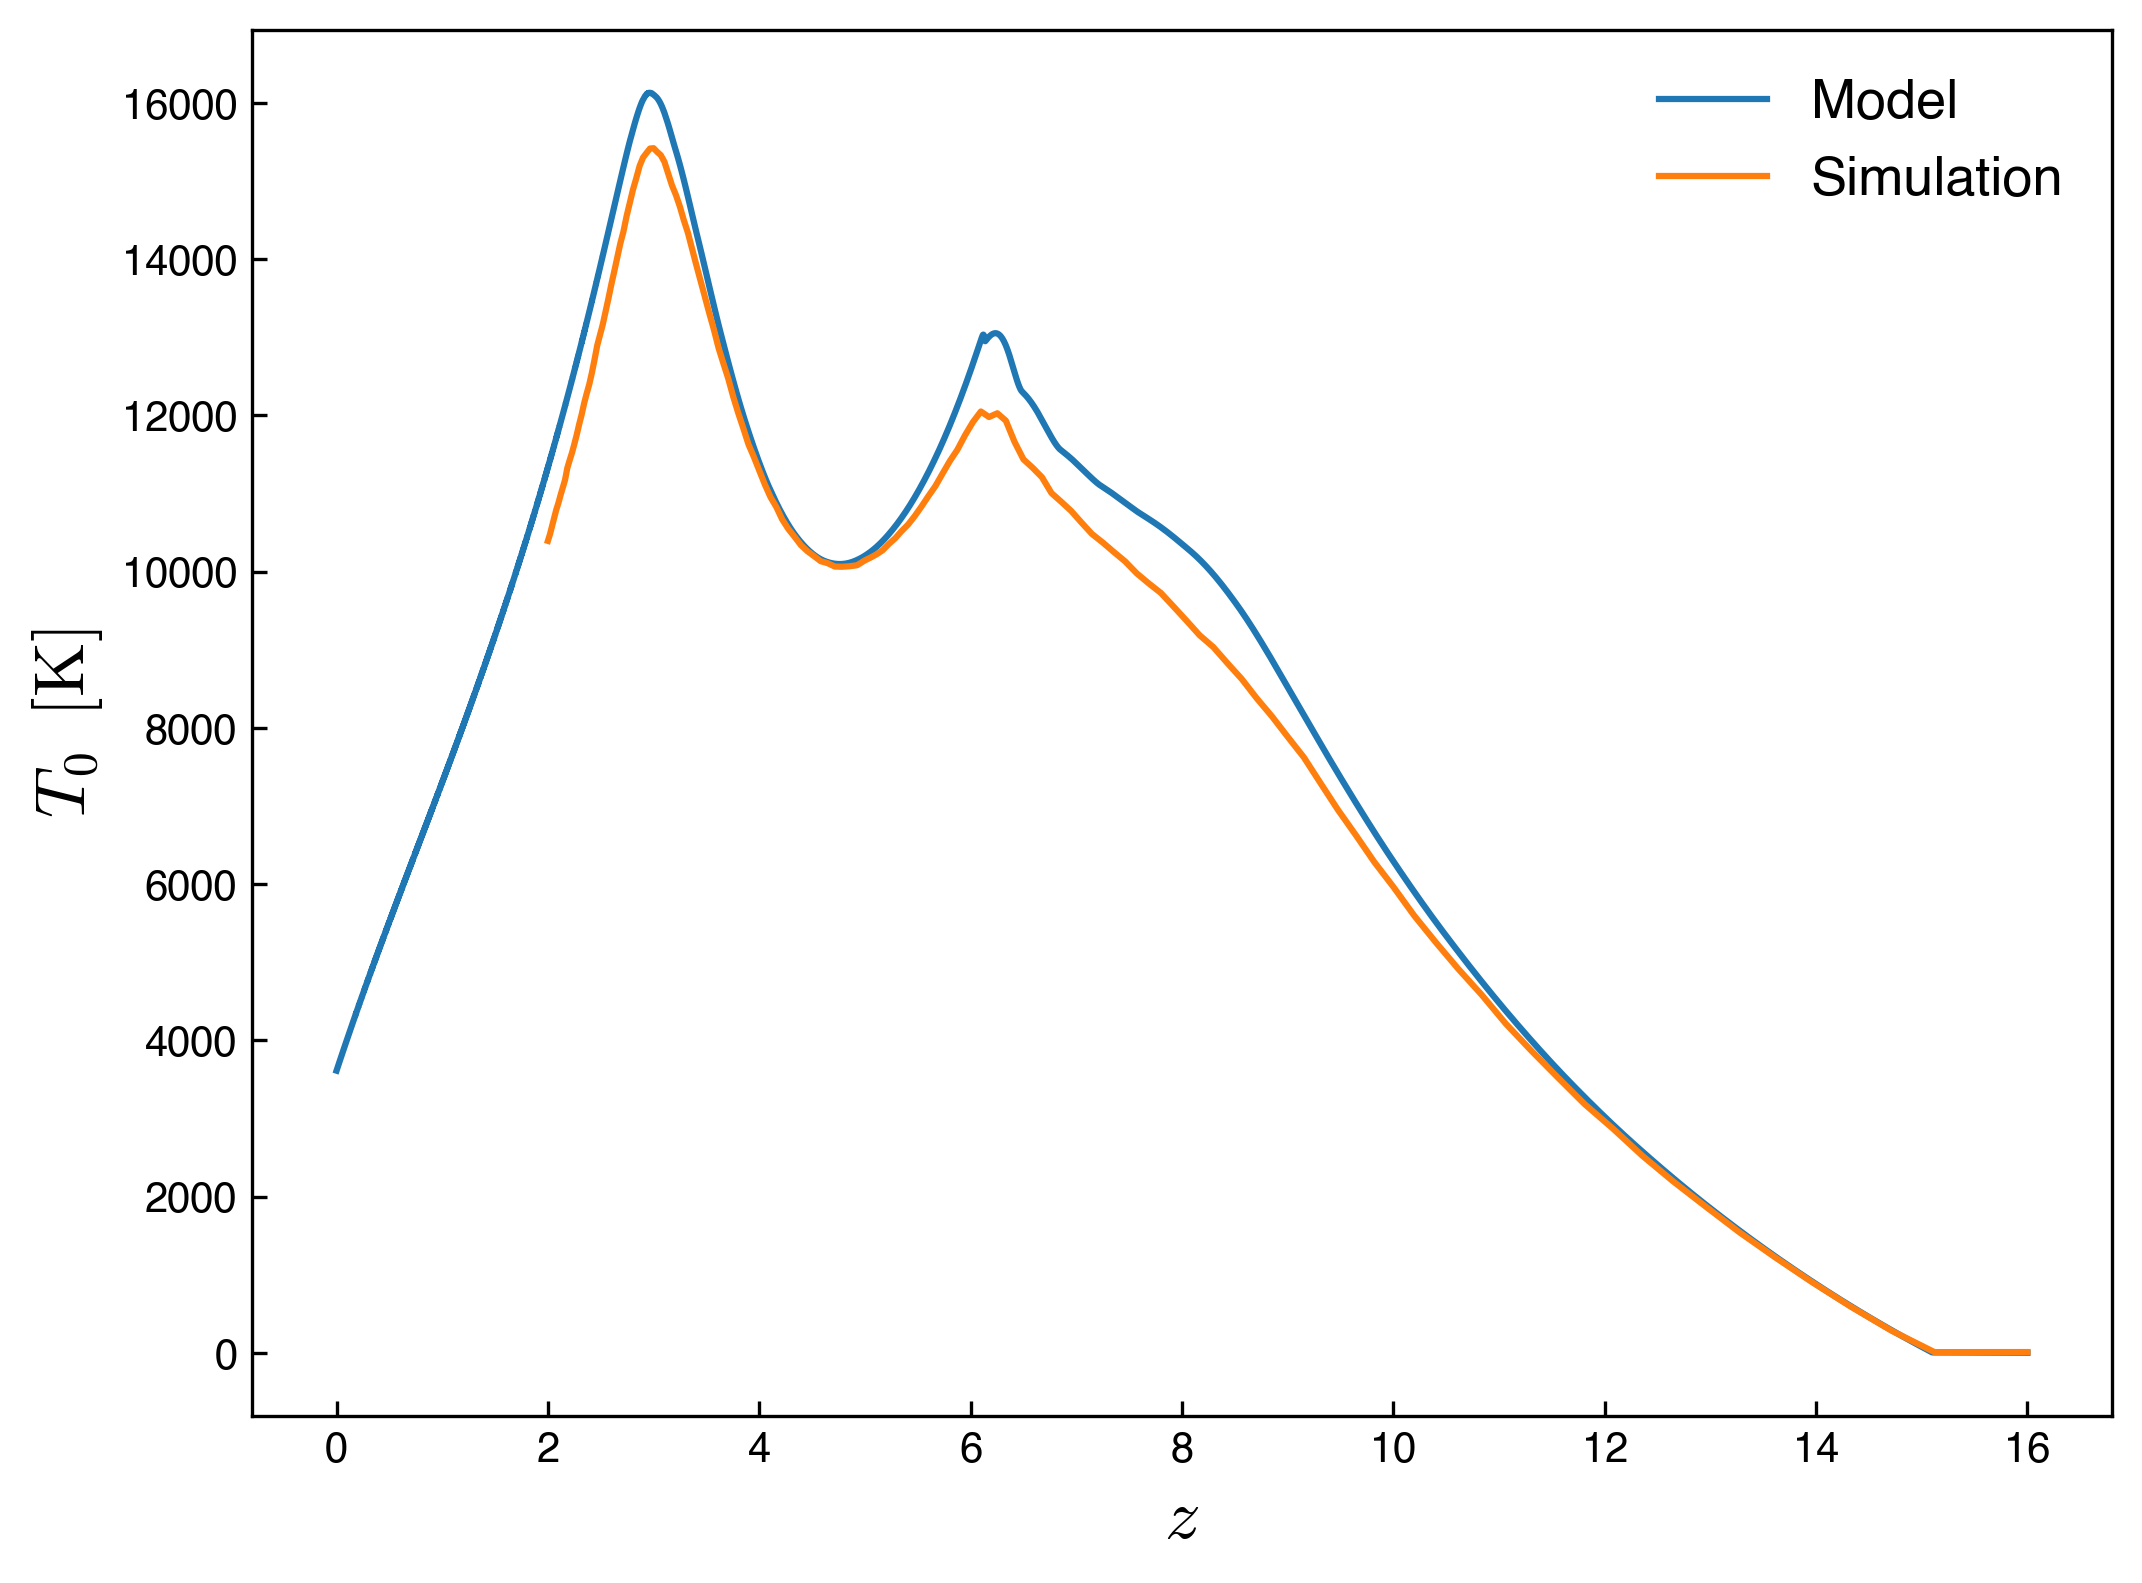
The results from the simplified model are similar to the simulation, the differences could result from differences in the cooling rates used in the model and in the simulation.
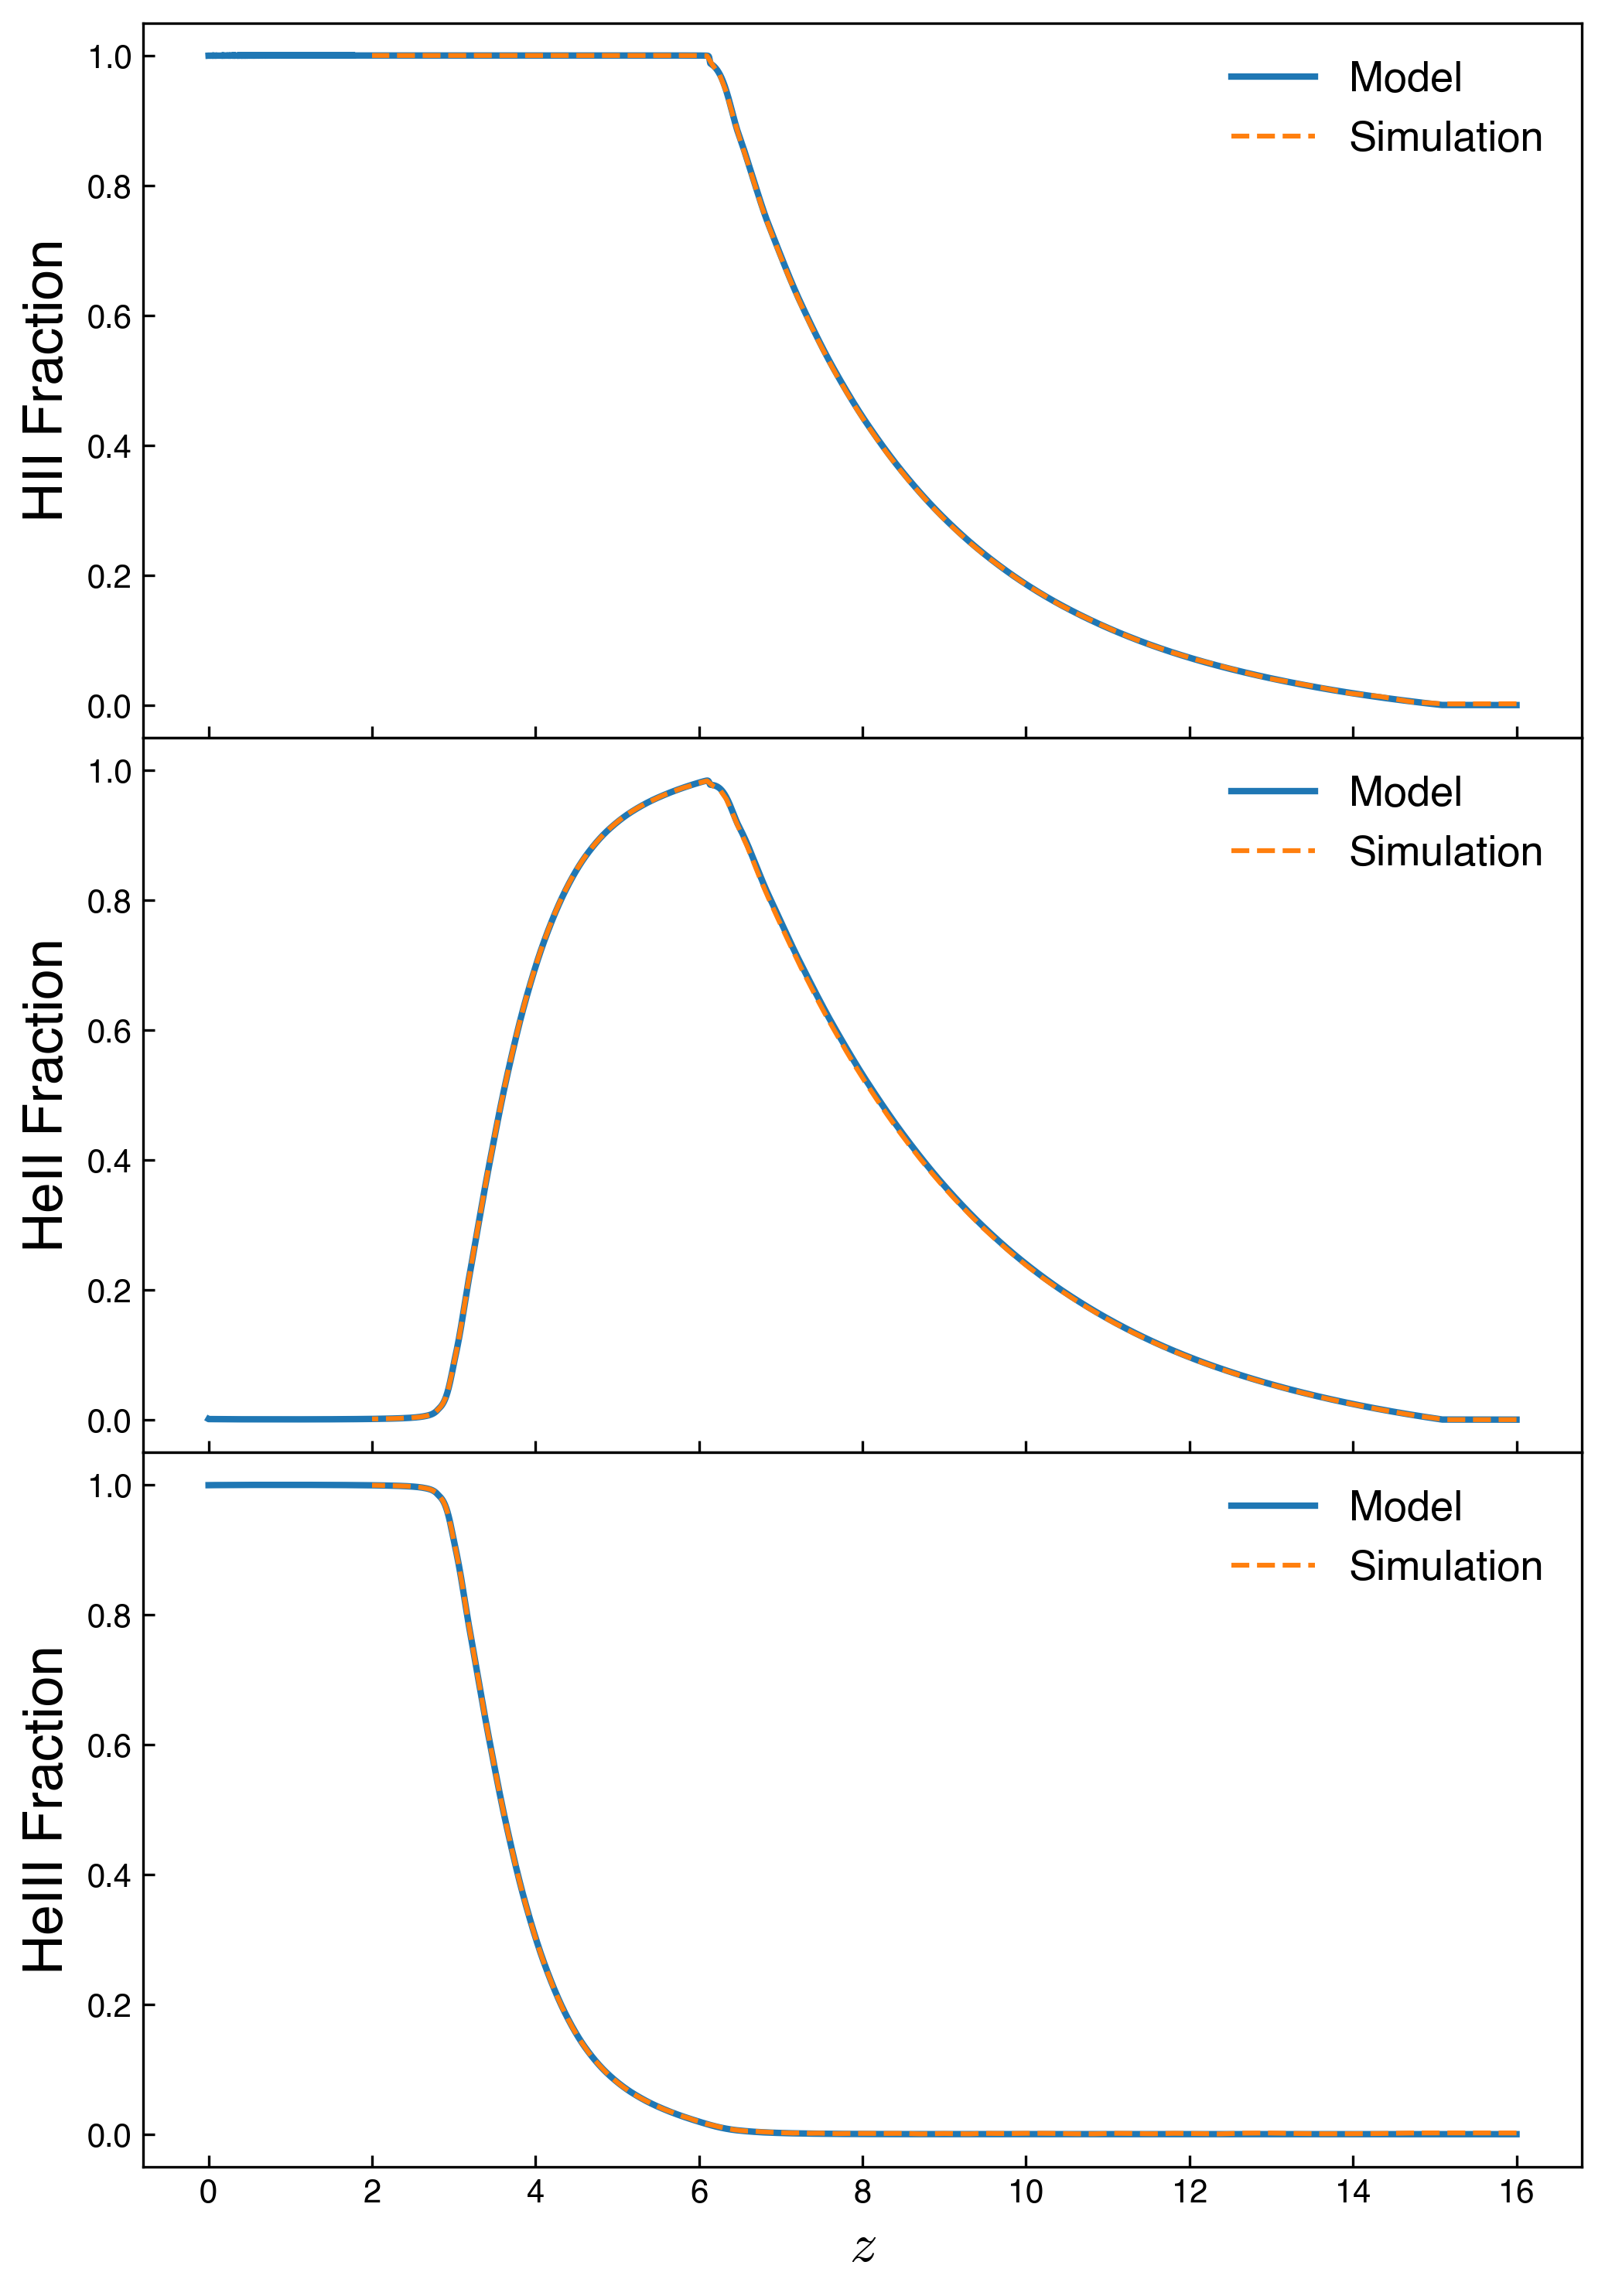
The figure below compares the ionization fractions, the results from the simplified model are in agreement with the simulation.
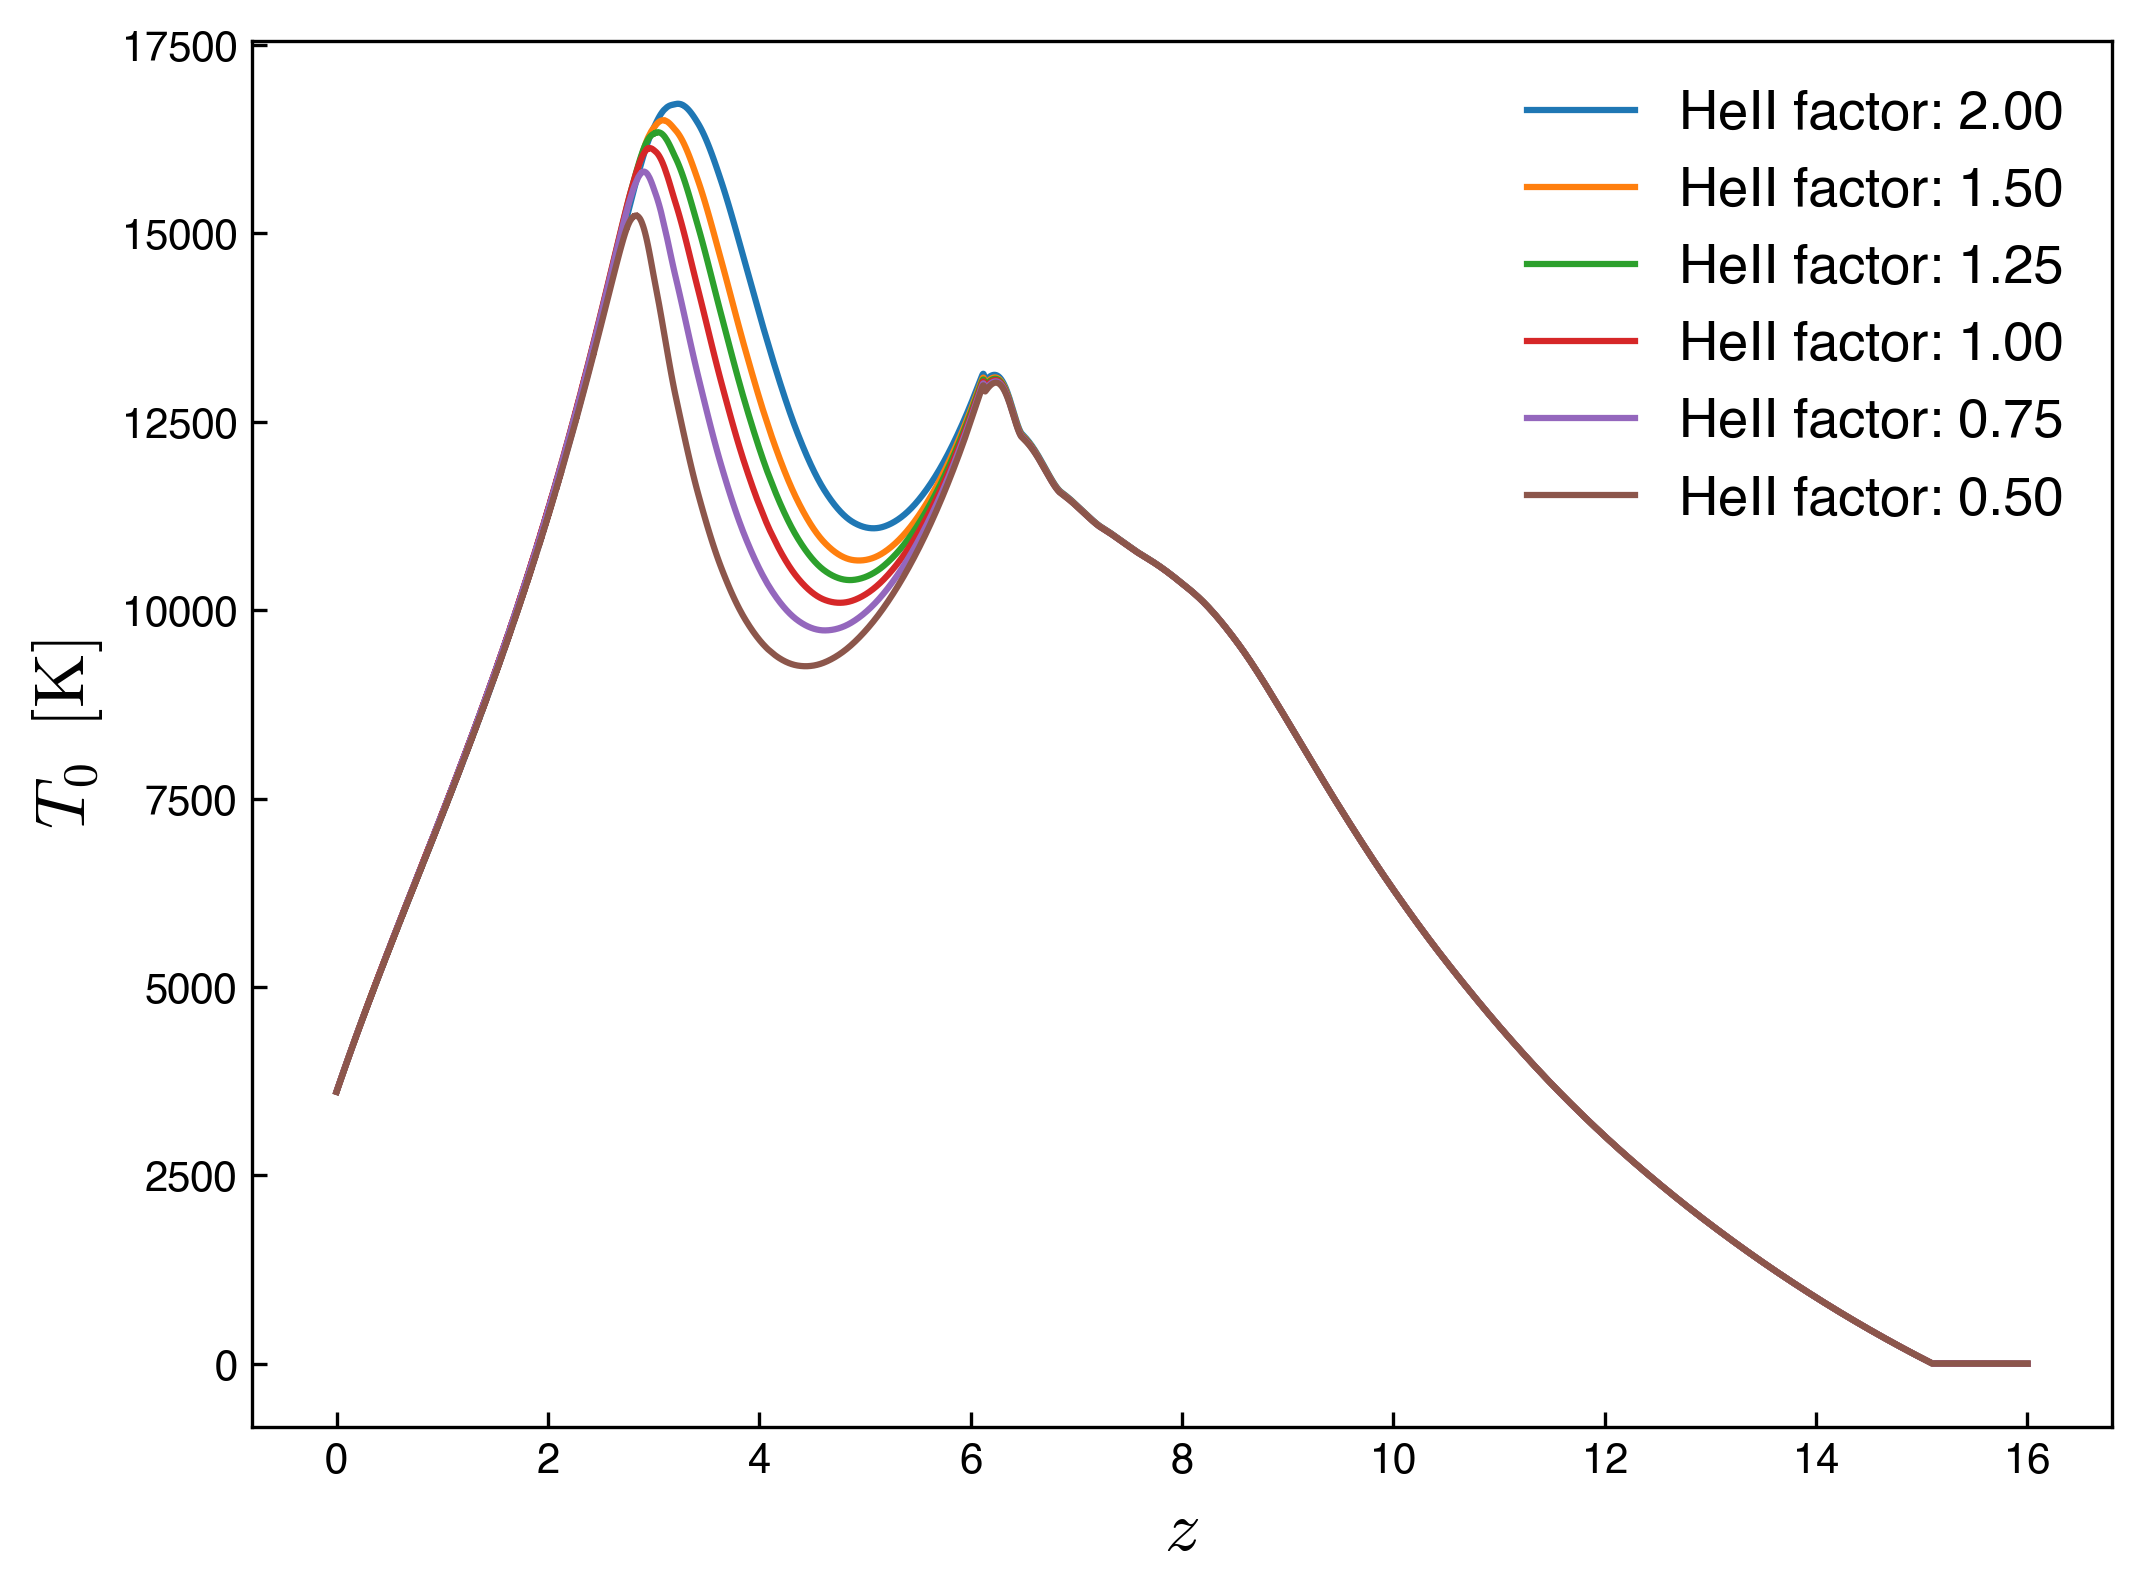
Rescaling the HeII photoionization and photoheating rates by HeII_factor results in different trajectories for HeII reionization but they all converge to the same evolution after \(z \lesssim 3\) as shown if the figure below