Peculiar Velocity Analysis
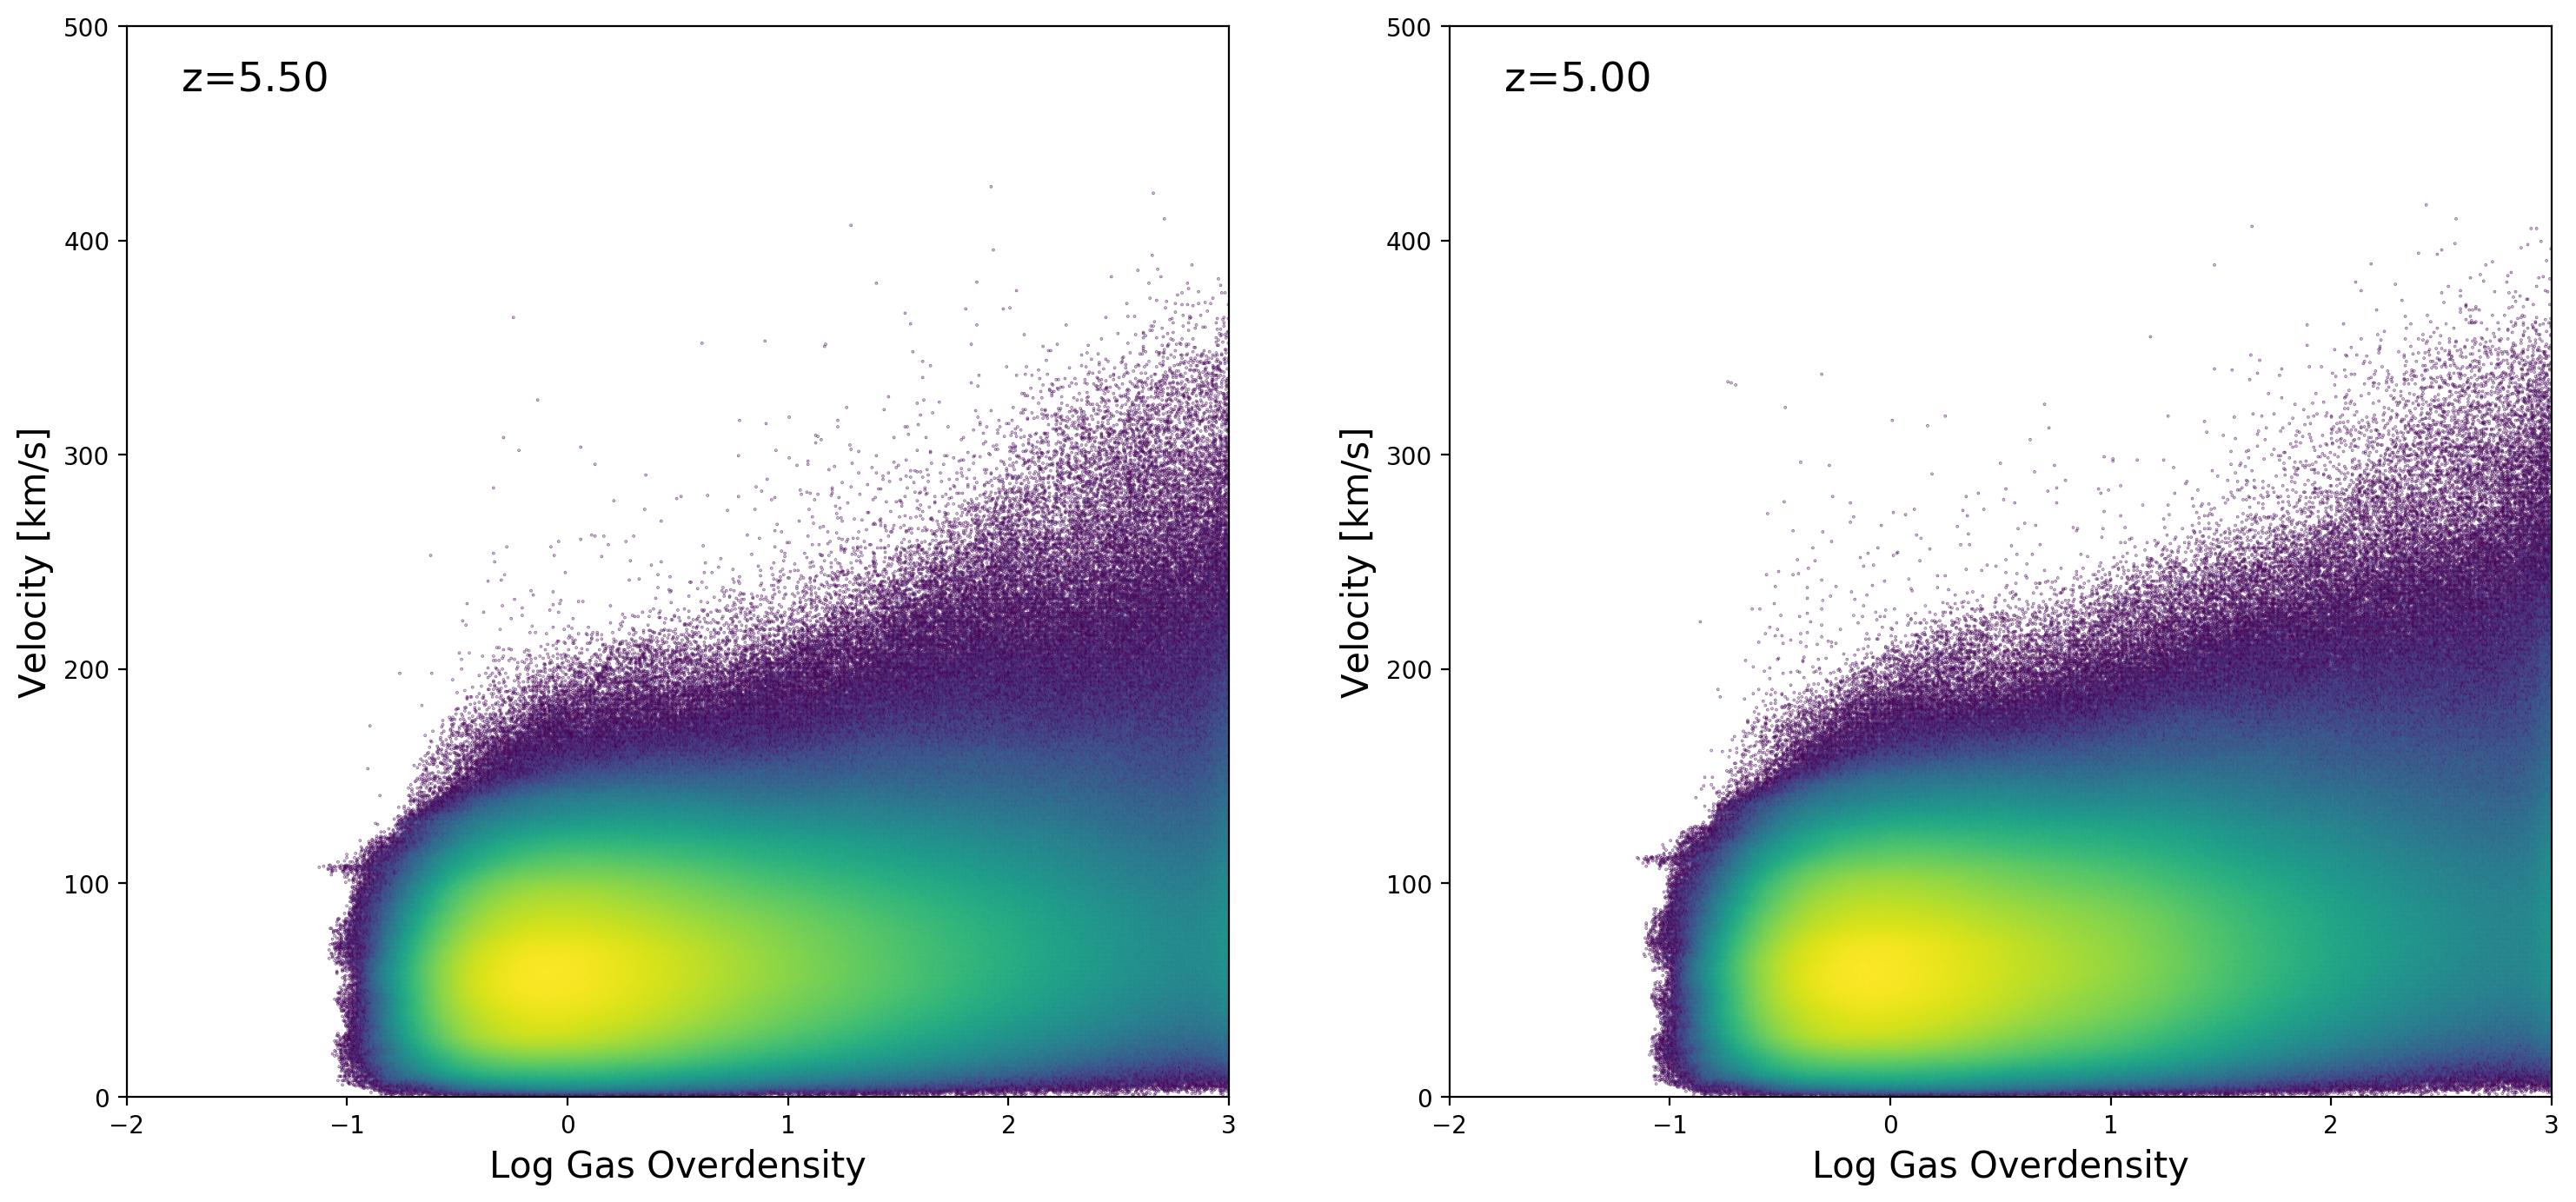
Here I show the Overdensity-Velocity distribution measured from the SPH particles from Ewalds simulation snapshots:
Without \(\sqrt{a}\) factor
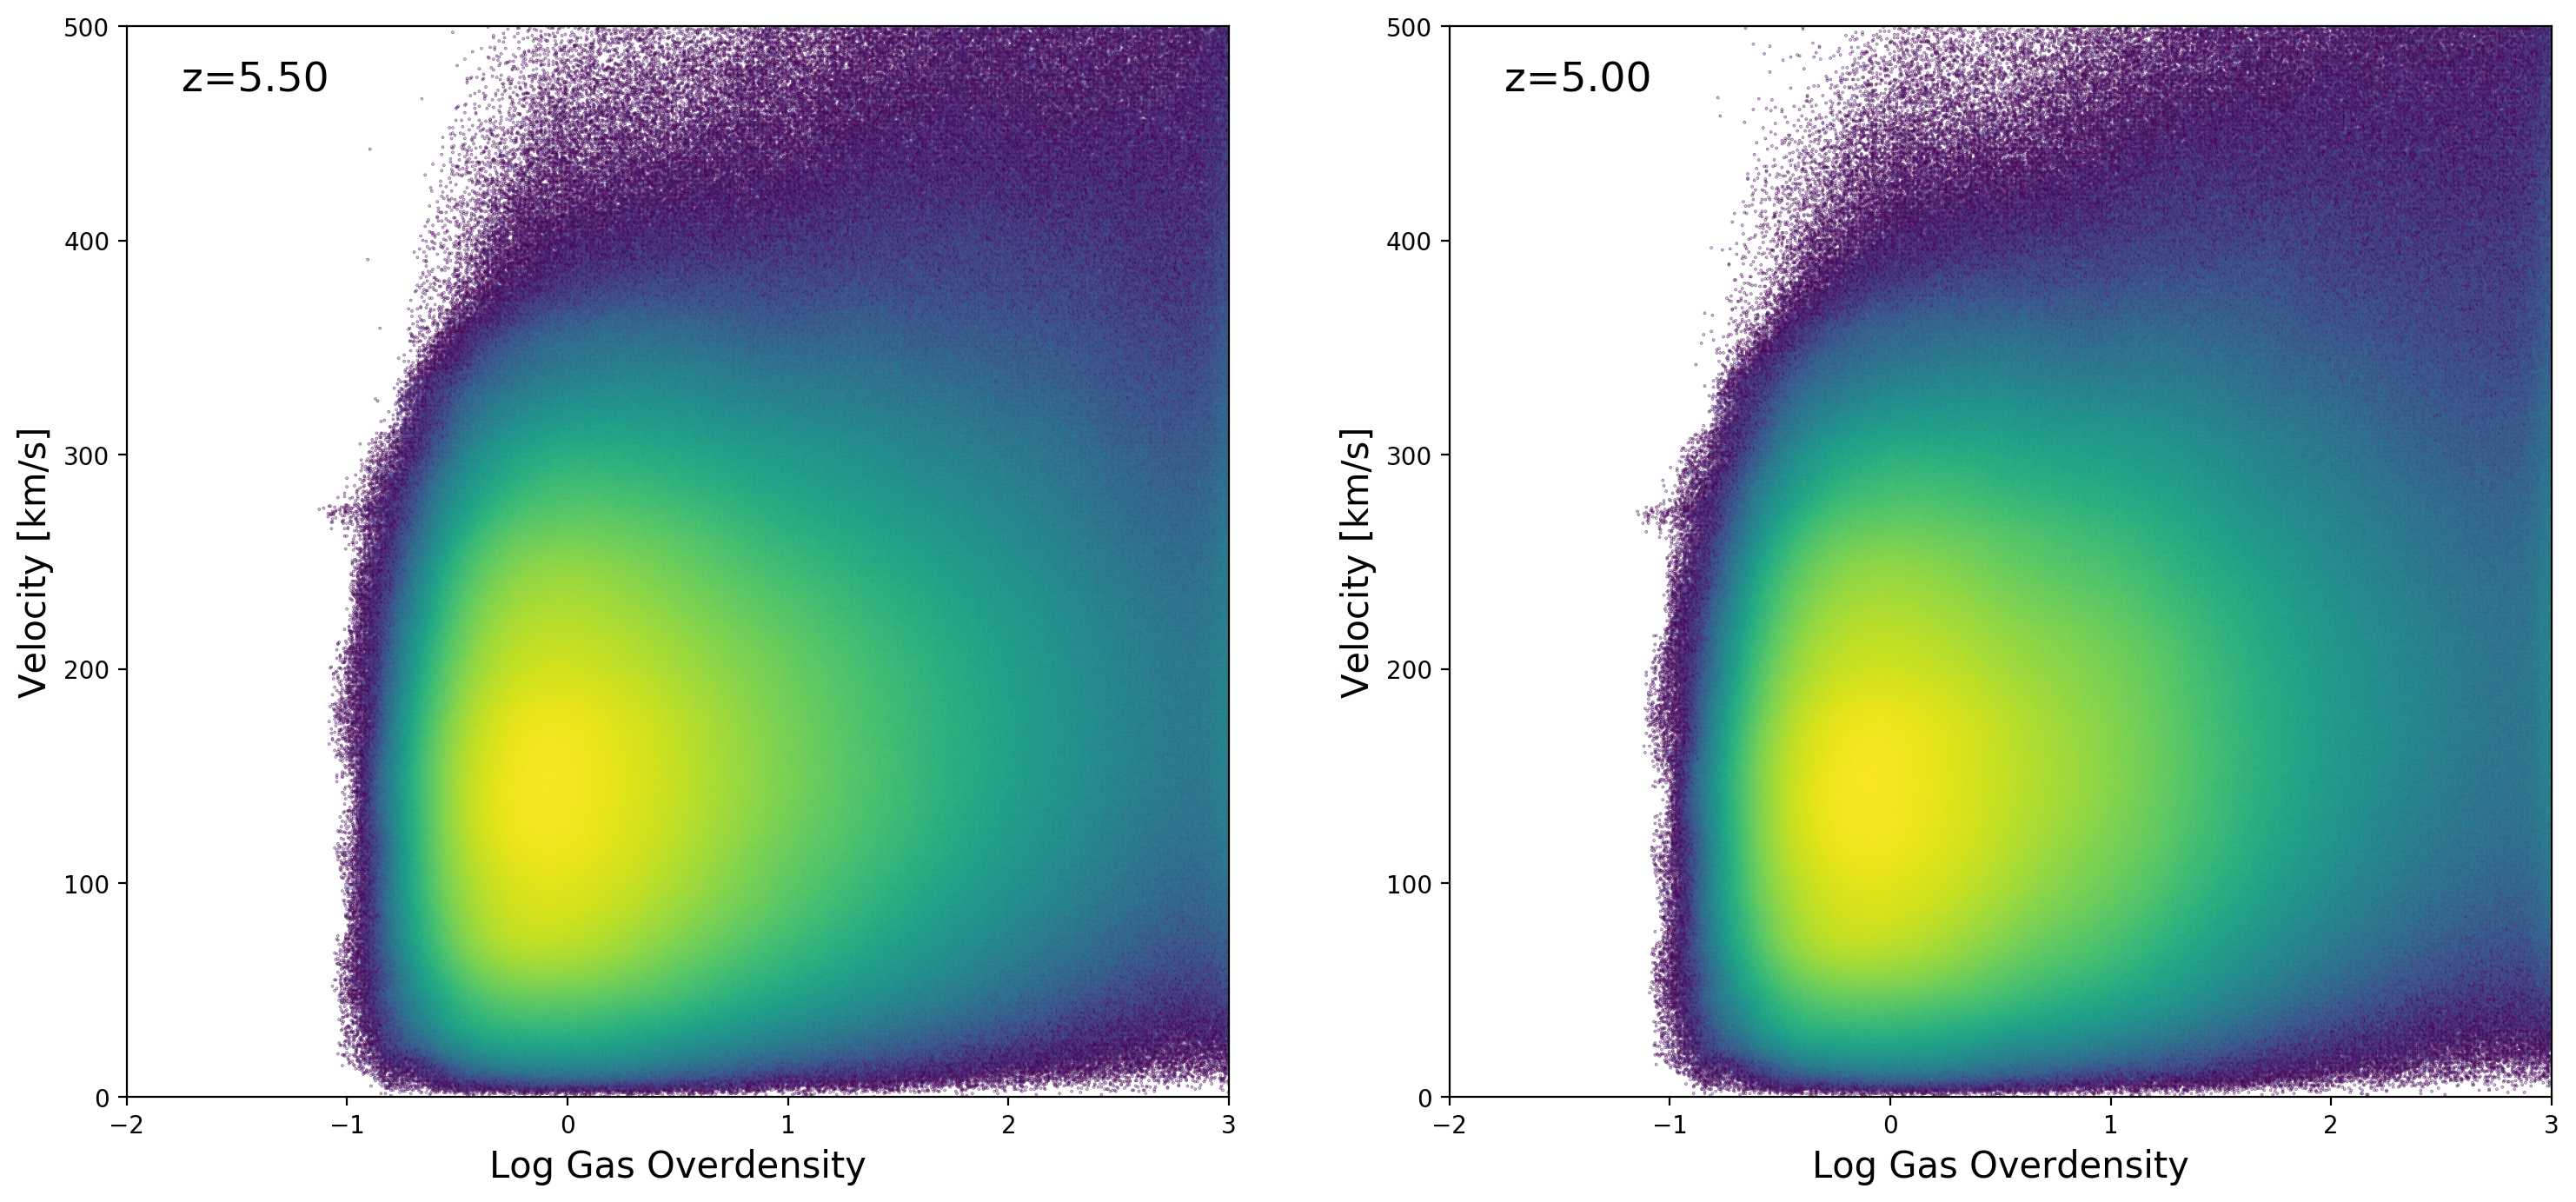
With \(\sqrt{a}\) factor
I ran adiabatic simulations ( without a UVB but I don’t think this will affect significantly the peculiar velocities ) for the same initial conditions on a 50 Mpc/h box and \(256^3\) particles-cells using Cholla, Enzo and Gadget. Below I show the evolution of the Overdensity-Velocity distribution for the 3 simulations as well as the distribution of the DM particles velocities.
Note that I added the \(\sqrt{a}\) factor to the Gadget peculiar velocities when loading them.
For the Gadget analysis, I measure the density and velocity directly from the SPH particles, that is why the distribution is higher for large overdensities when compared to the volume weighted distributions for the grid simulations ( Cholla and Enzo ).
I think that the peculiar velocities on the snapshots provided by Ewald already include the \(\sqrt{a}\) factor, multiplying again by \(\sqrt{a}\) leads to incorrect low peculiar velocities.
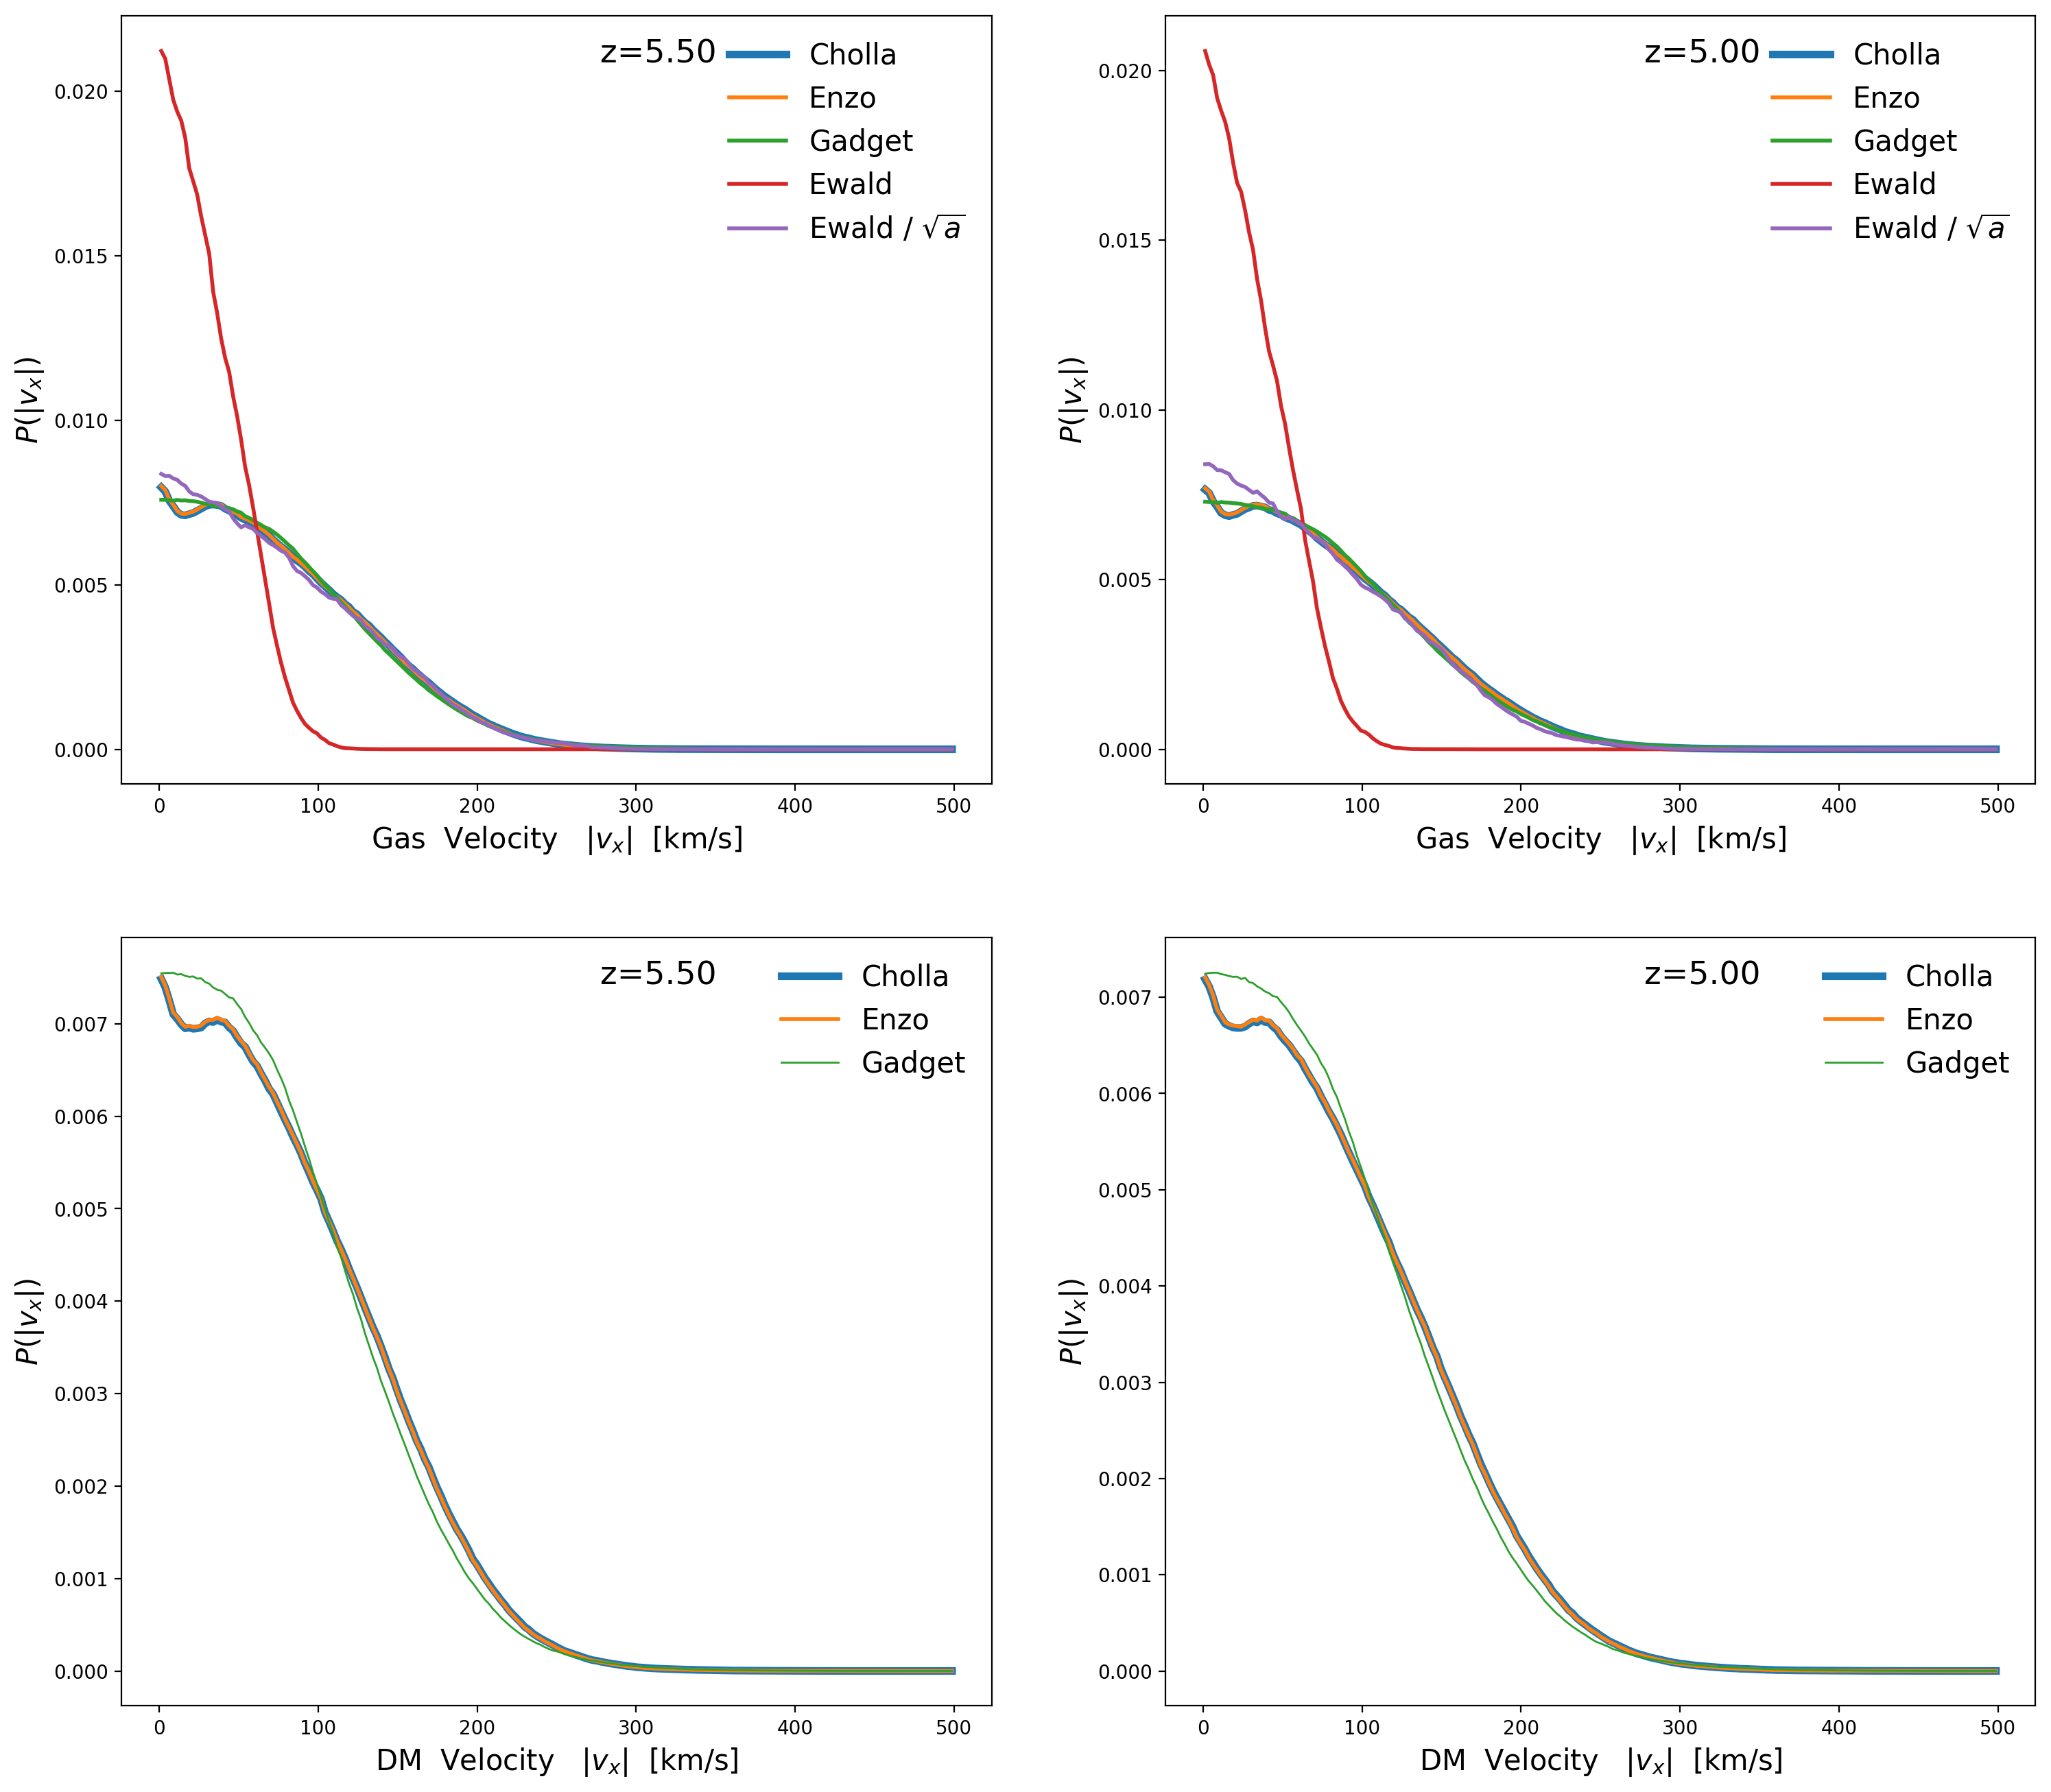
Now I compare the LOS Velocities of the skewers provided by Ewald to the velocities ( in a single axis ) on the 3 simulations that I ran.
Ewald line: LOS velocities from the skewers provided by Ewald
Ewald / \(\sqrt{a}\) line: LOS velocities from the skewers provided by Ewald divided by \(\sqrt{a}\)
When I divide the skewer velocities by a factor of \(\sqrt{a}\) I can reproduce the velocities on the simulations, otherwise the velocities are too low.