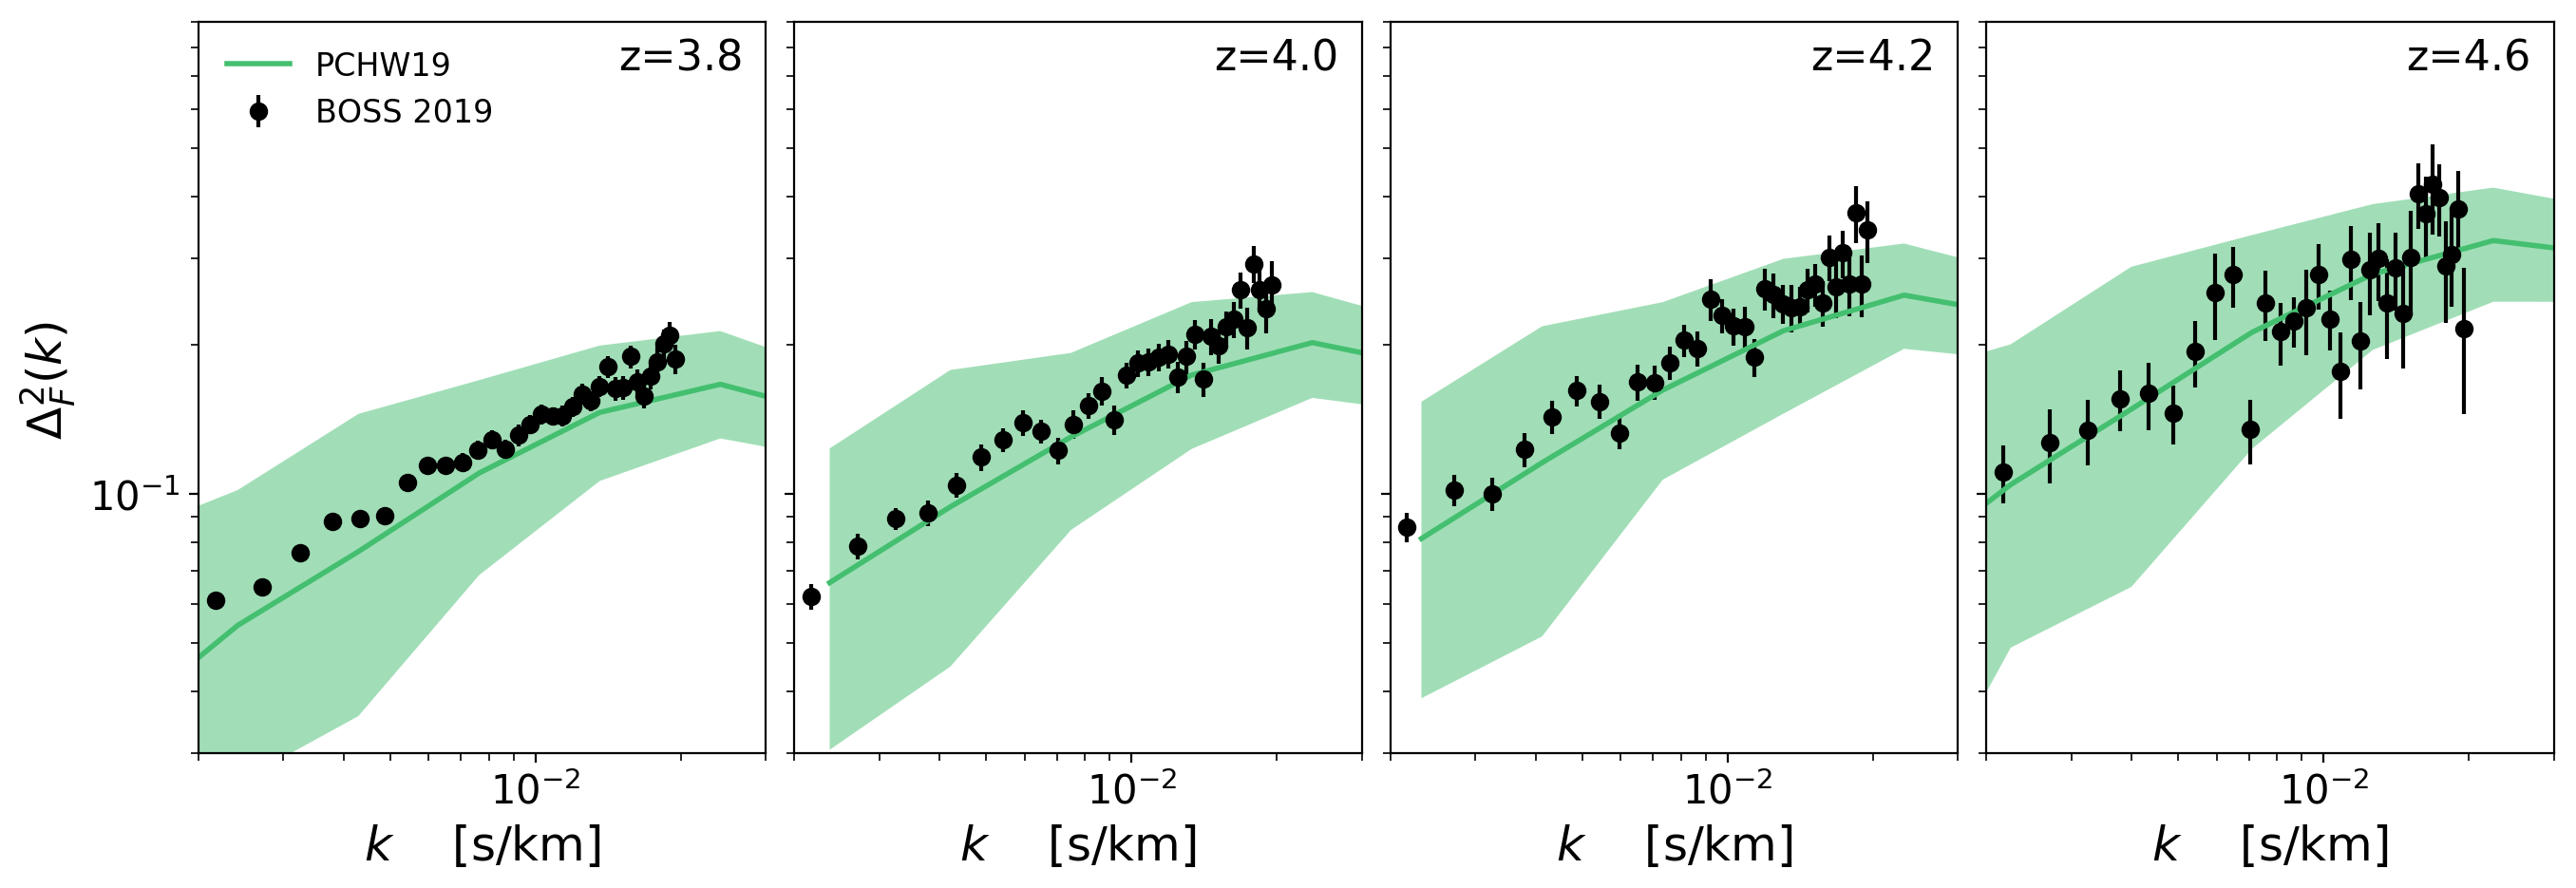
SPH Skewers Direct Comparison Revisited
After adding the \(\sqrt{a}\) factor to the particles velocities., I can reproduce the optical depth of the skewers provided by Ewald. The blue lines are the Skewers that I compute and the orange lines correspond to the LOS data provided by Ewald, differences on the effective optical depth for each skewers are less than 1%
Skewer 1
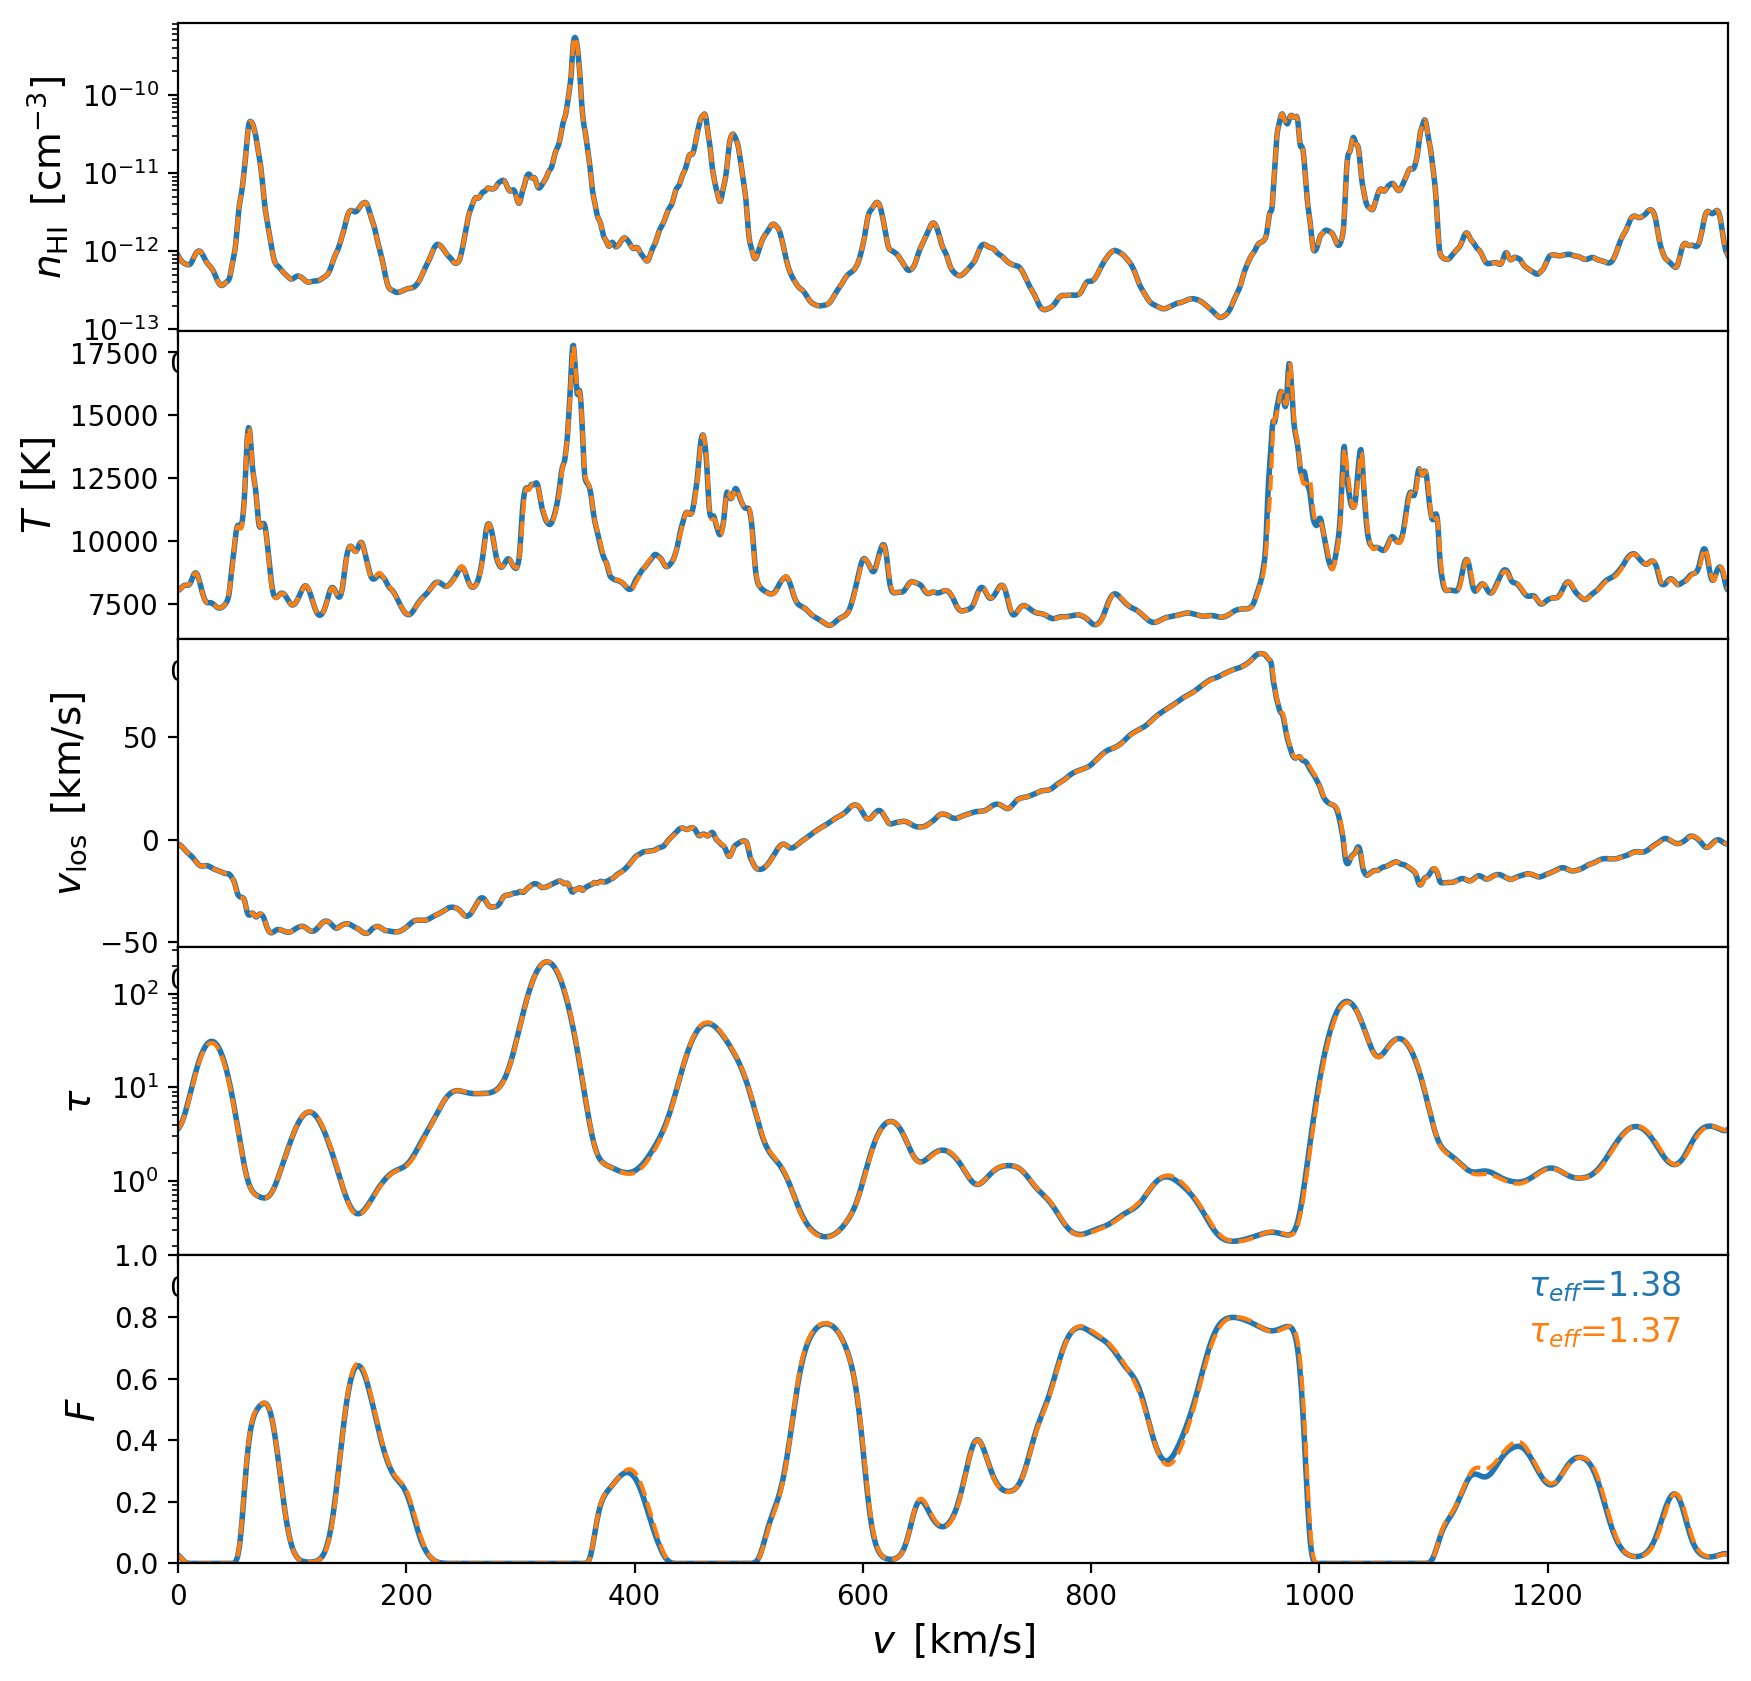
Skewer 2
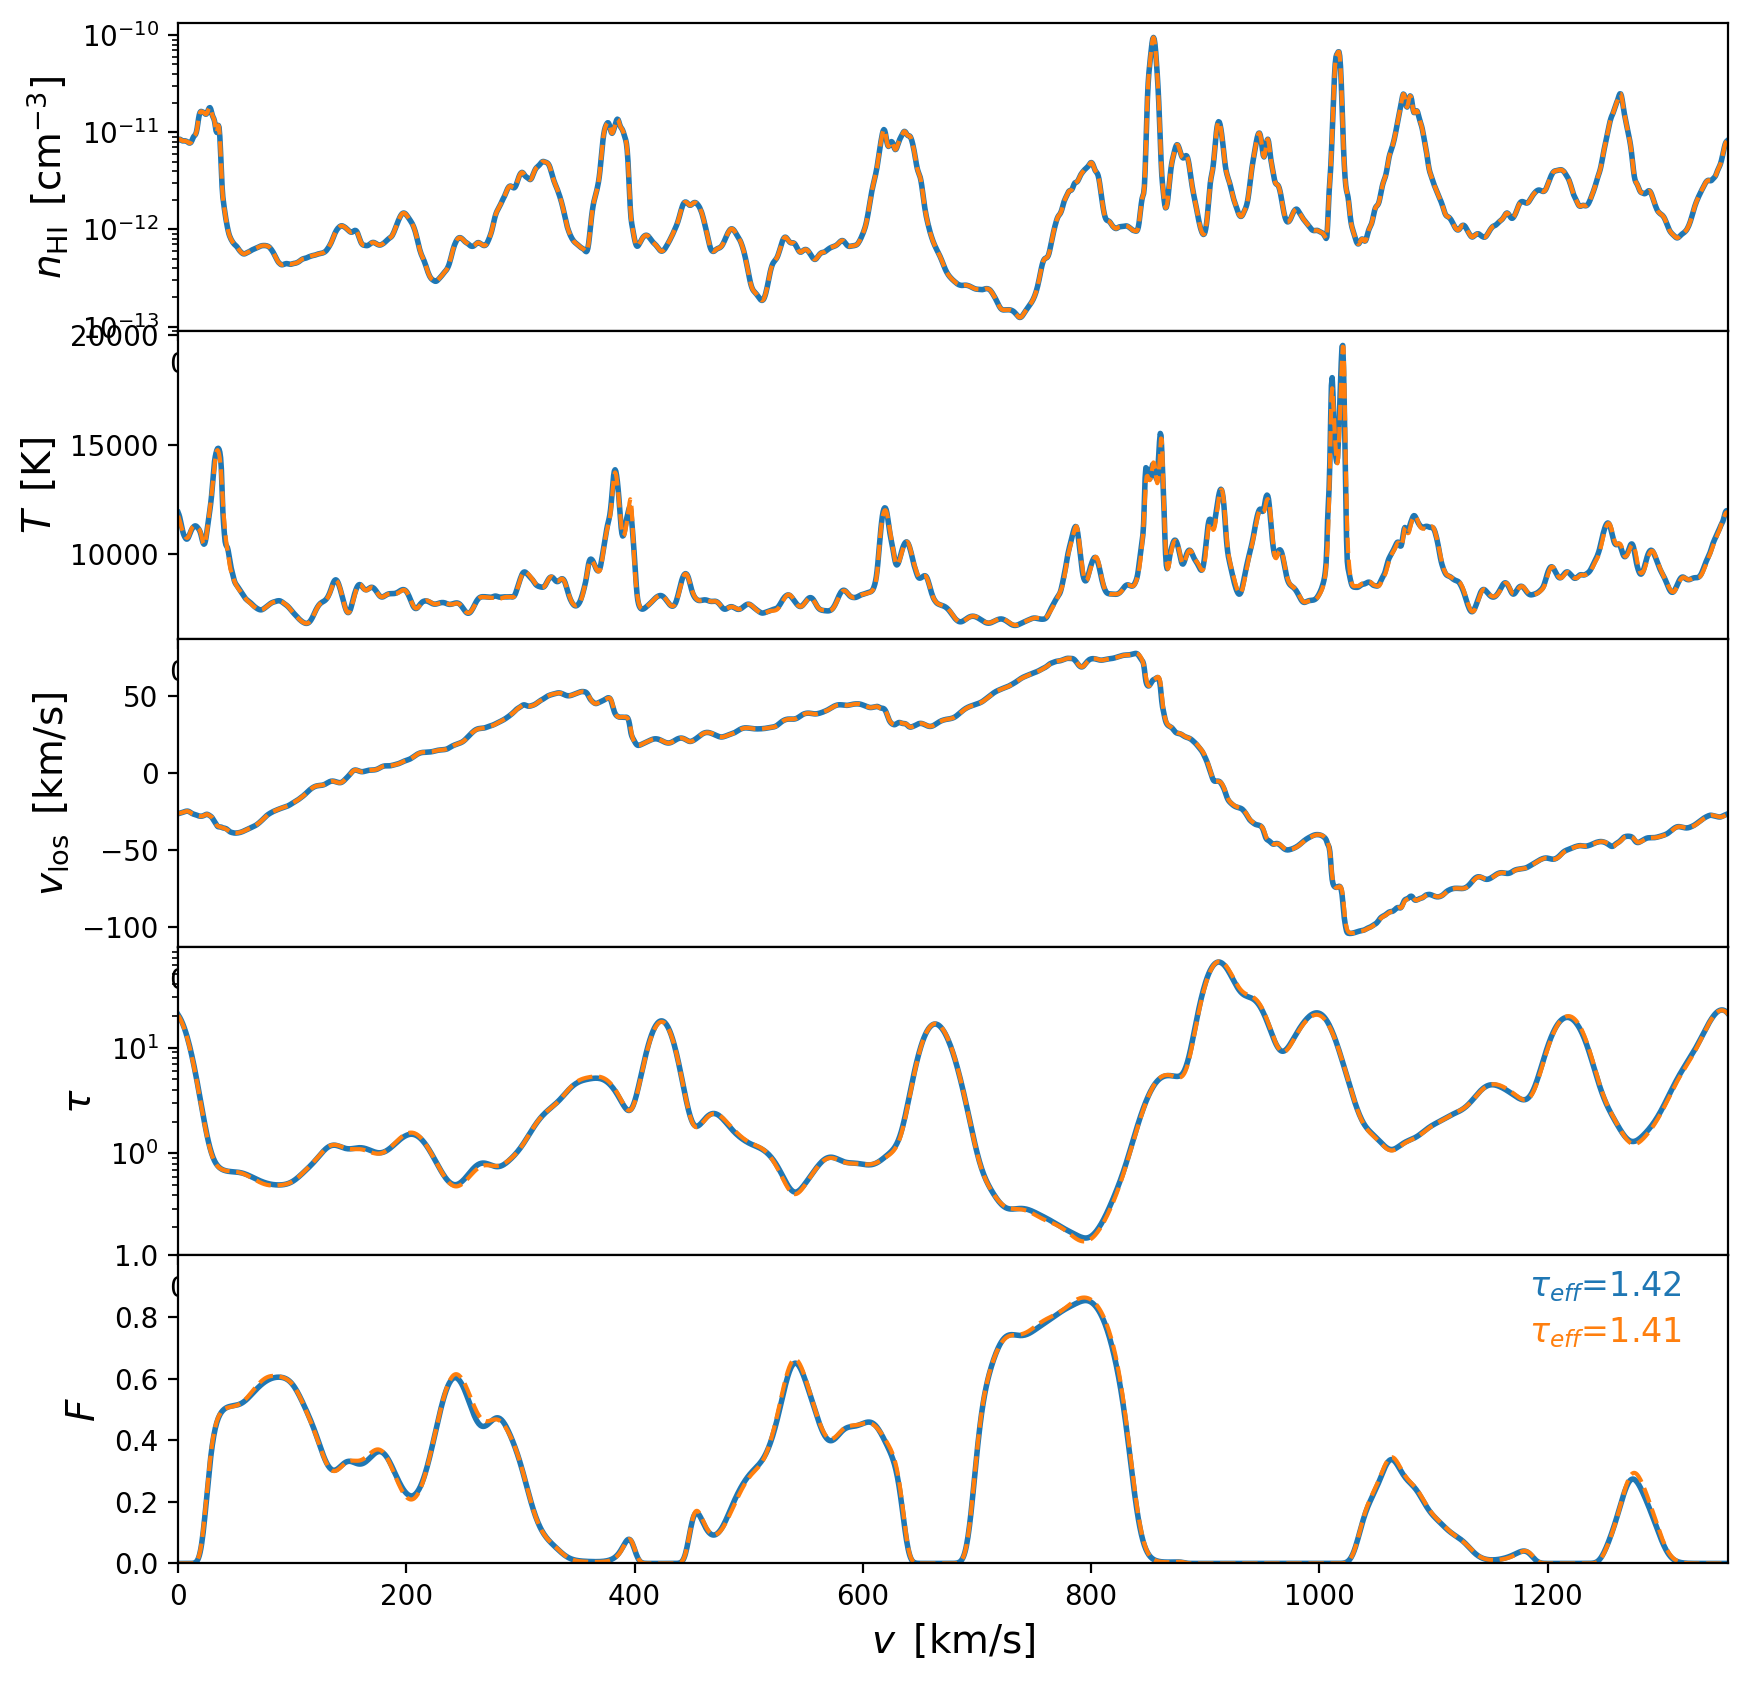
Skewer 3
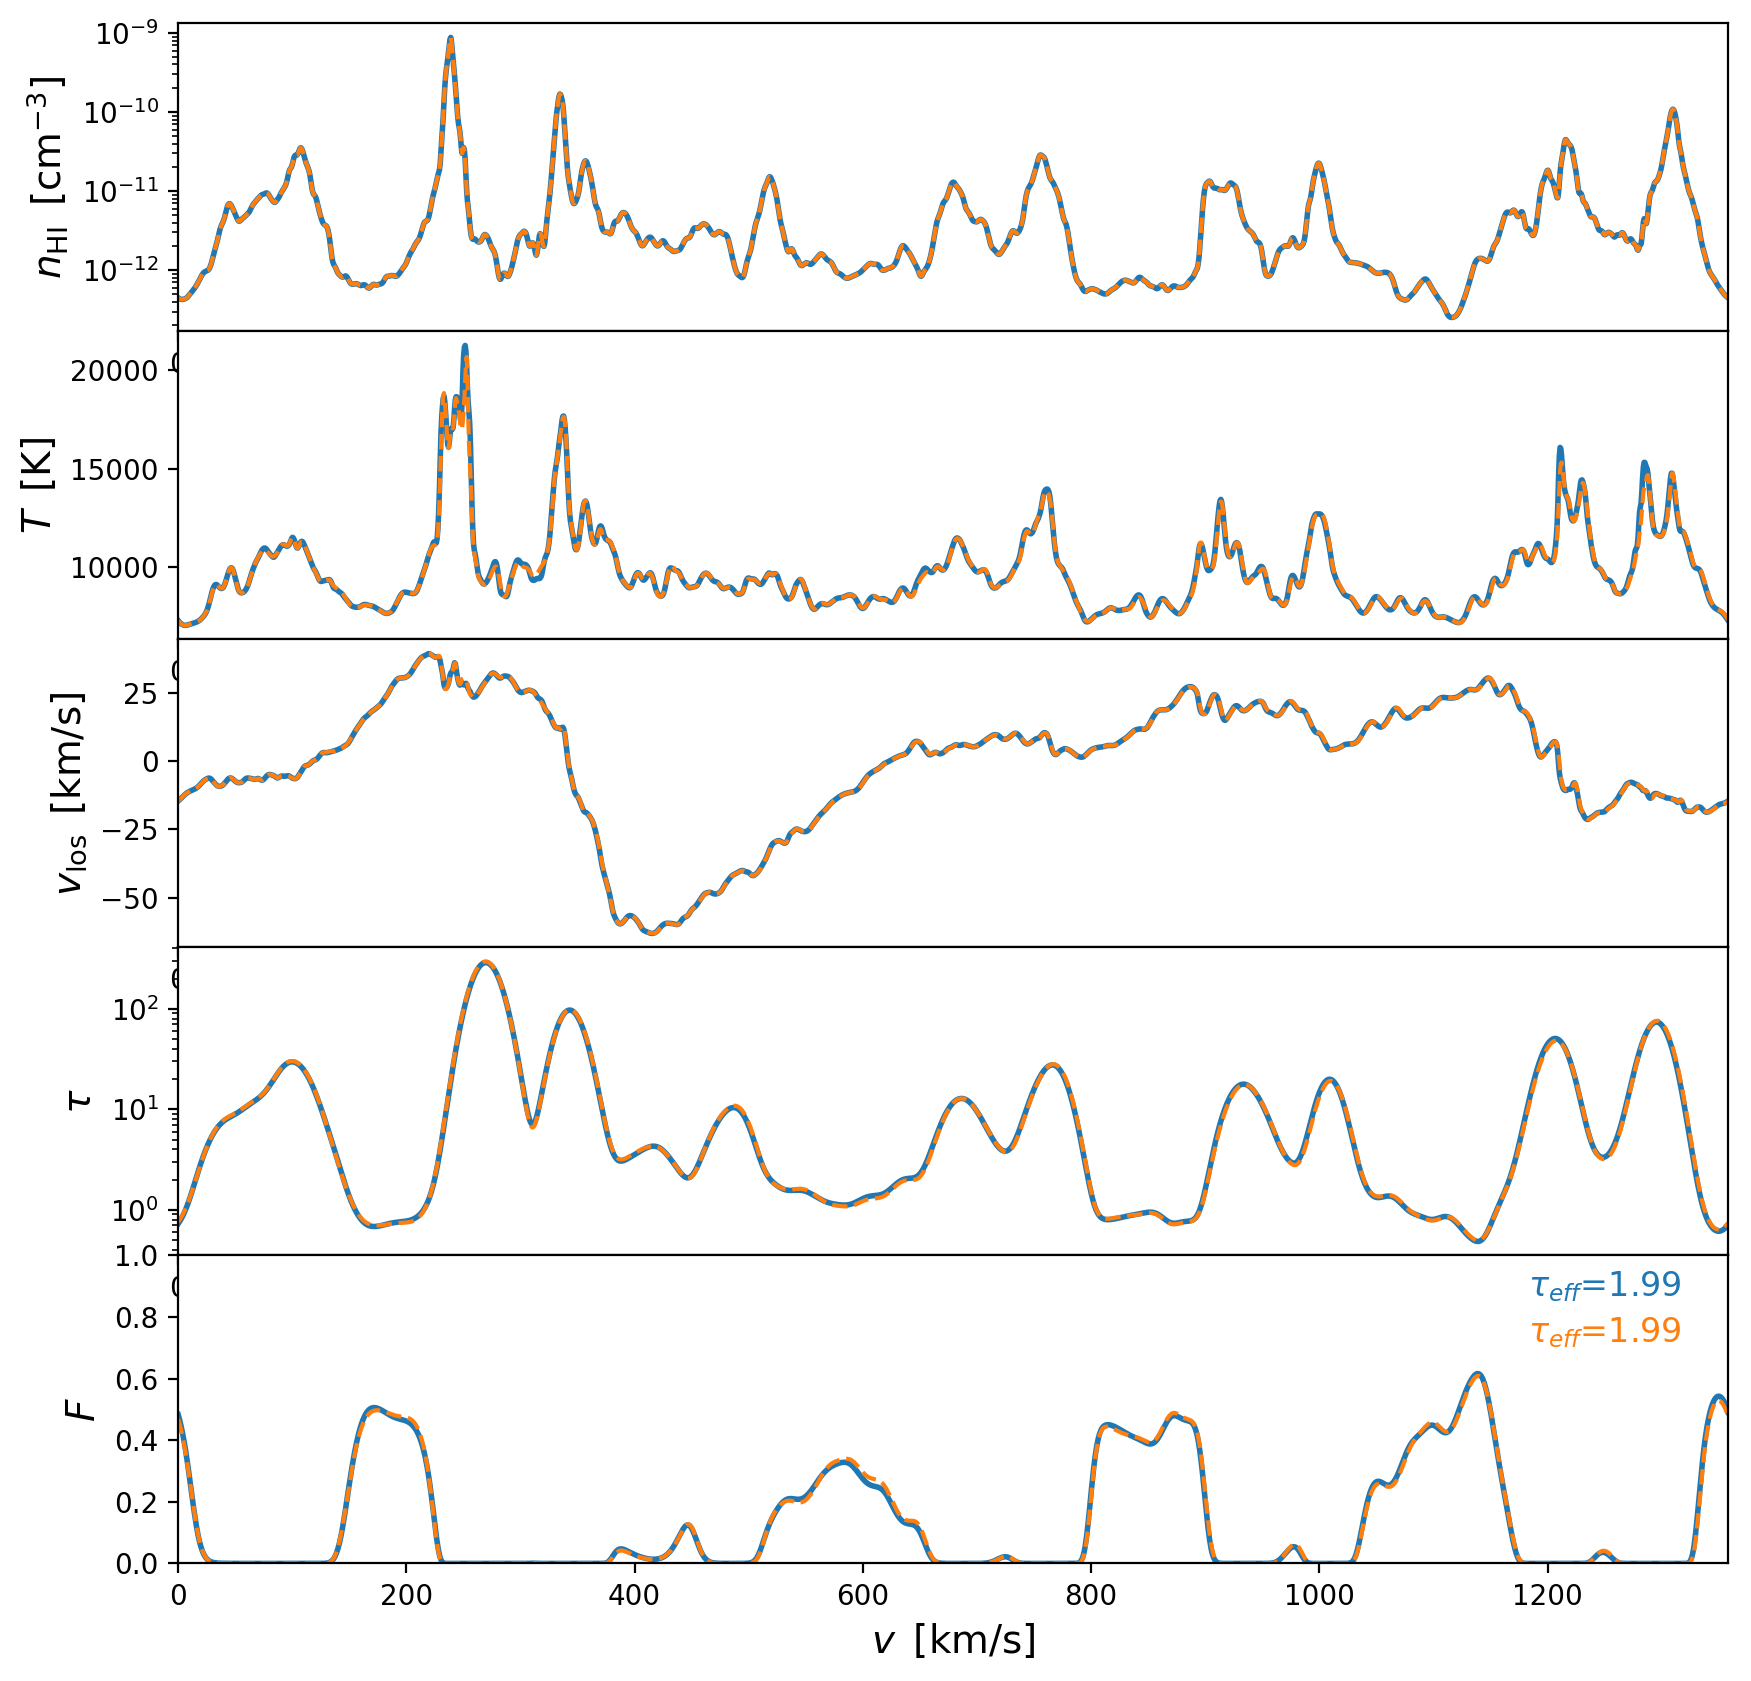
Skewer 4
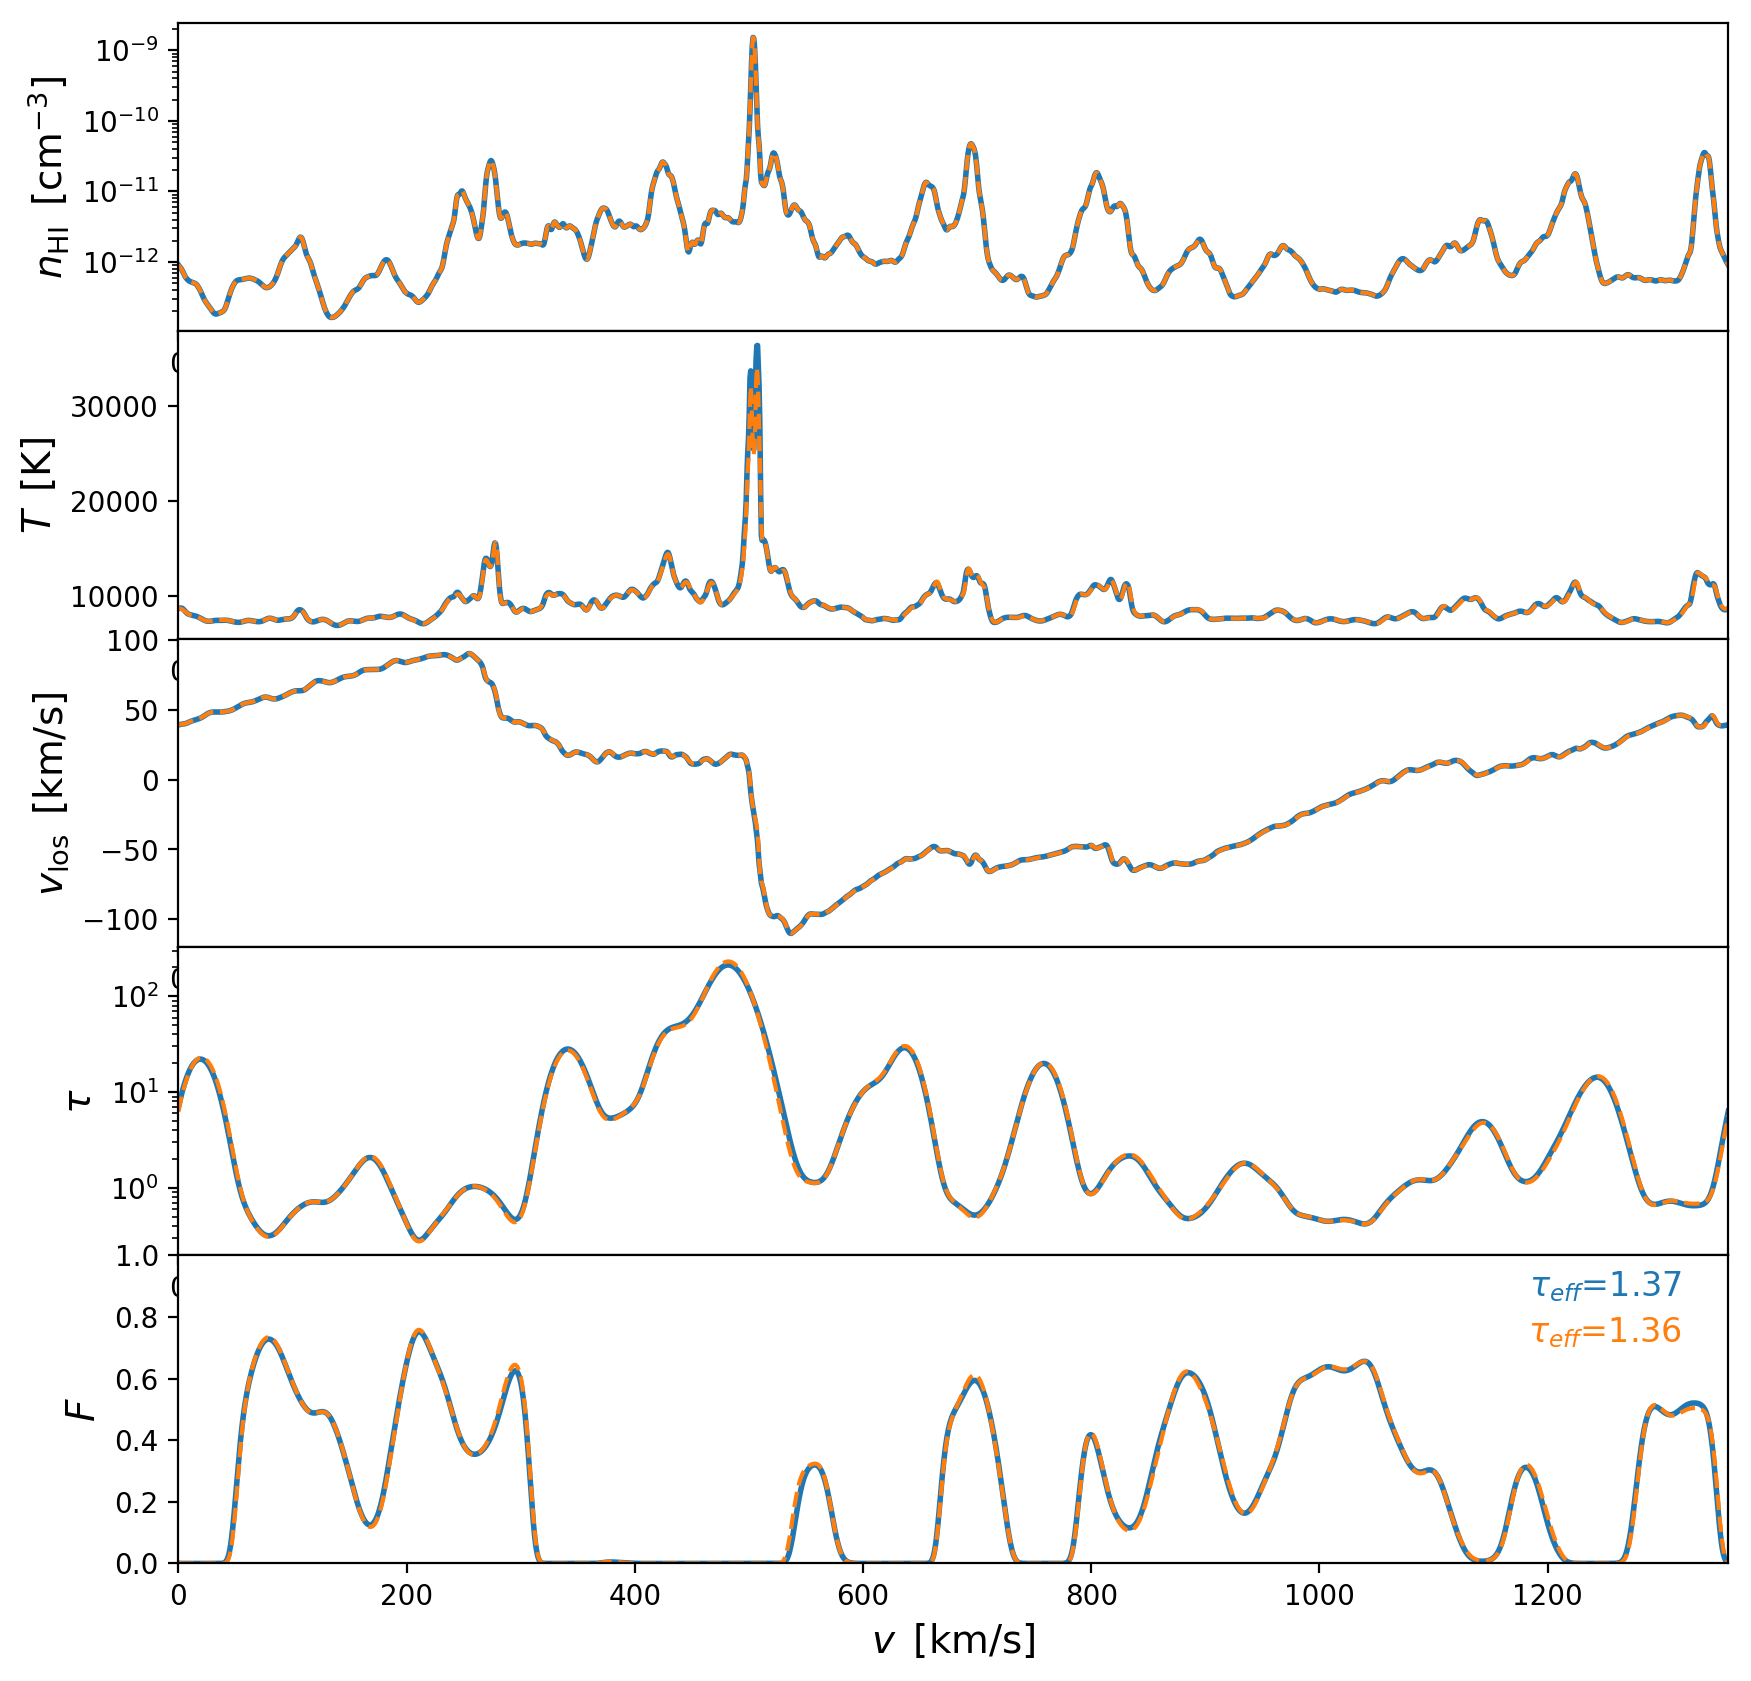
Skewer 5
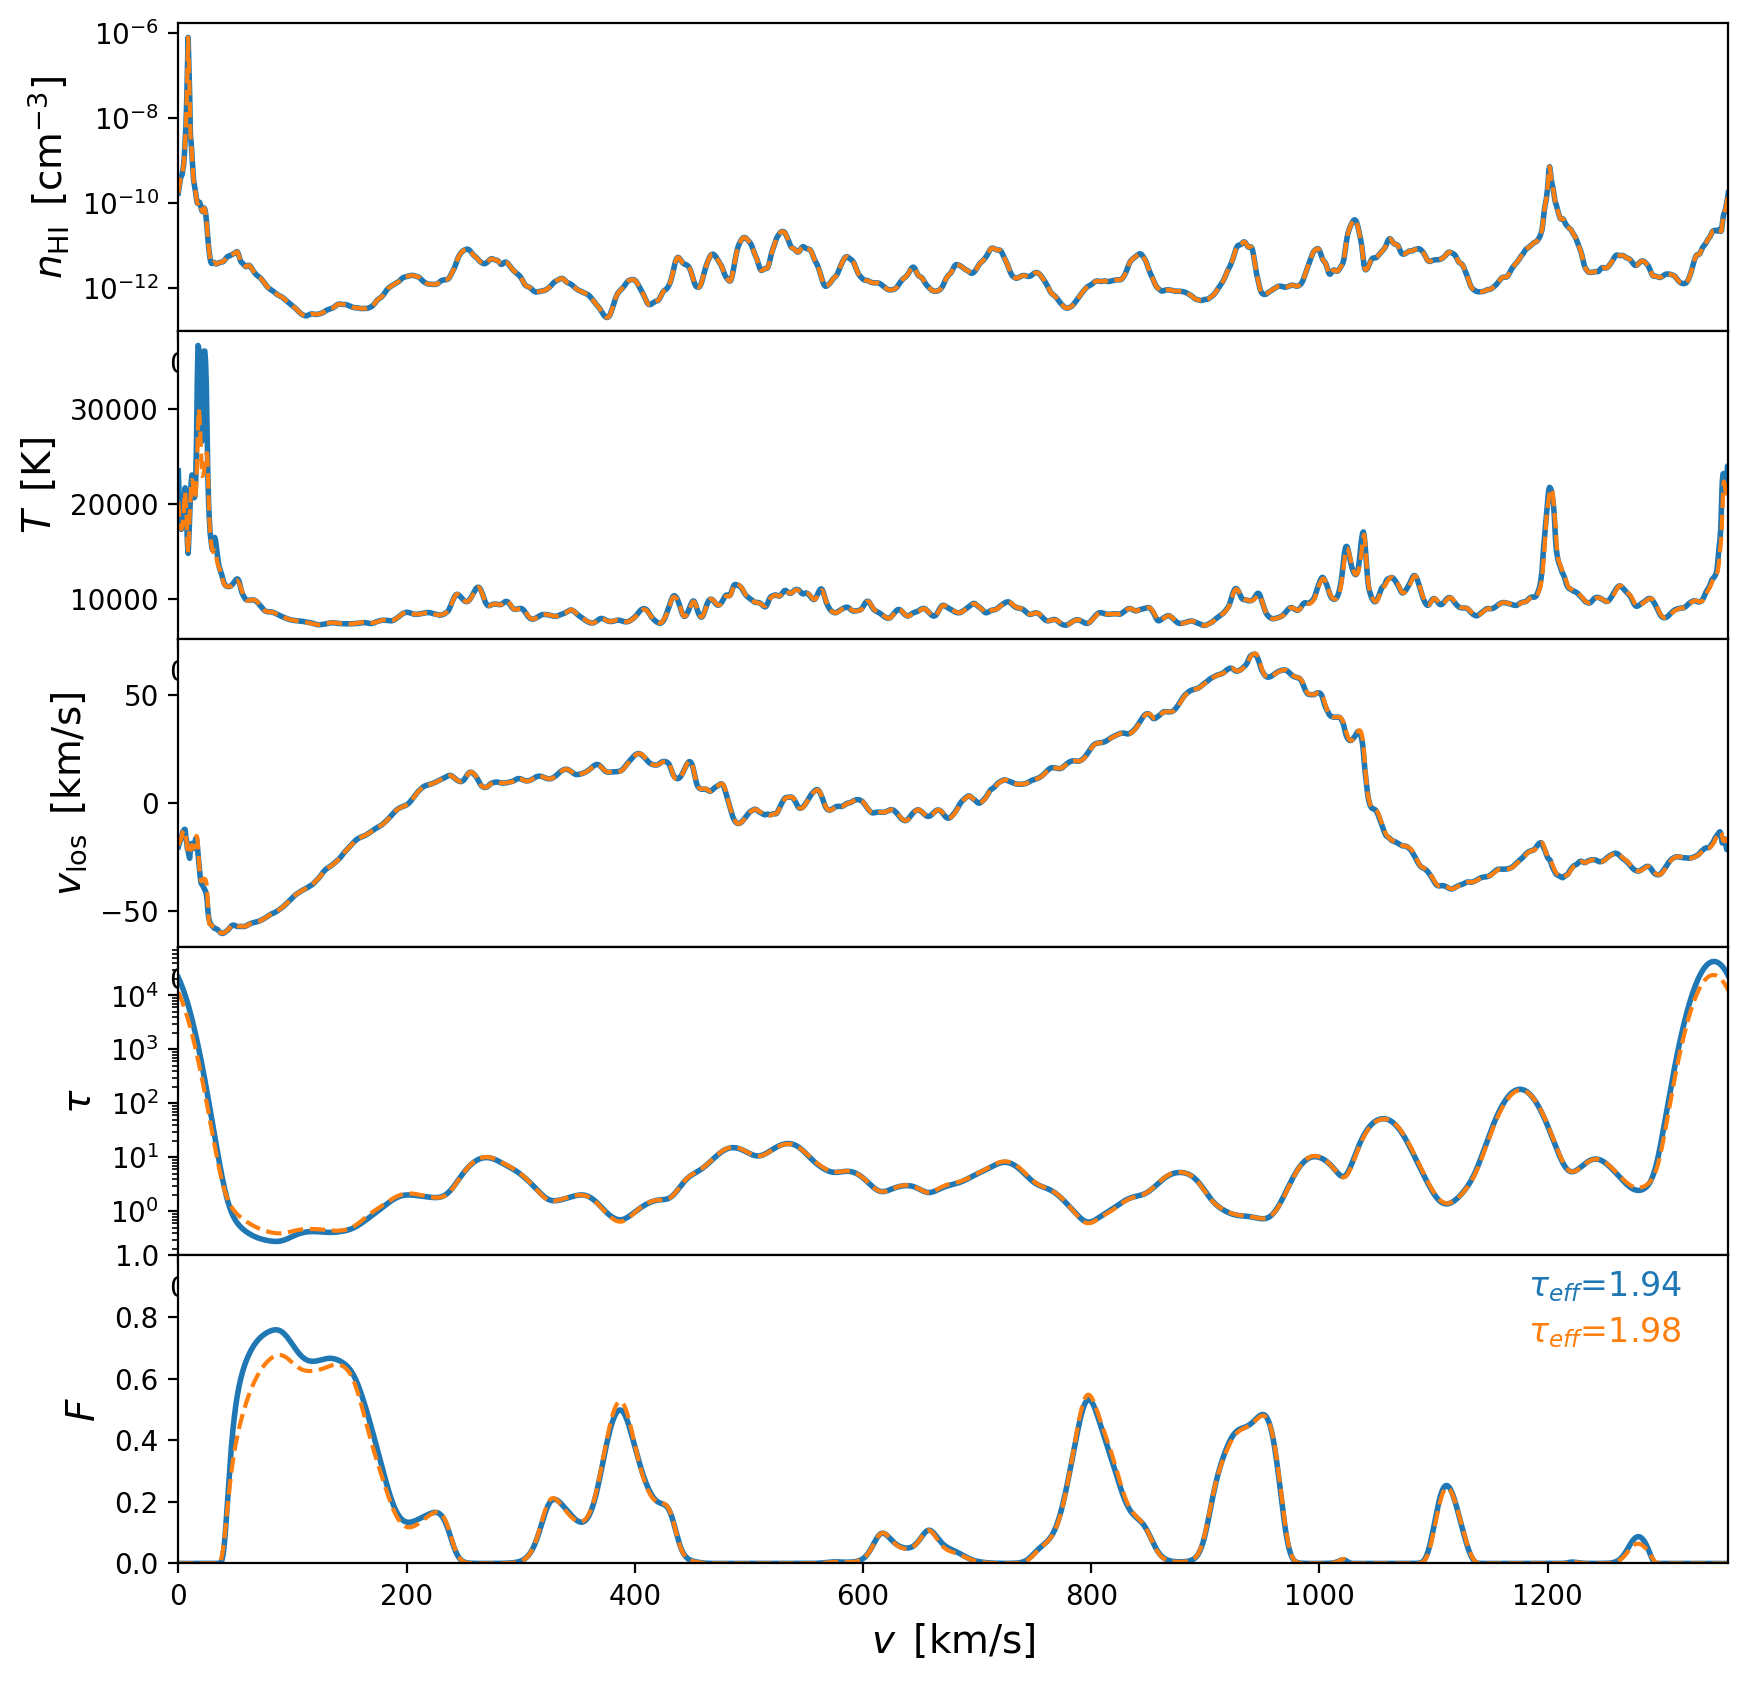
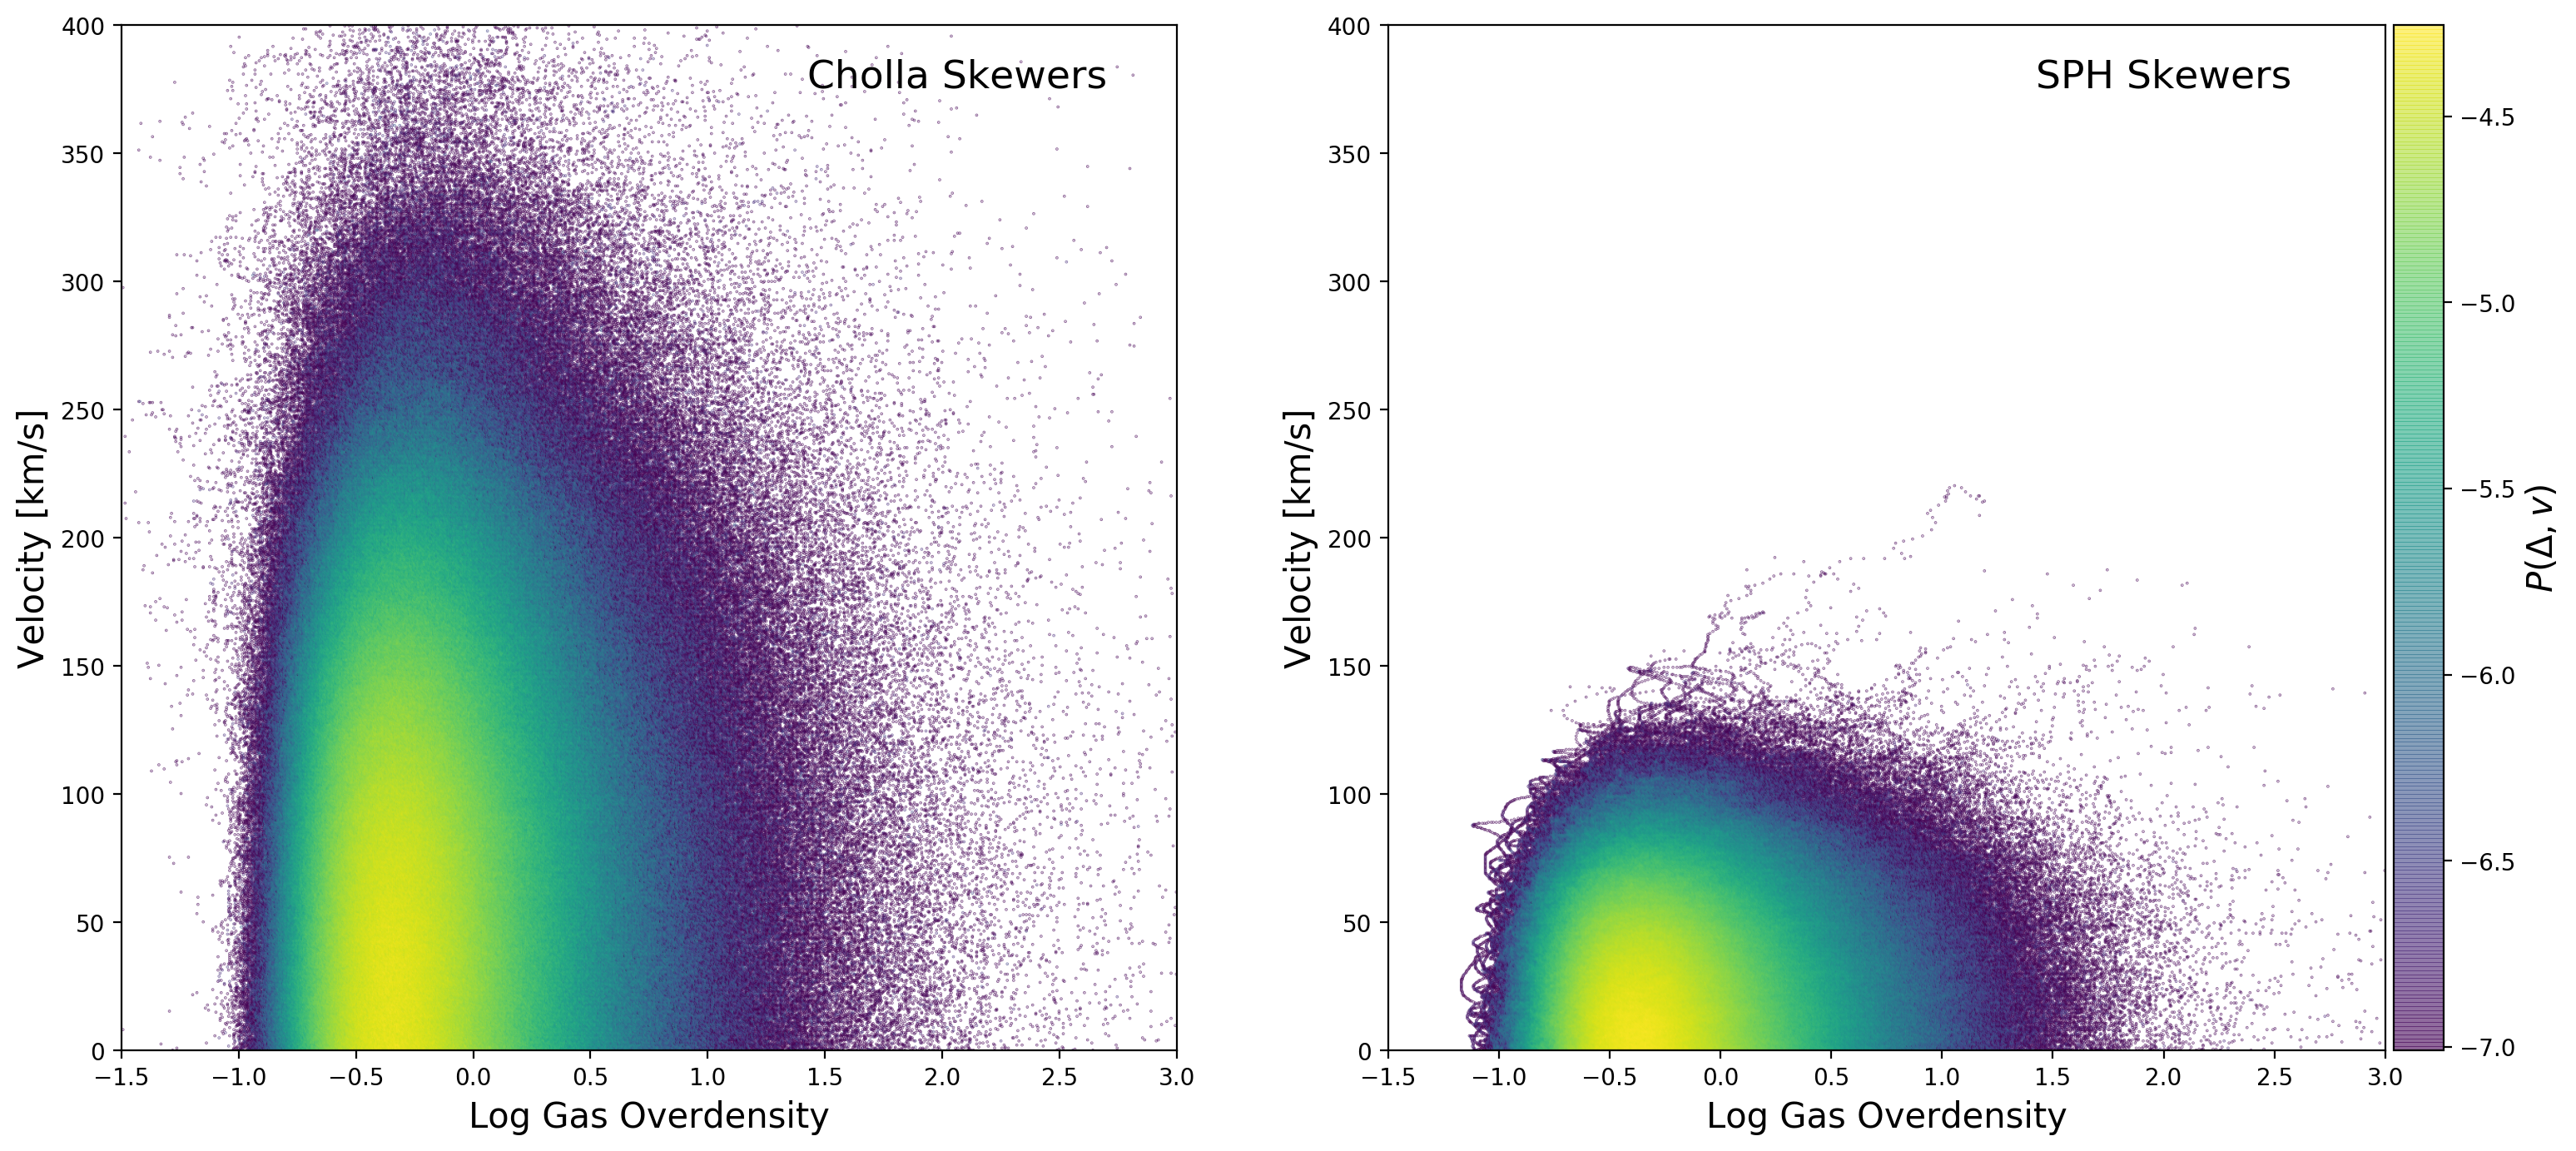
After adding the factor of \(\sqrt{a}\), the value of \(\tau_{eff}\) that I measure from the skewers computed from the SPH simulation also matches the value of \(\tau_{eff}\) reported in Puchwein etal. 2019. But after including the \(\sqrt{a}\) factor on the SPH particle velocities, then the peculiar velocities on the Cholla simulation are higher than the peculiar velocities in the SPH simulation.
The figure below shows the Density-LOSVelocity distribution for 5000 skewers from the Cholla simulation compared to same distribution computed from 5000 skewers from the SPH simulation at z=5, the peculiar velocities of the sph skewers includes the \(\sqrt{a}\) factor.
Now if I multiply the Cholla peculiar velocities by \(\sqrt{a}\) the velocities are very similar to the SPH skewer LOS velocities, as shown in the figure below:
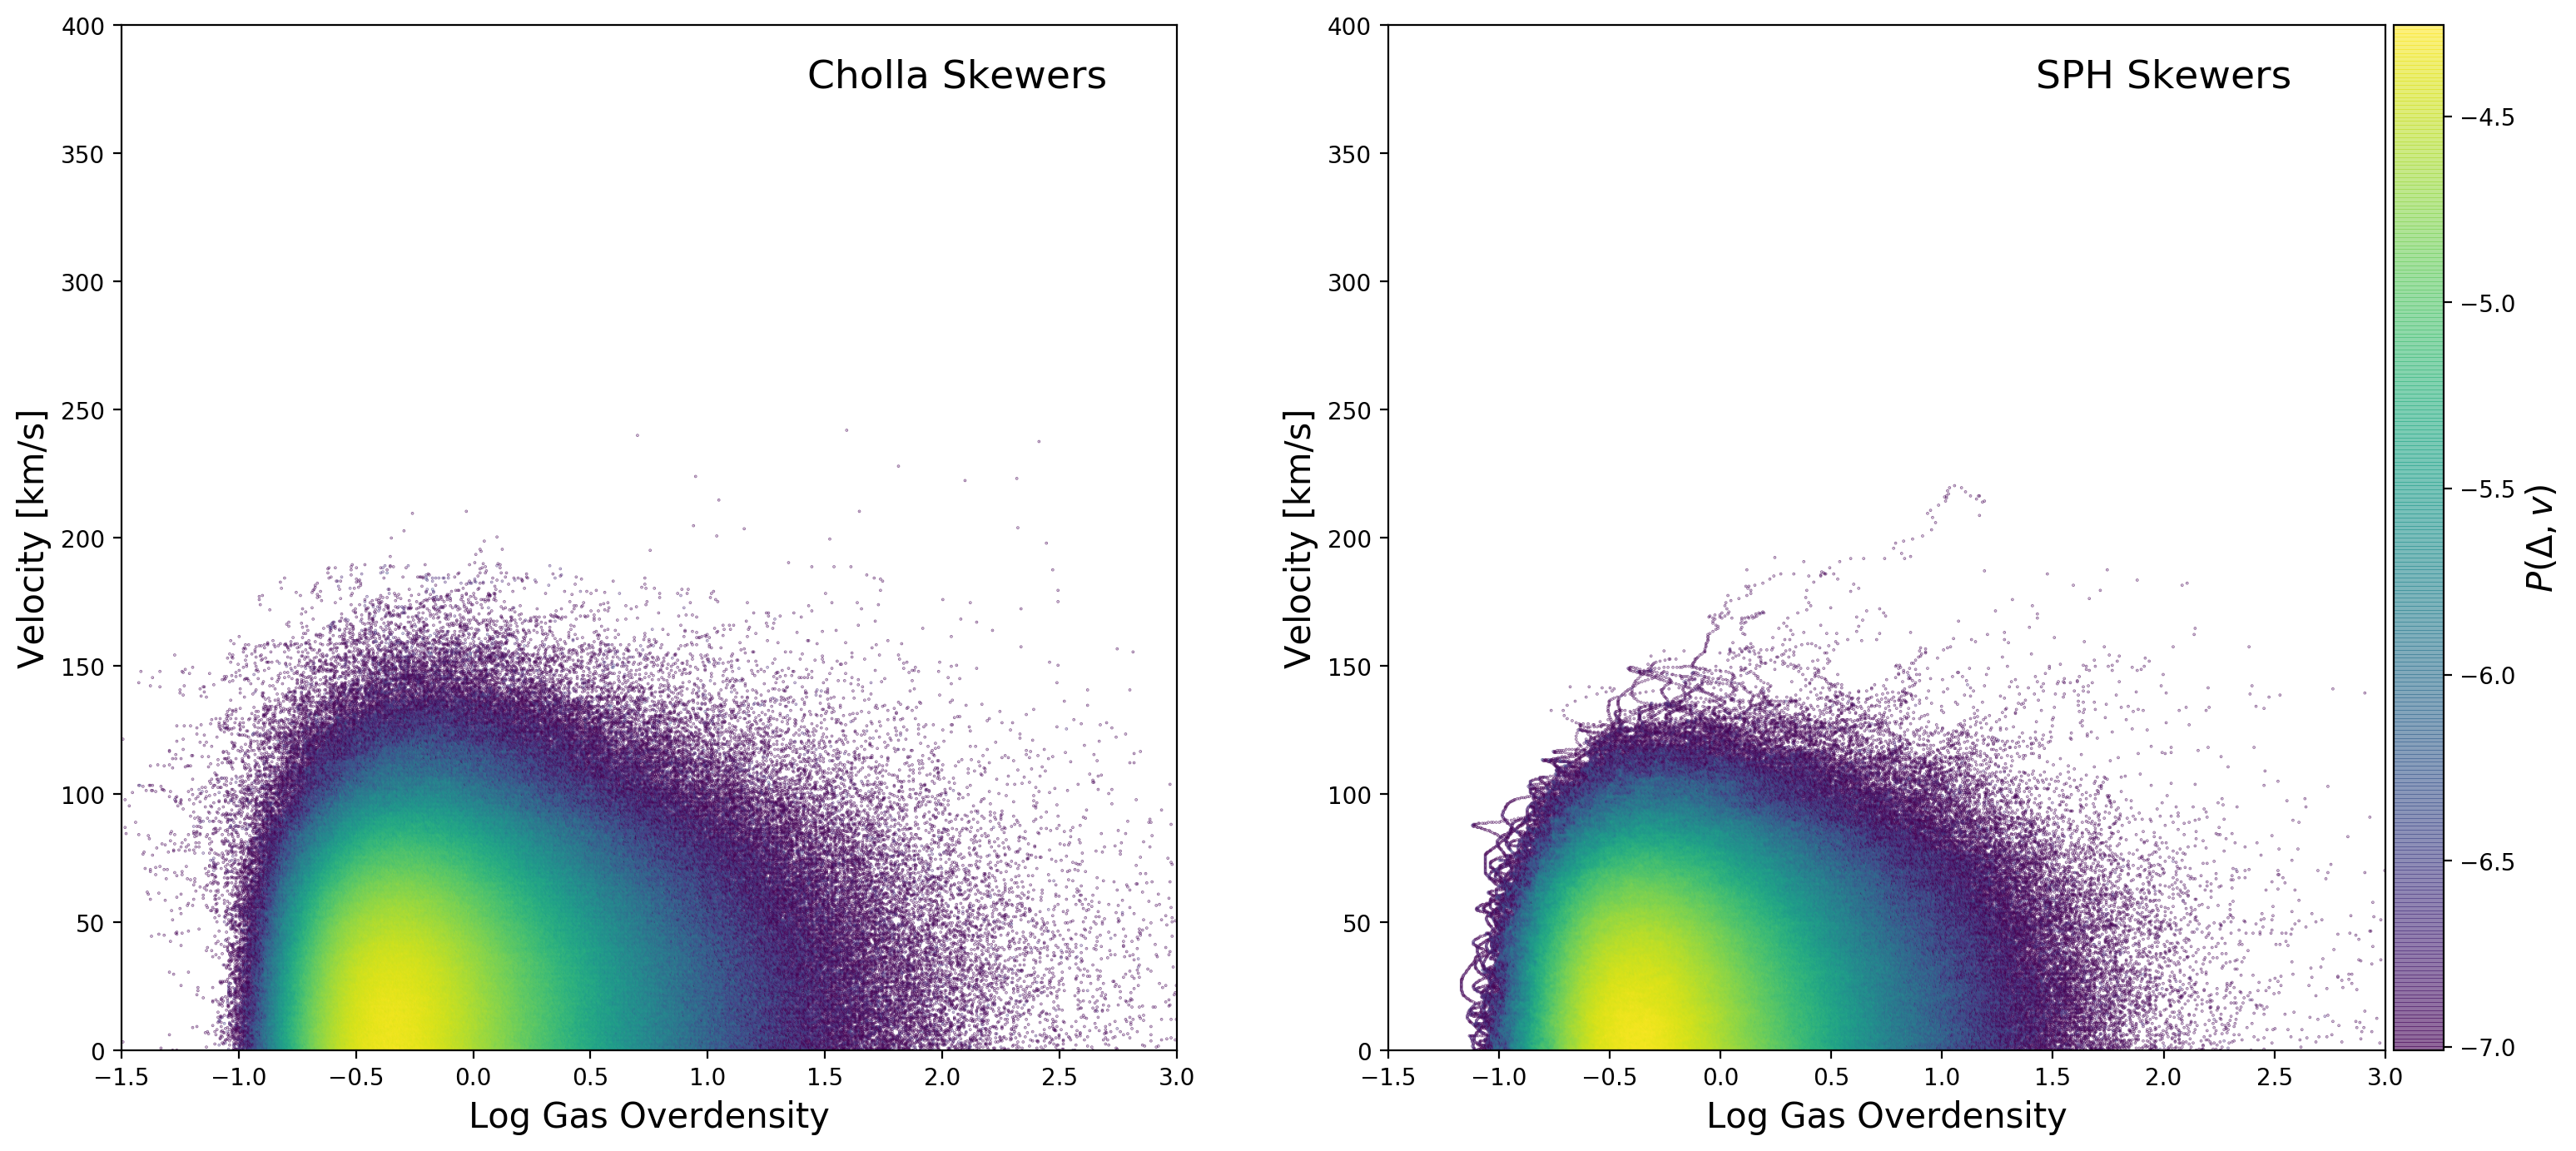
Then the question is: Am I missing a factor of \(\sqrt{a}\) when interpreting the Cholla gas peculiar velocities?
If I add the \(\sqrt{a}\) factor, the effective optical depth is shown in the figure below:
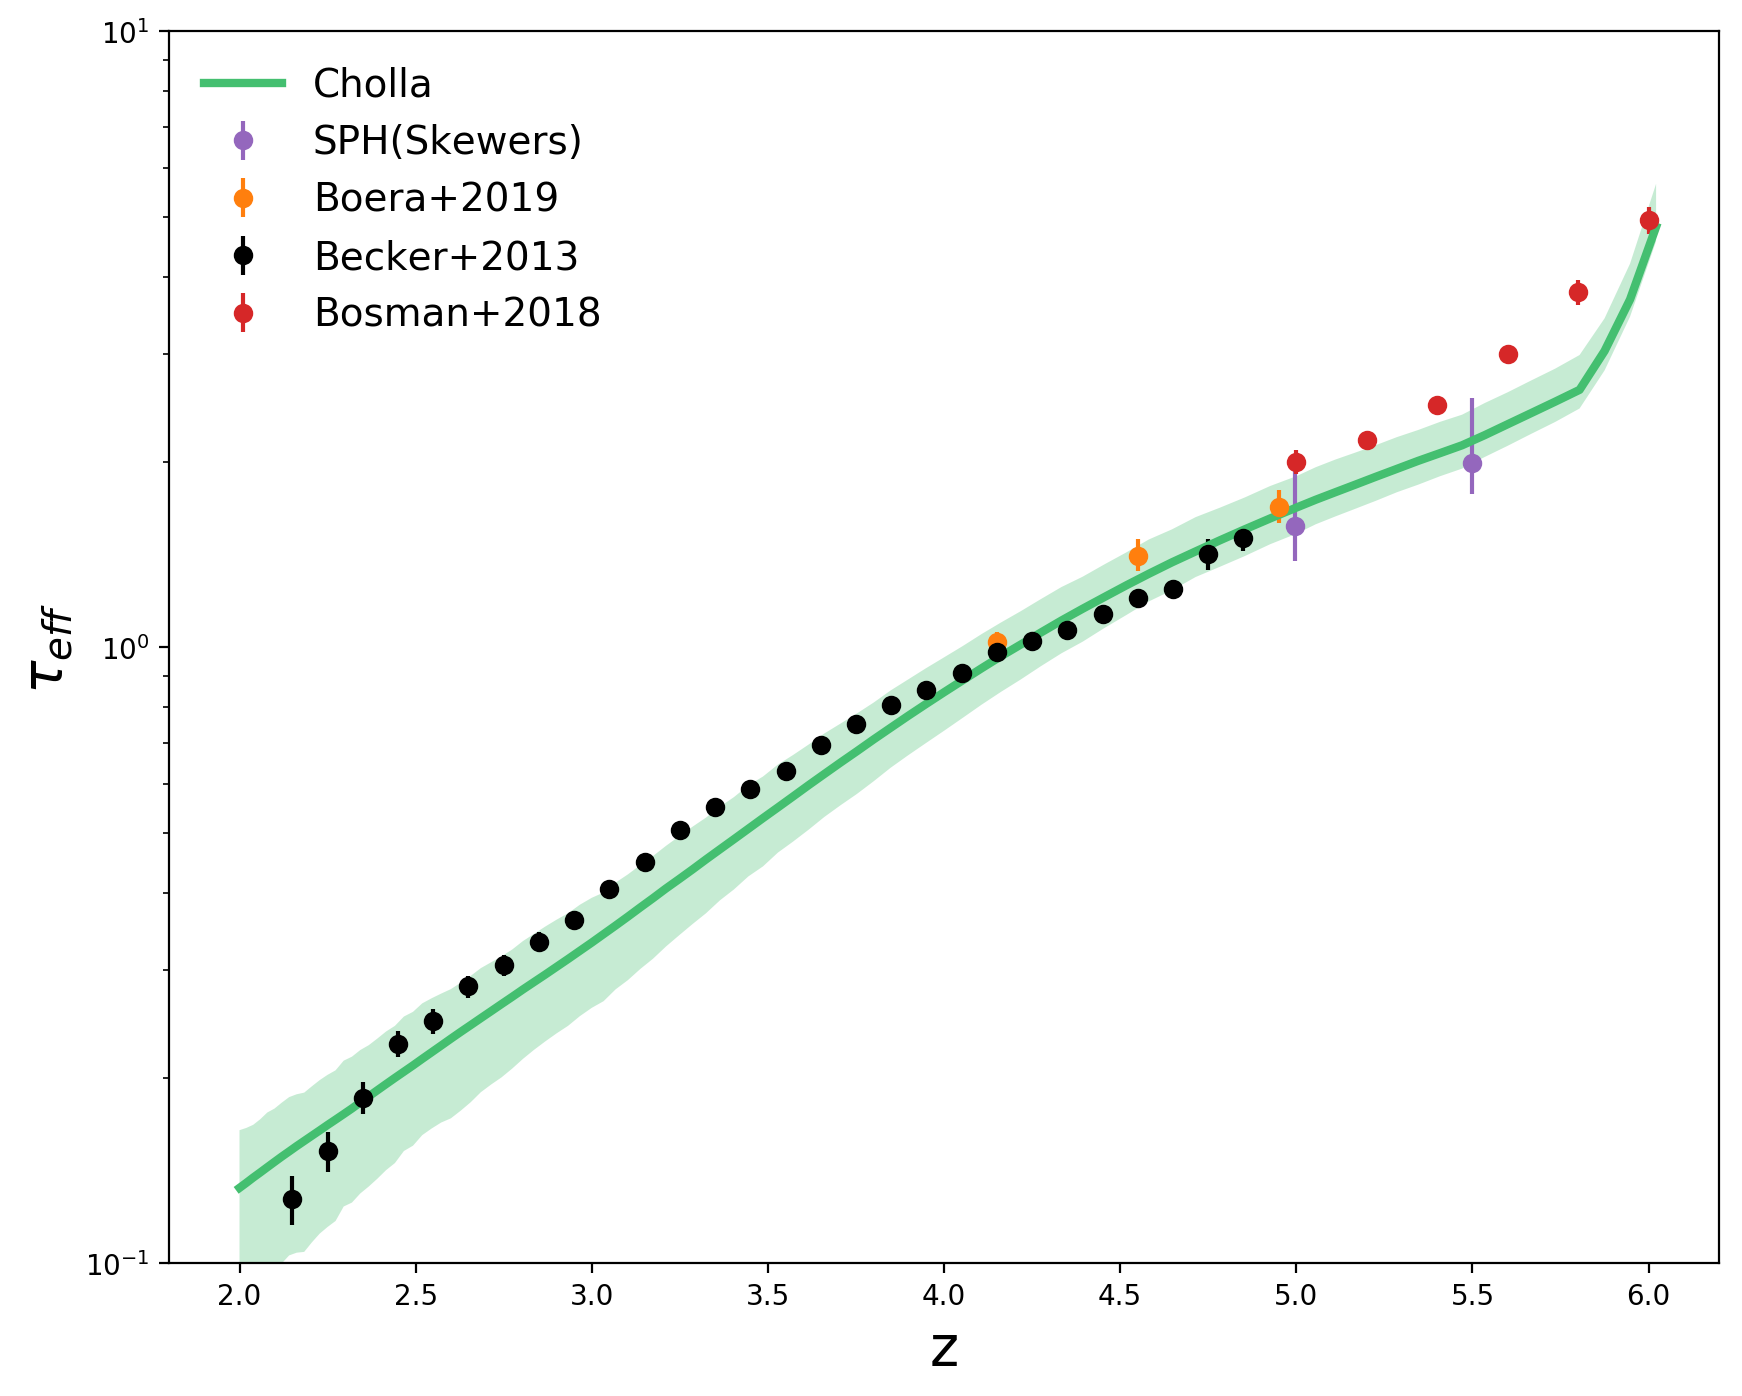
Flux Power Spectrum Small Scales:
Without \(\sqrt{a}\) factor
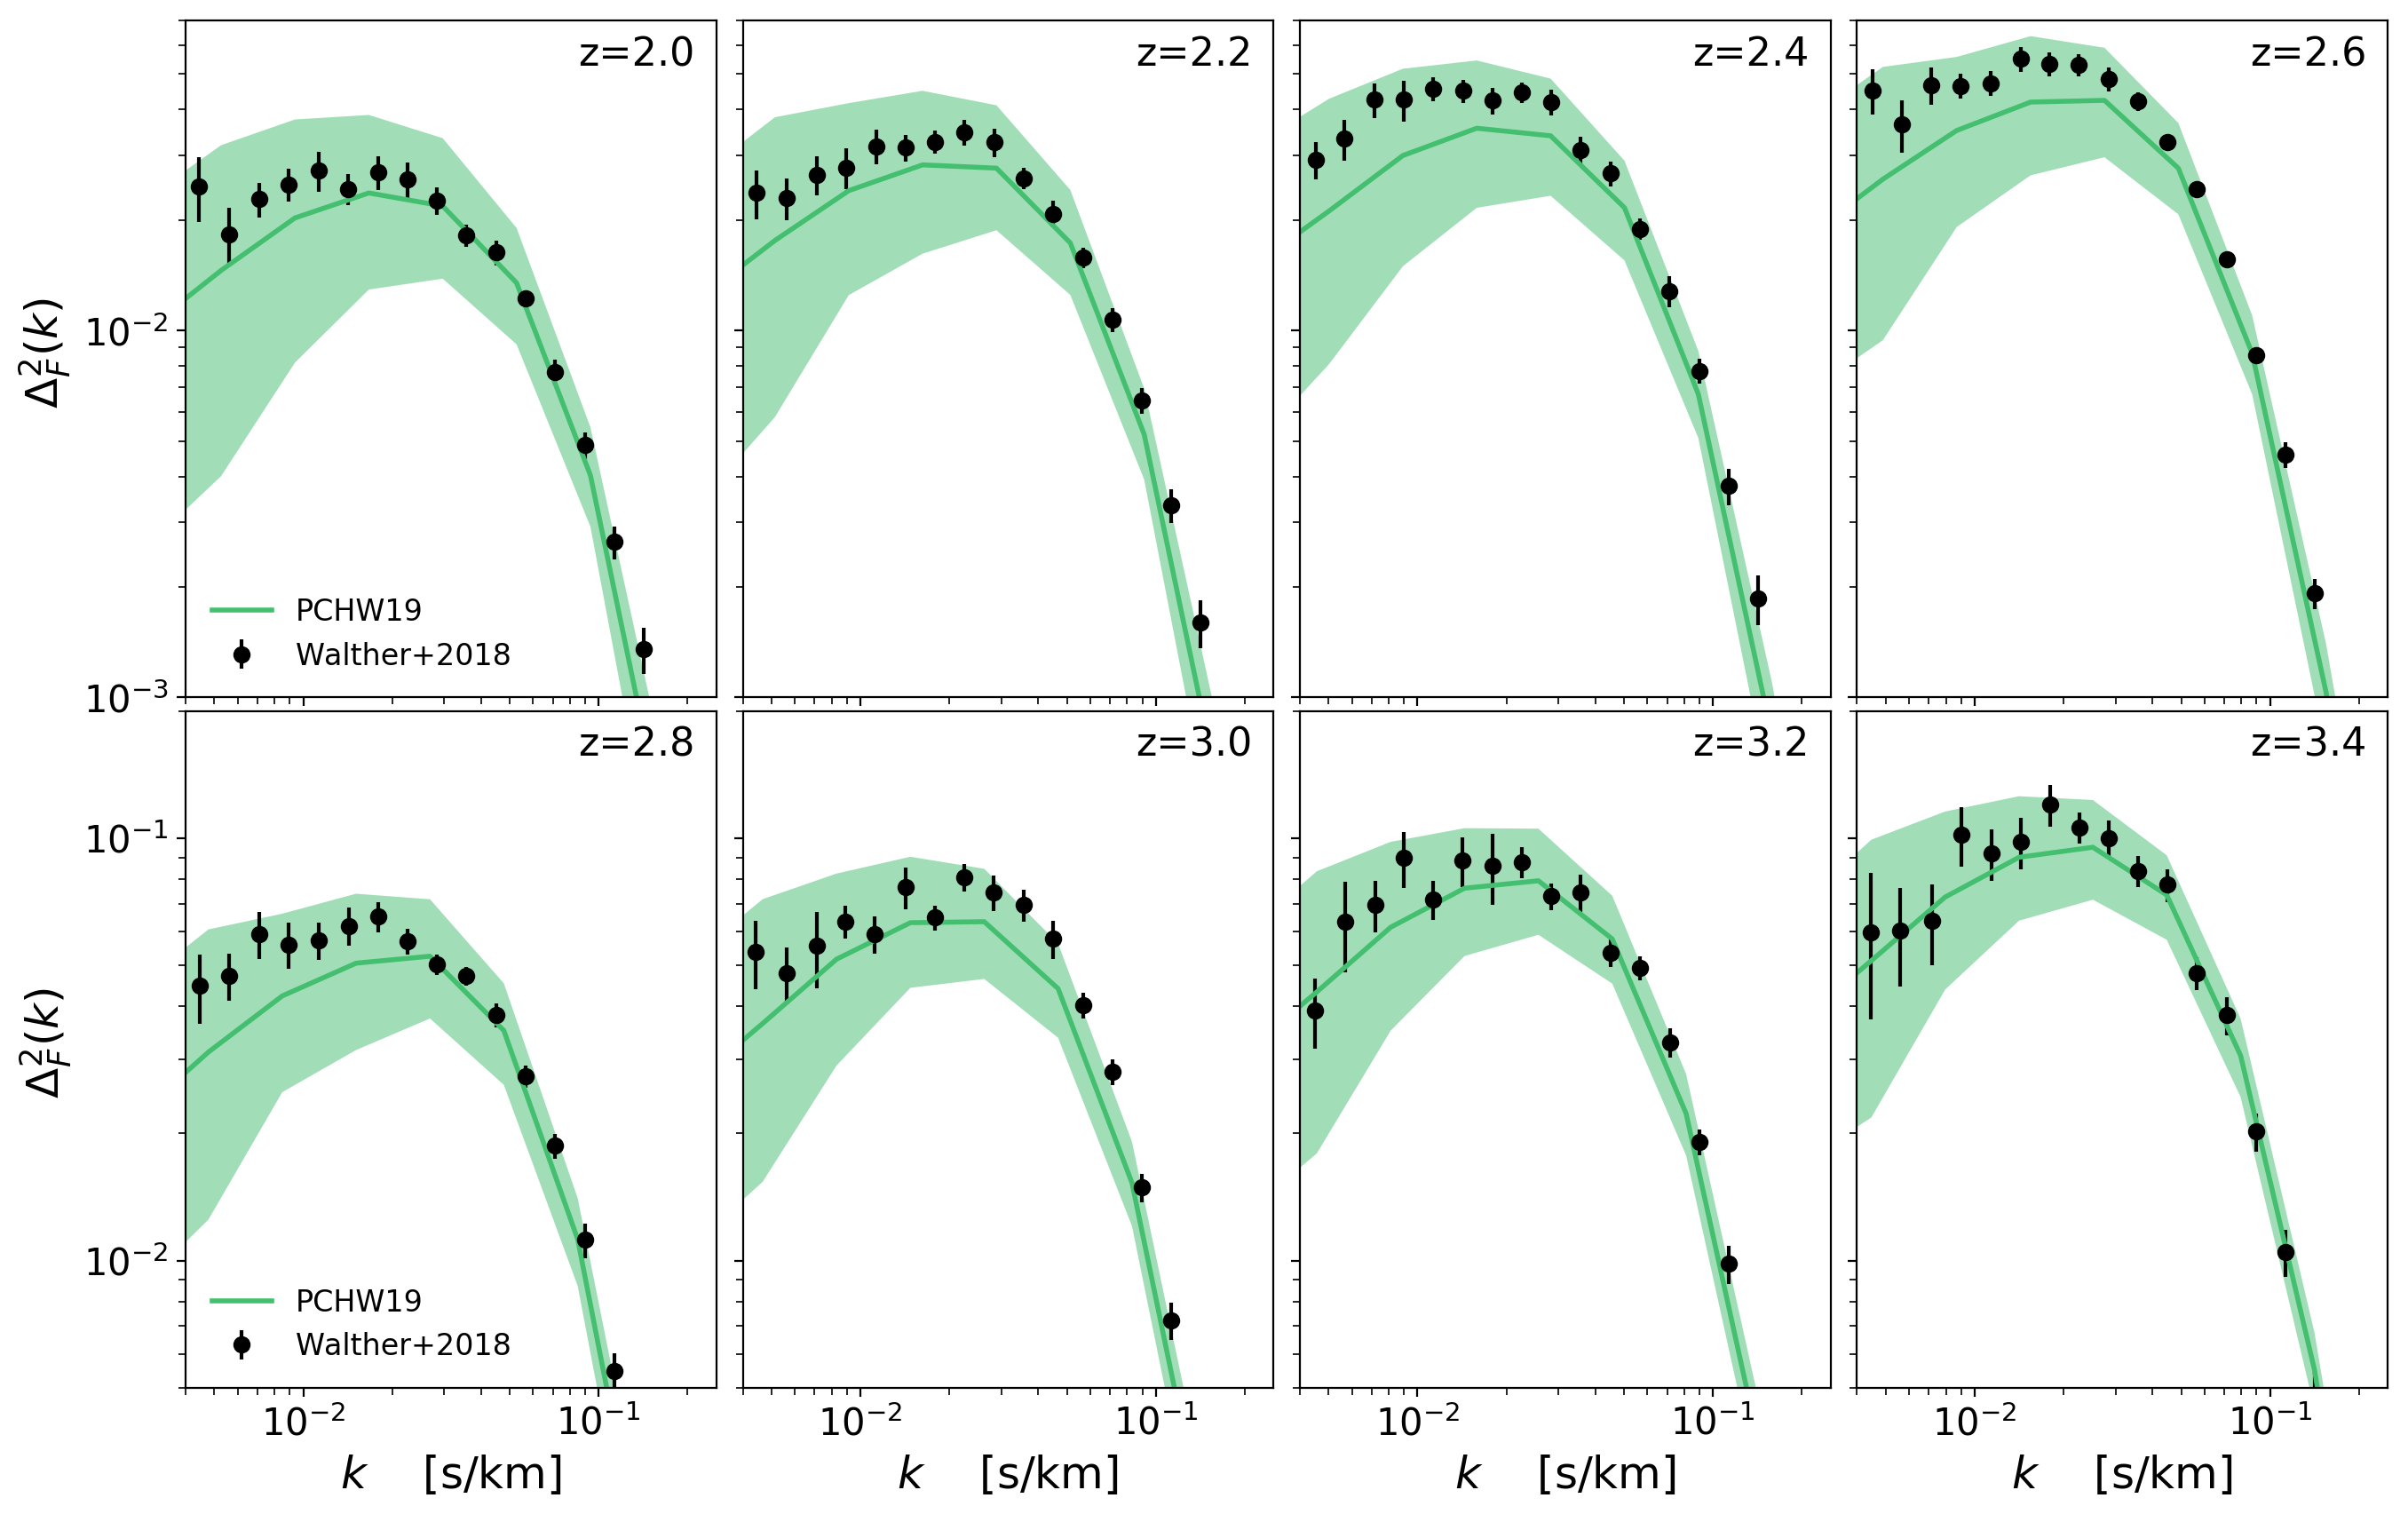
With \(\sqrt{a}\) factor
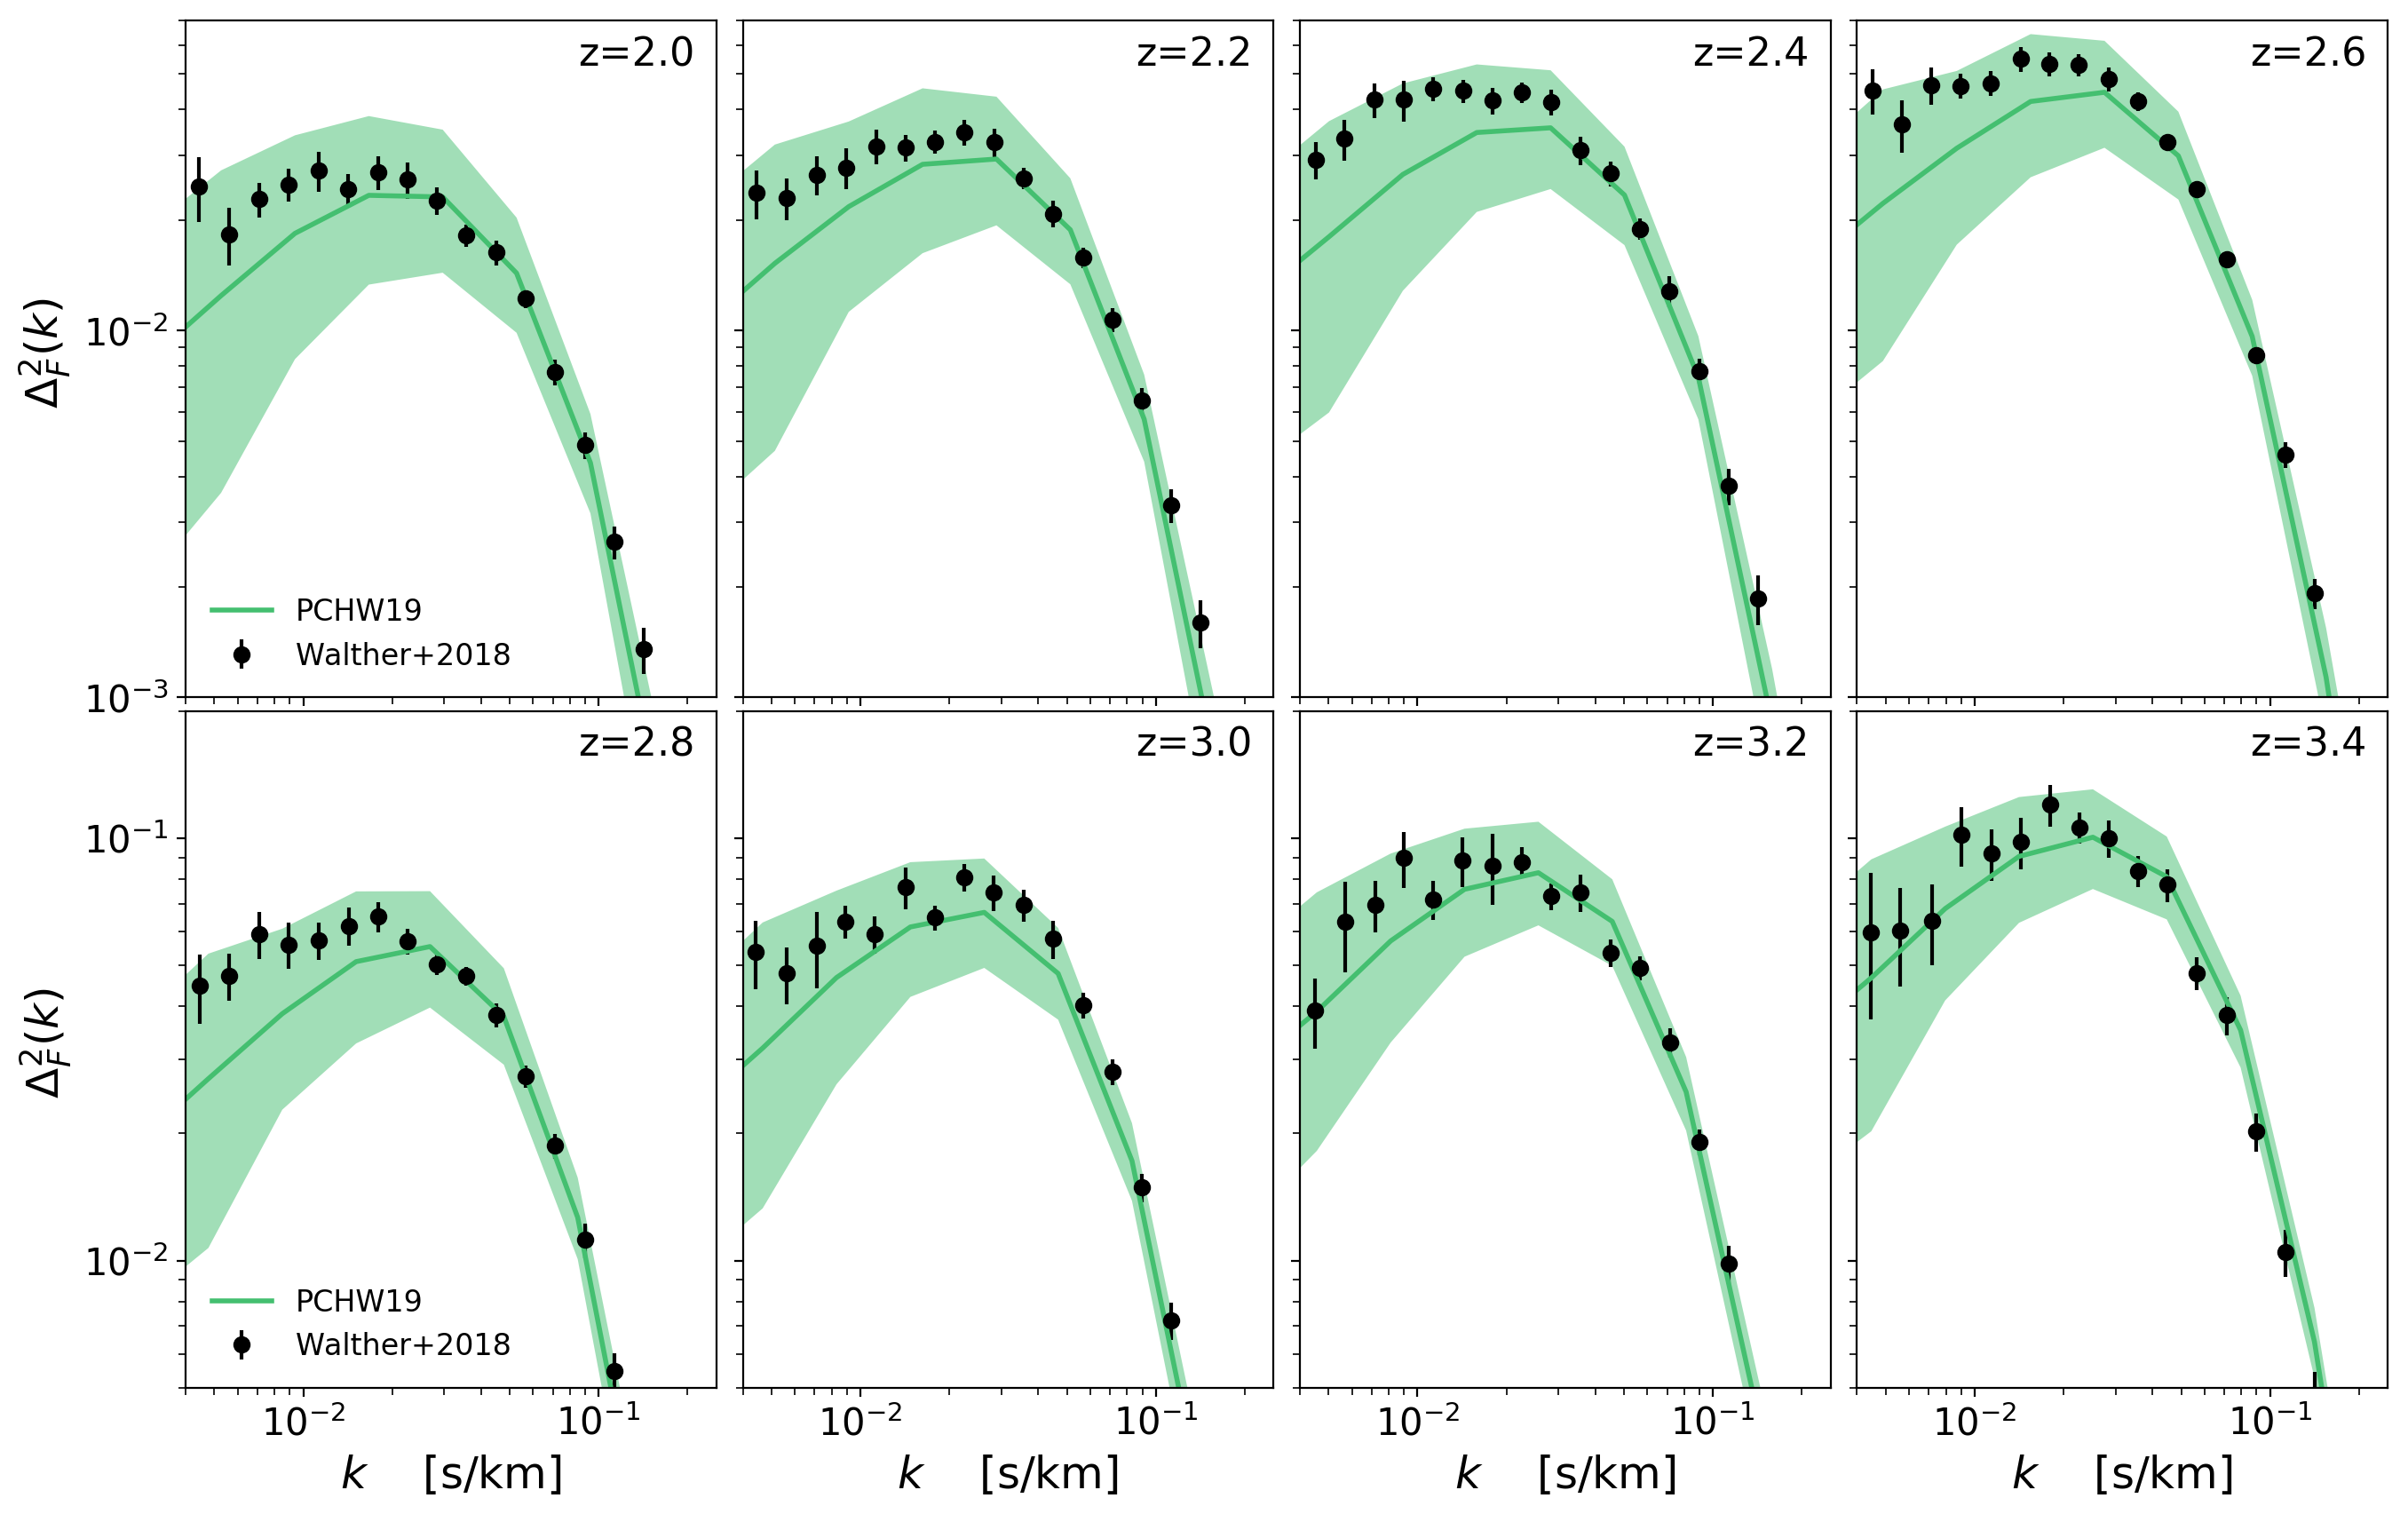
Without \(\sqrt{a}\) factor
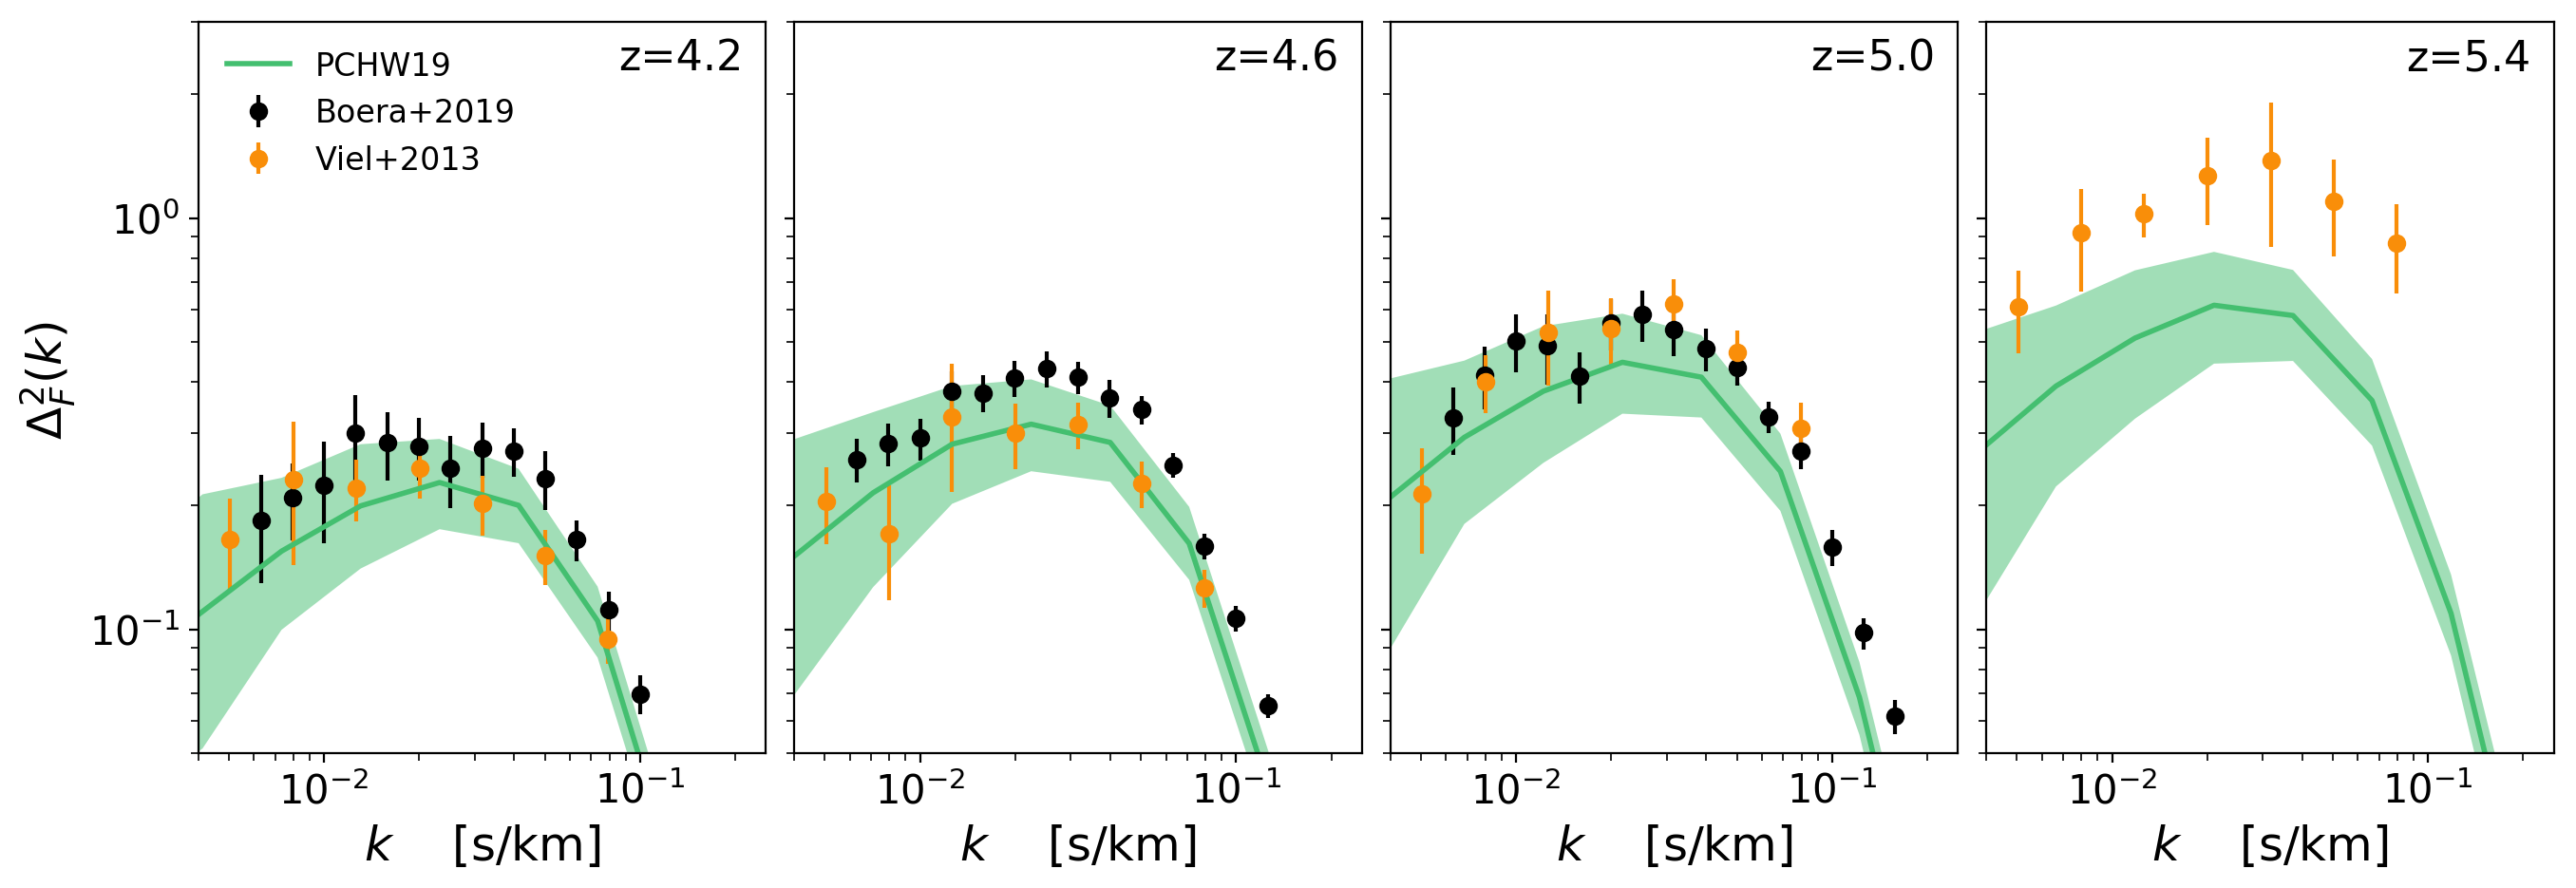
With \(\sqrt{a}\) factor
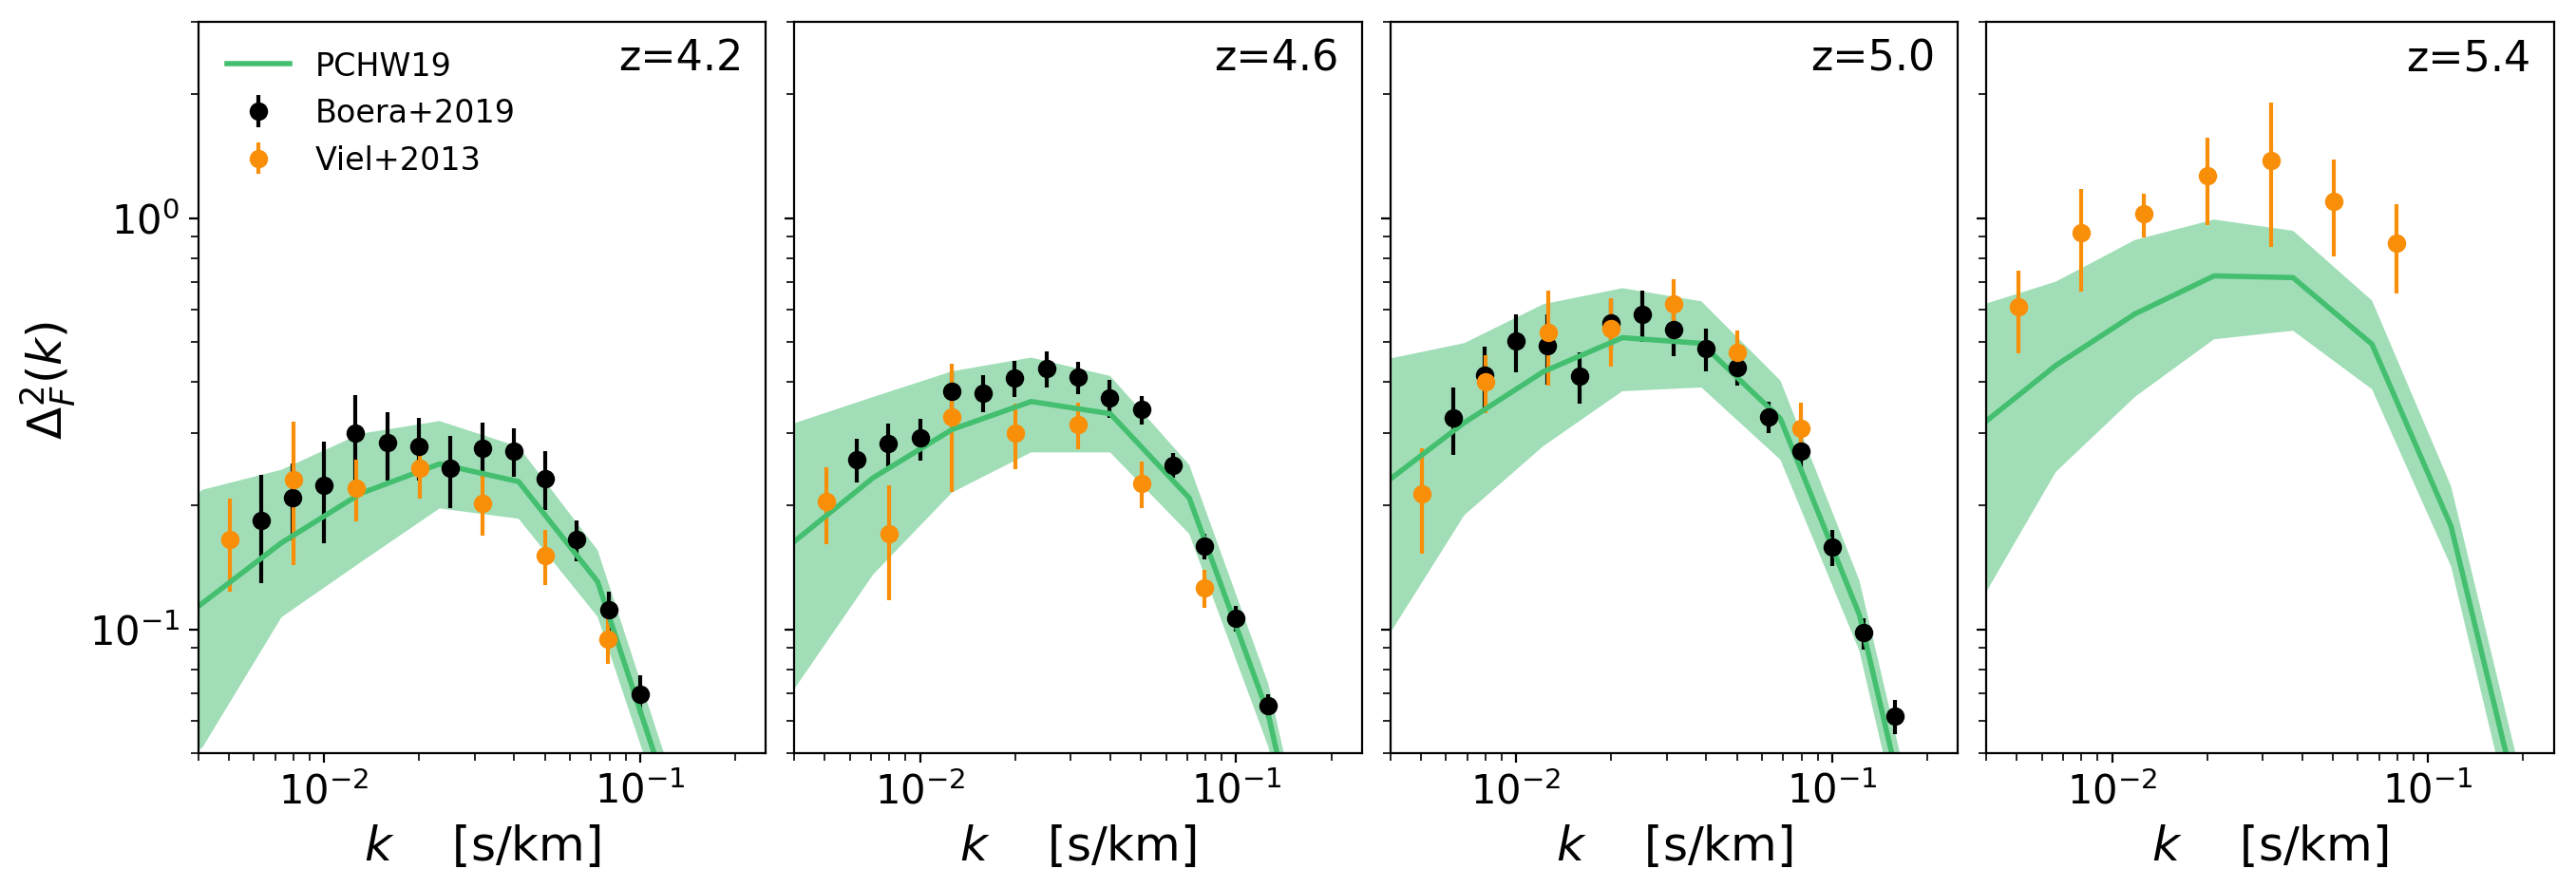
Flux Power Spectrum Large Scales:
Without \(\sqrt{a}\) factor
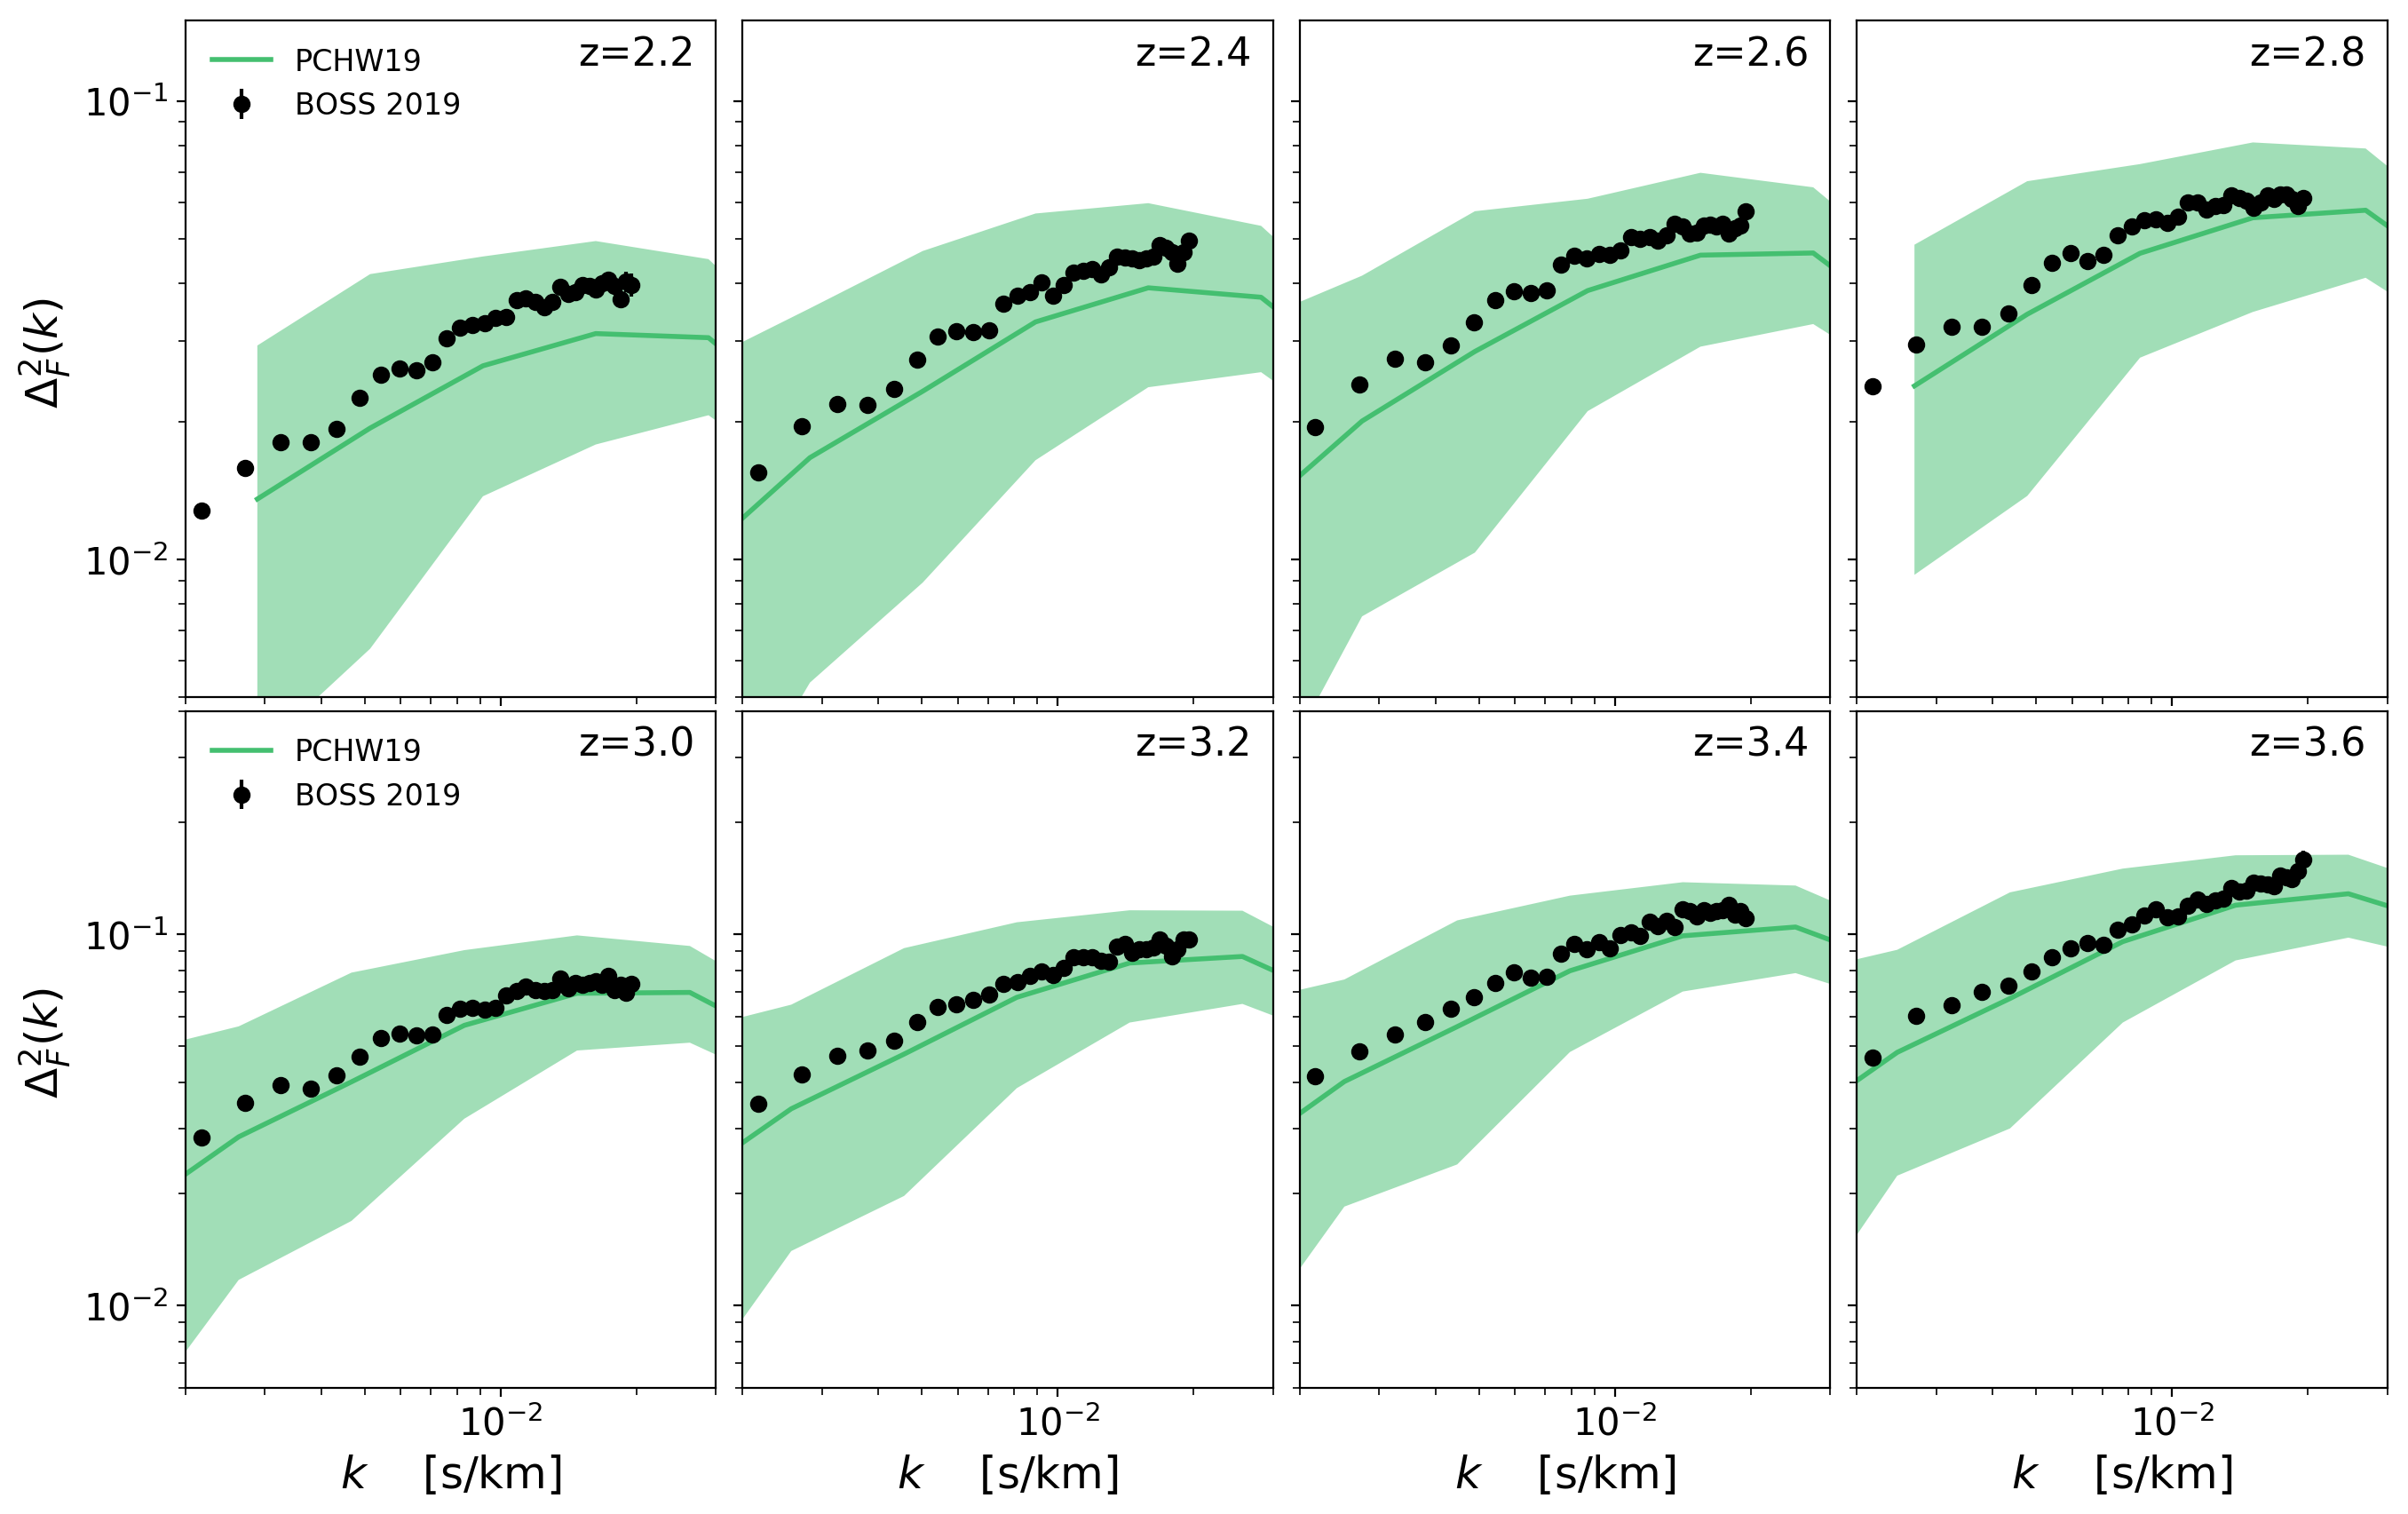
With \(\sqrt{a}\) factor
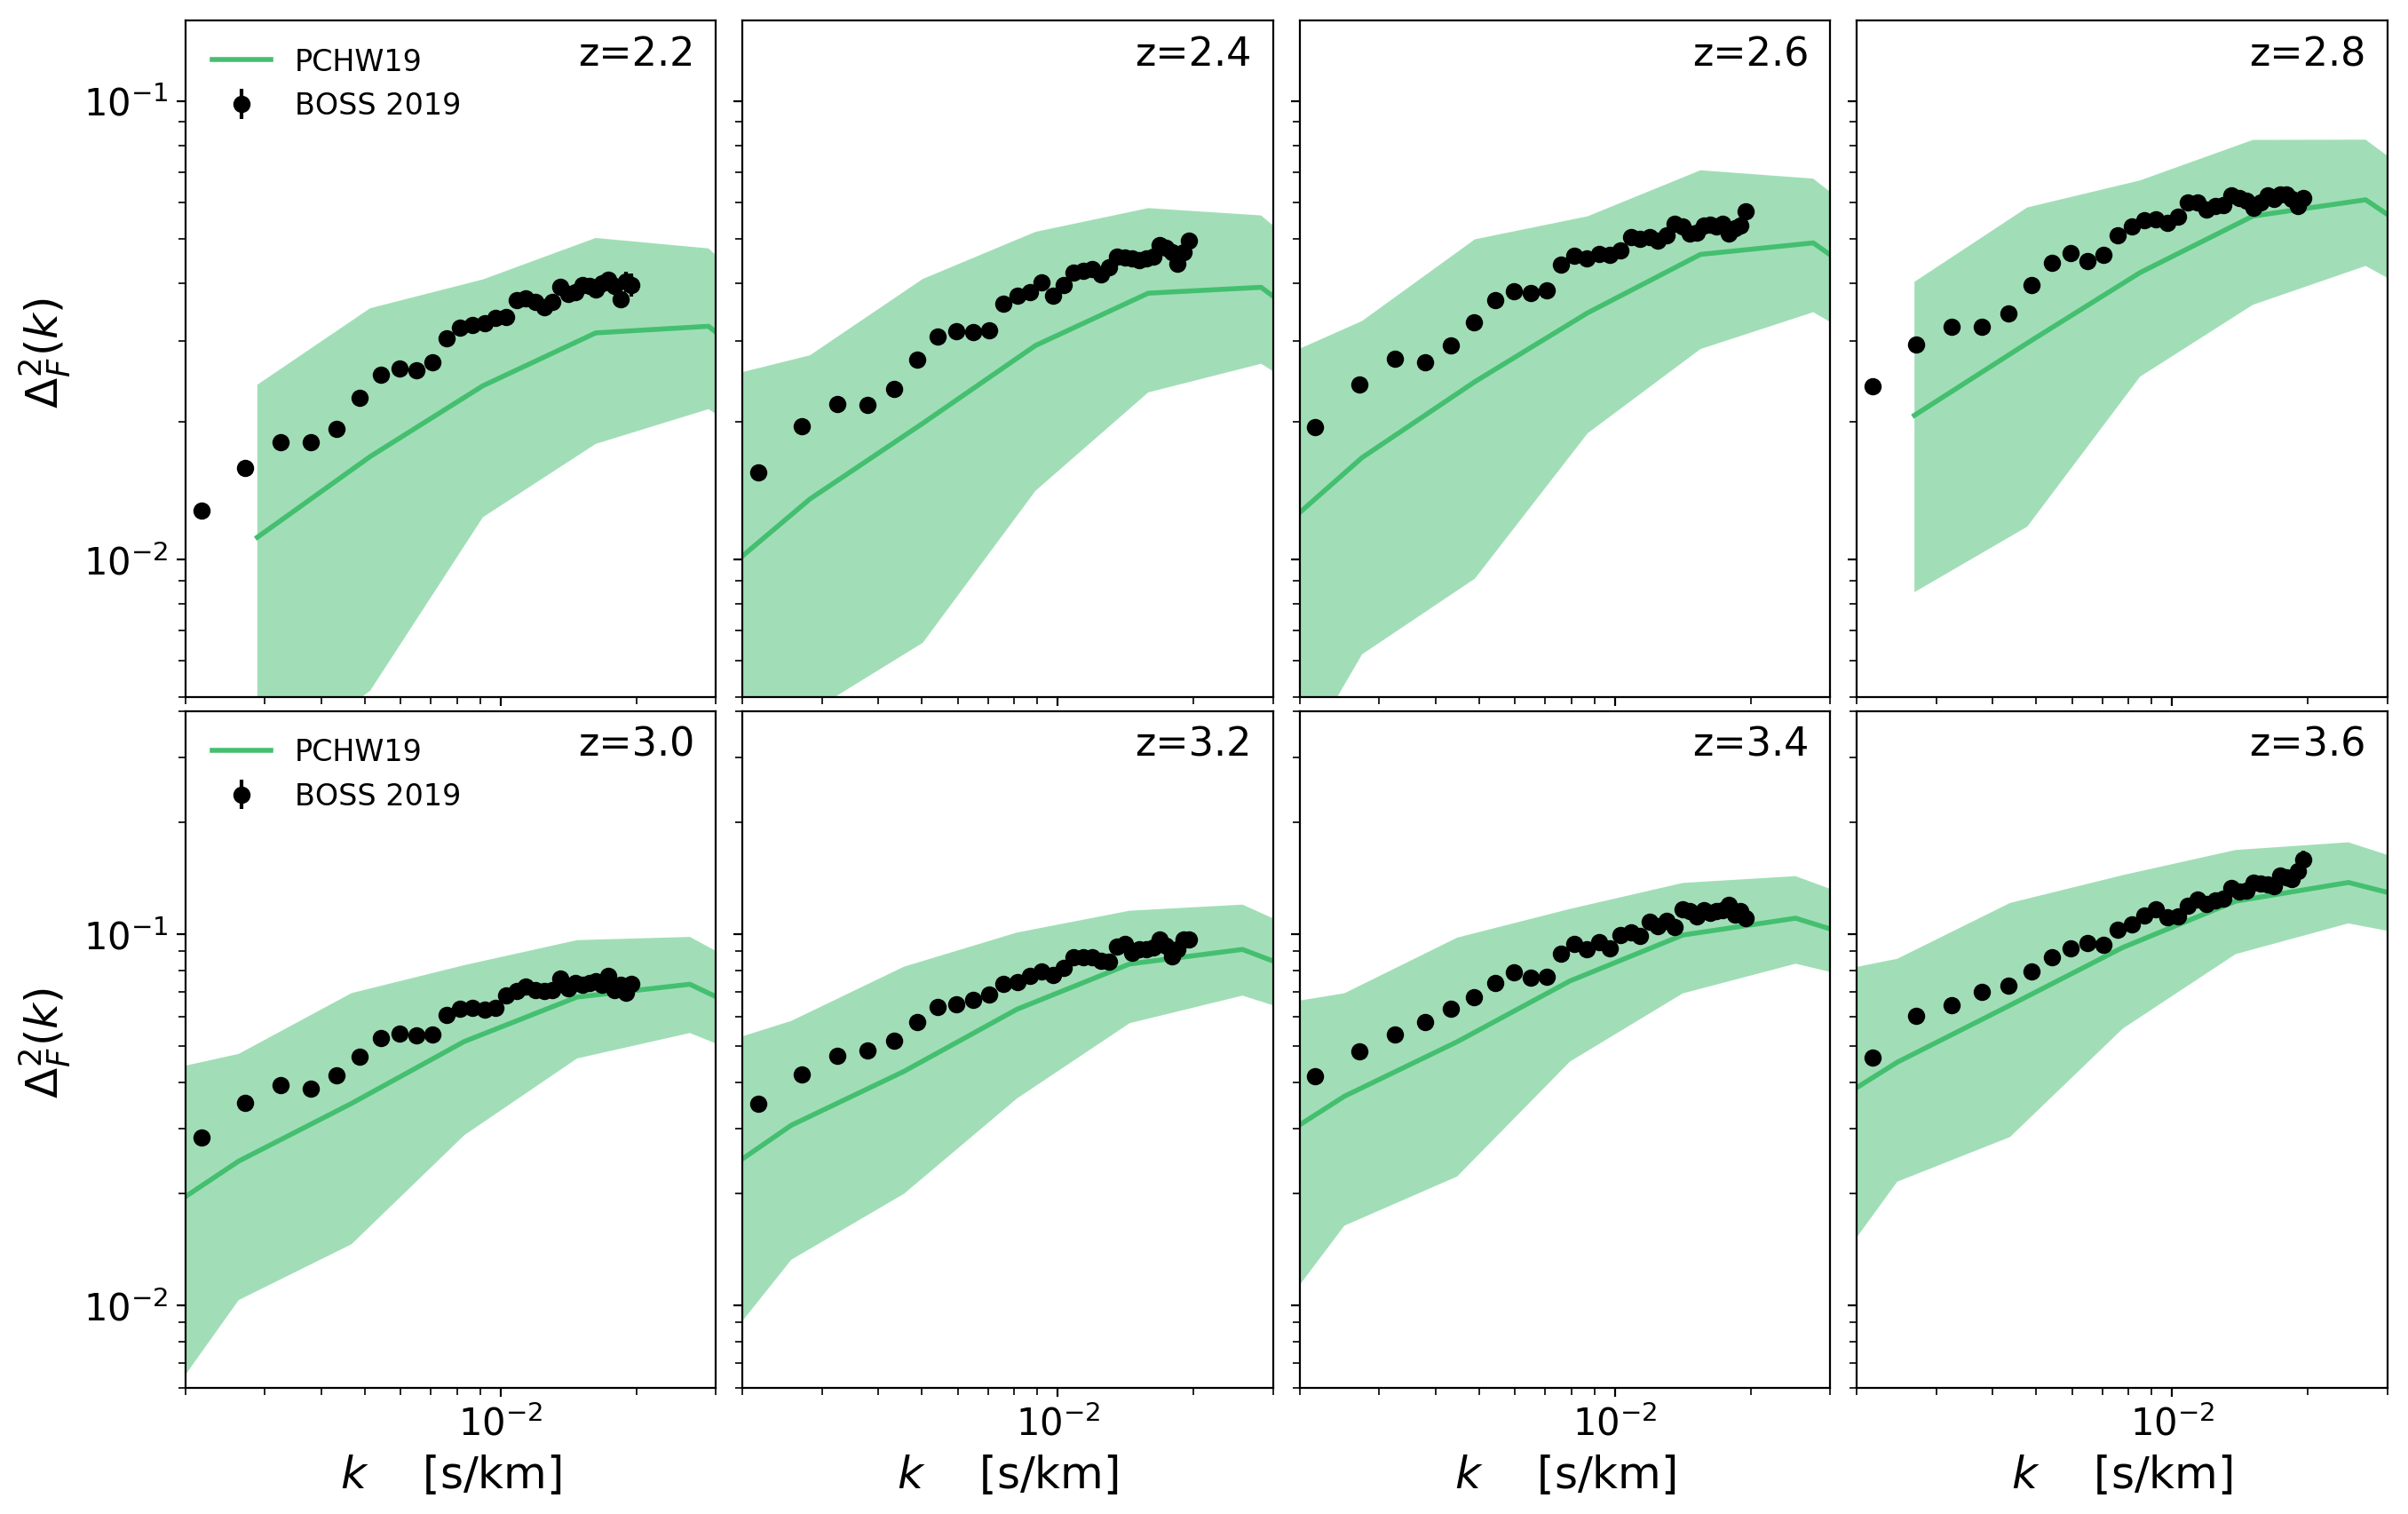
Without \(\sqrt{a}\) factor
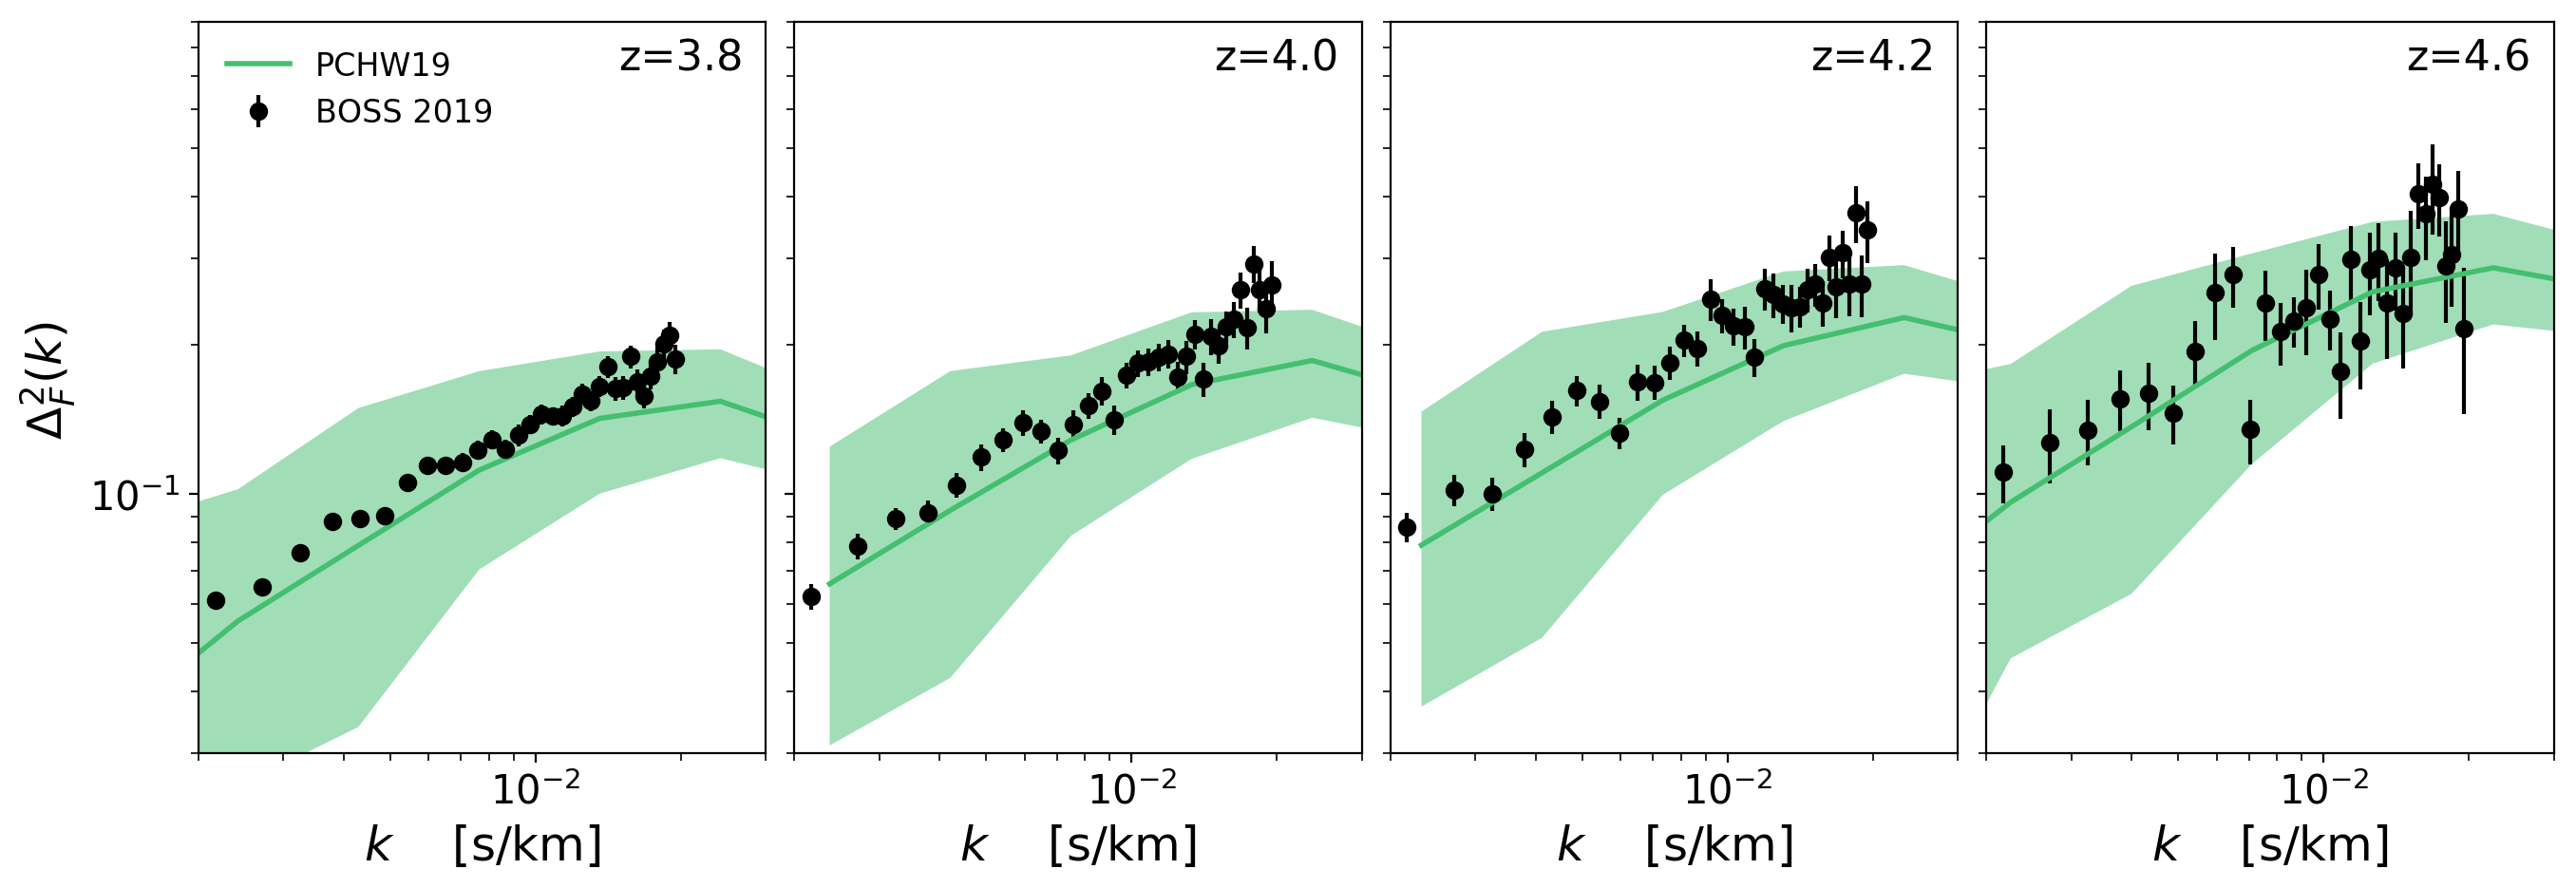
With \(\sqrt{a}\) factor
