SPH Skewers Direct Comparison
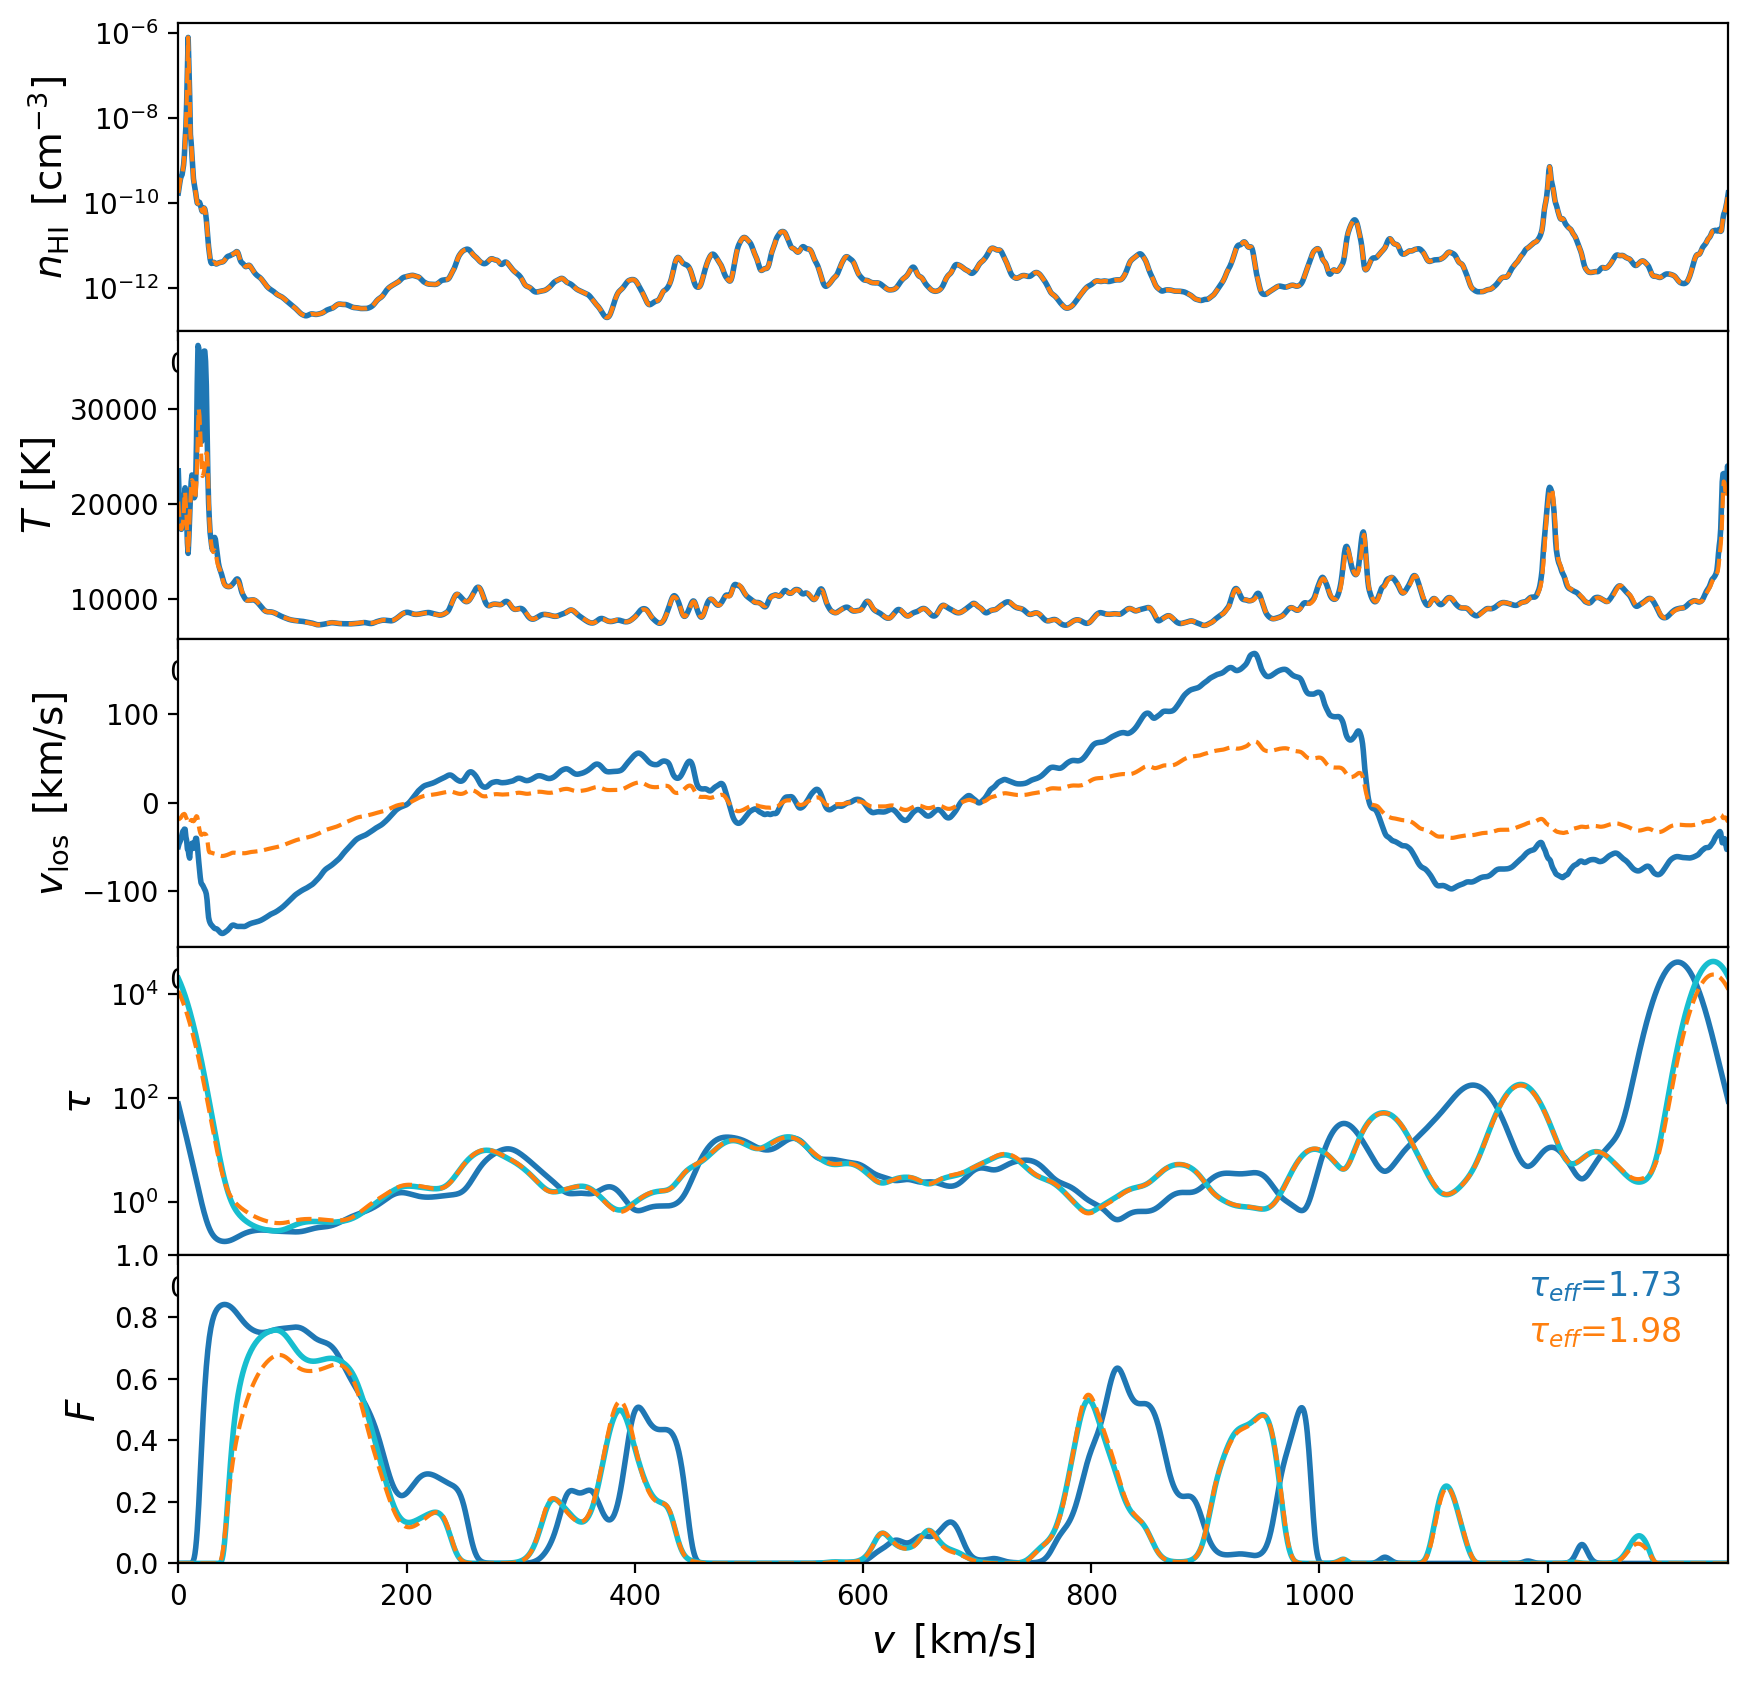
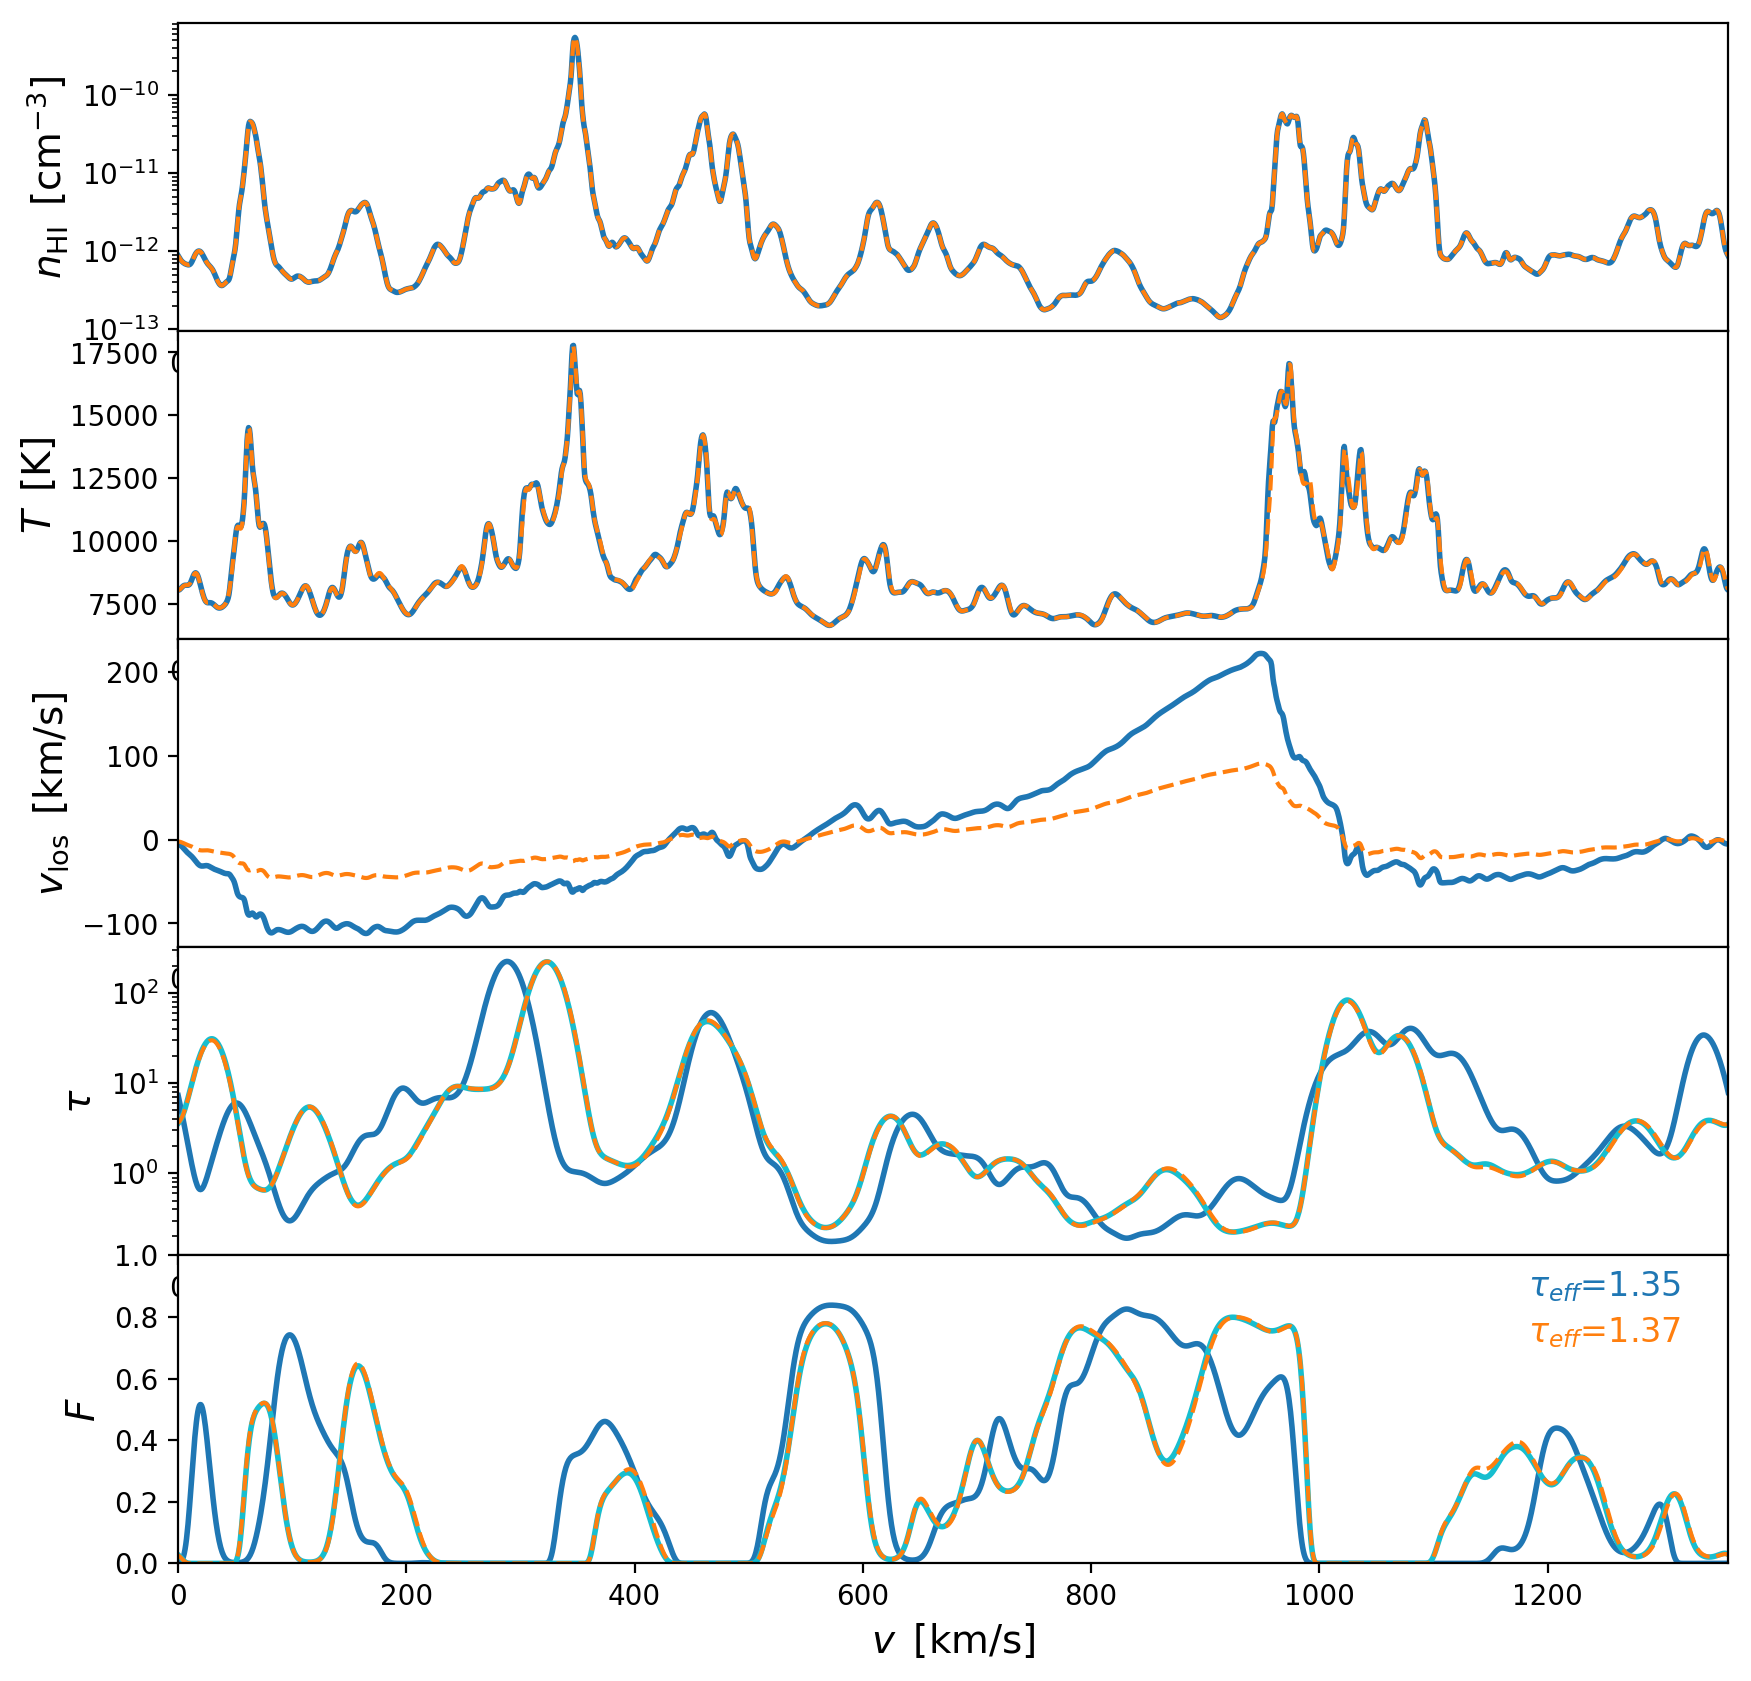
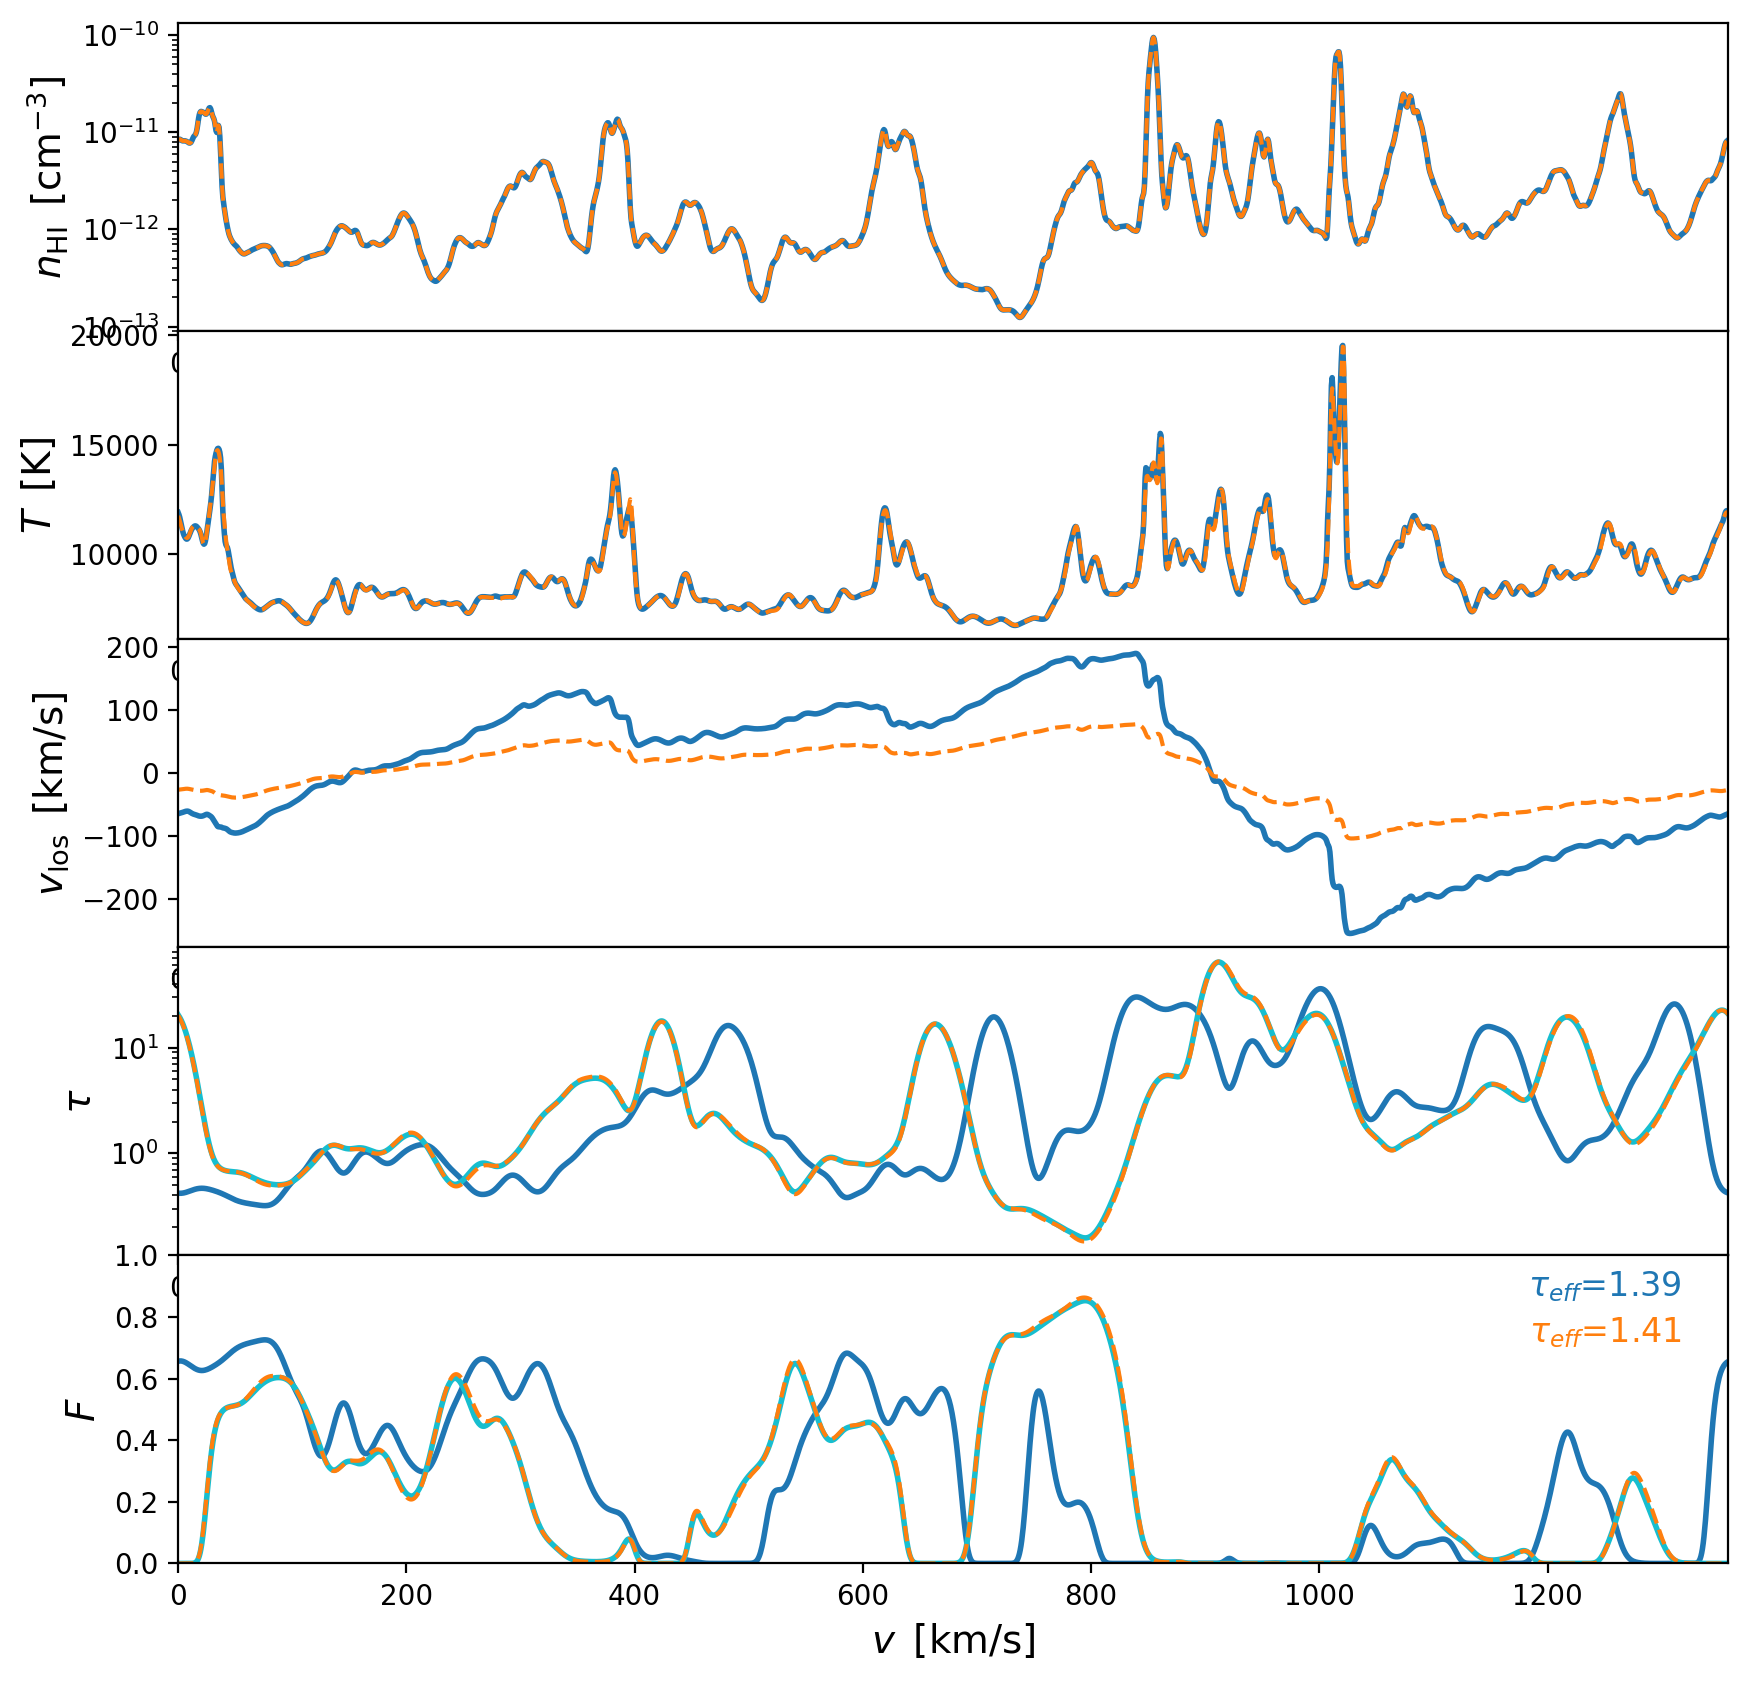
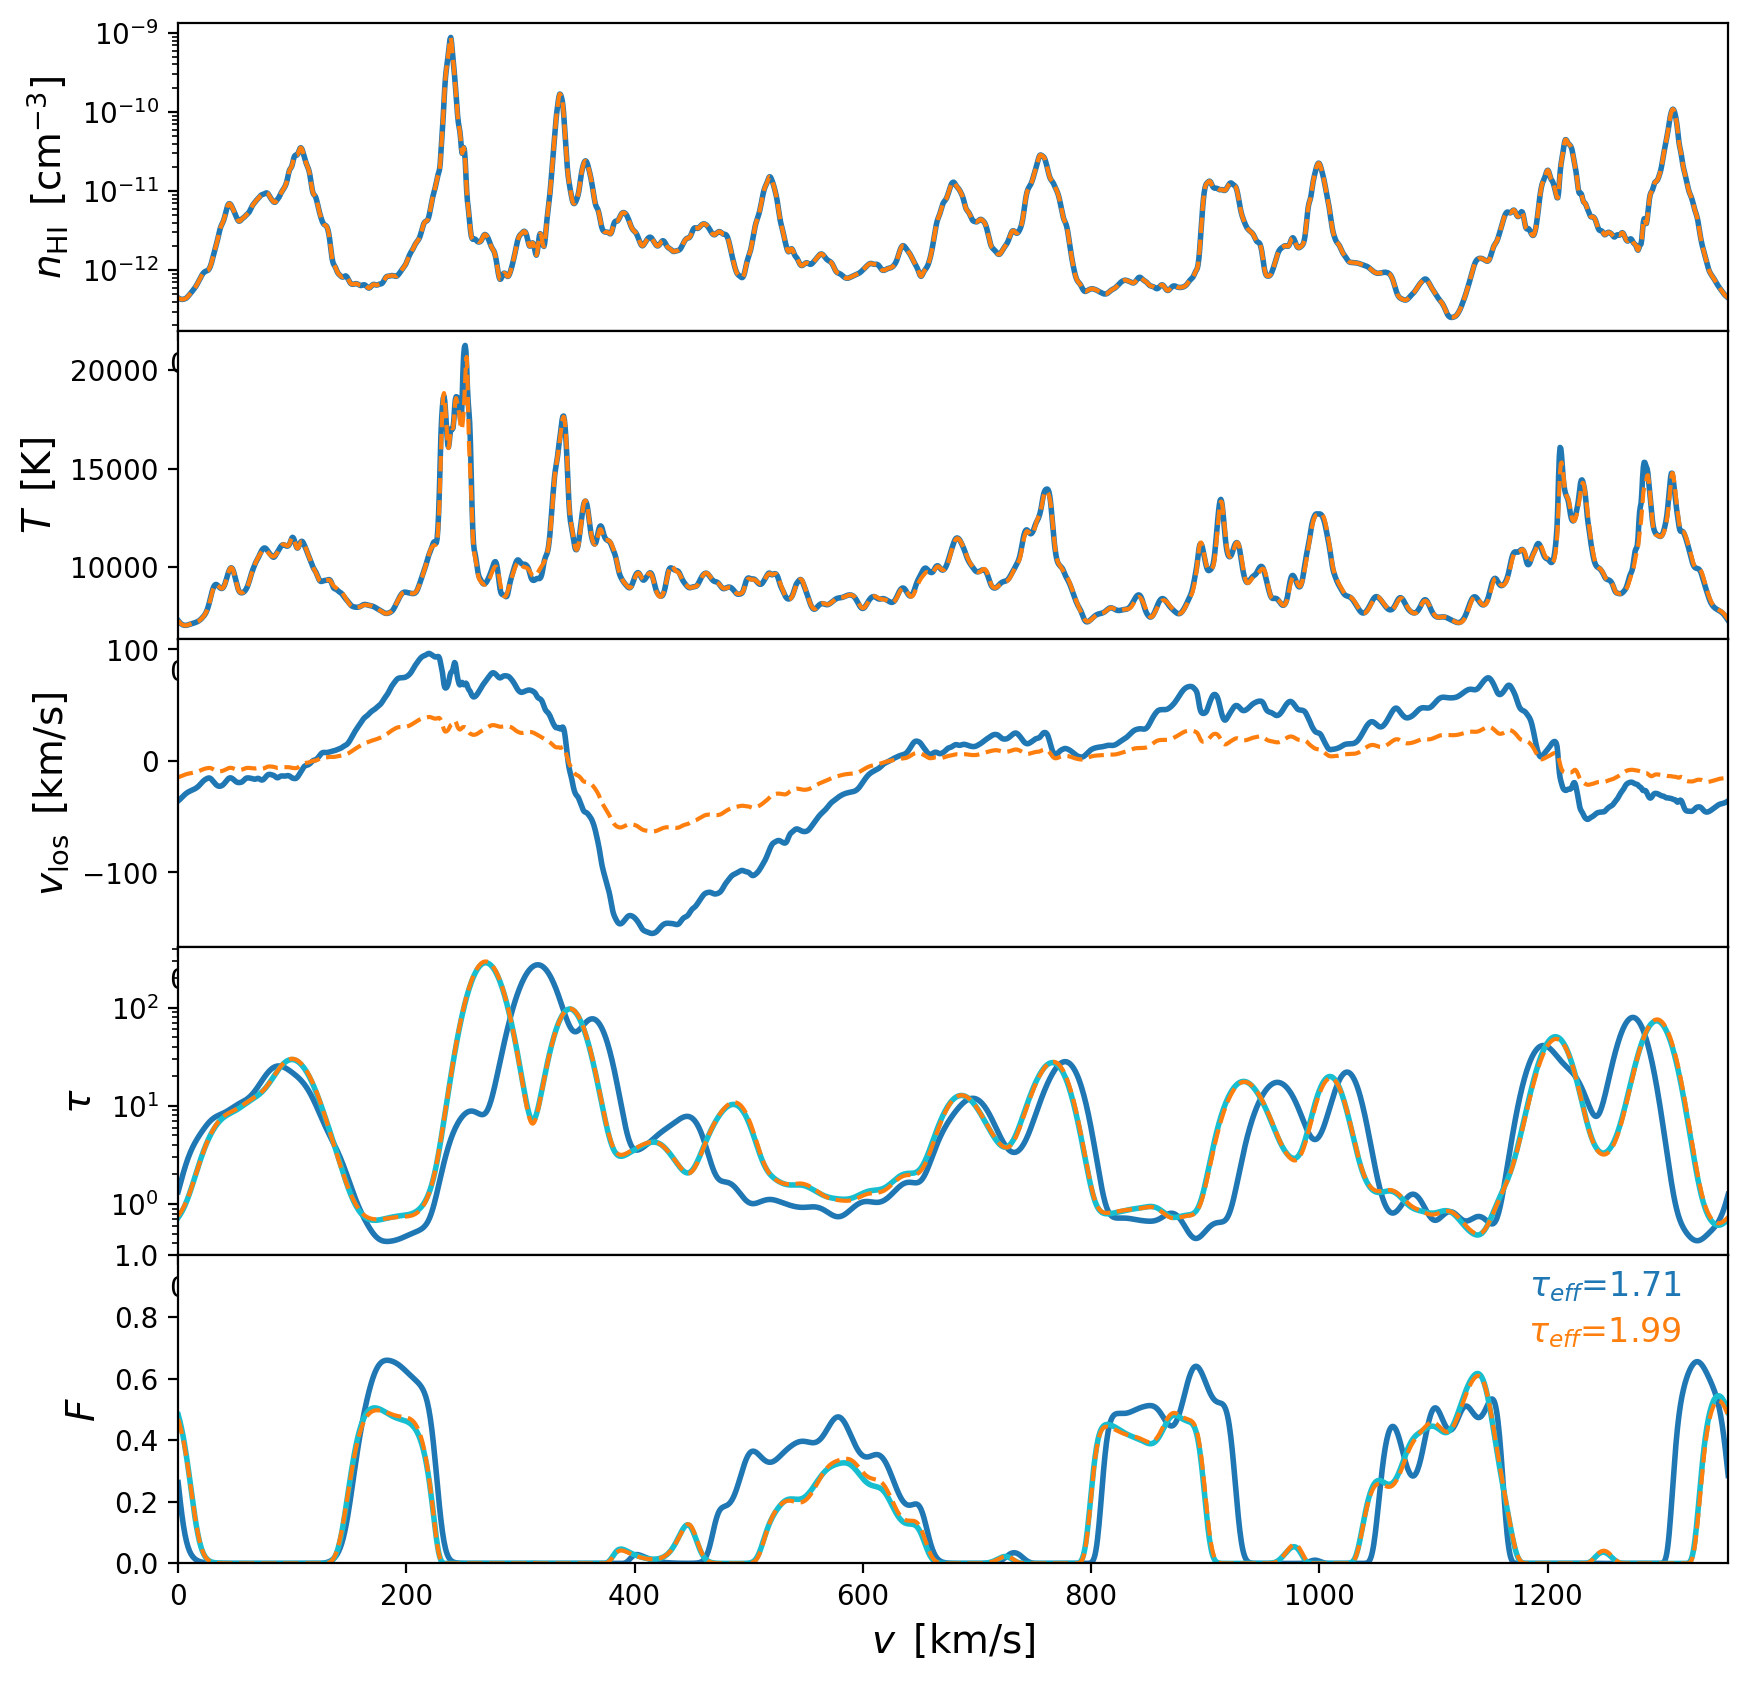
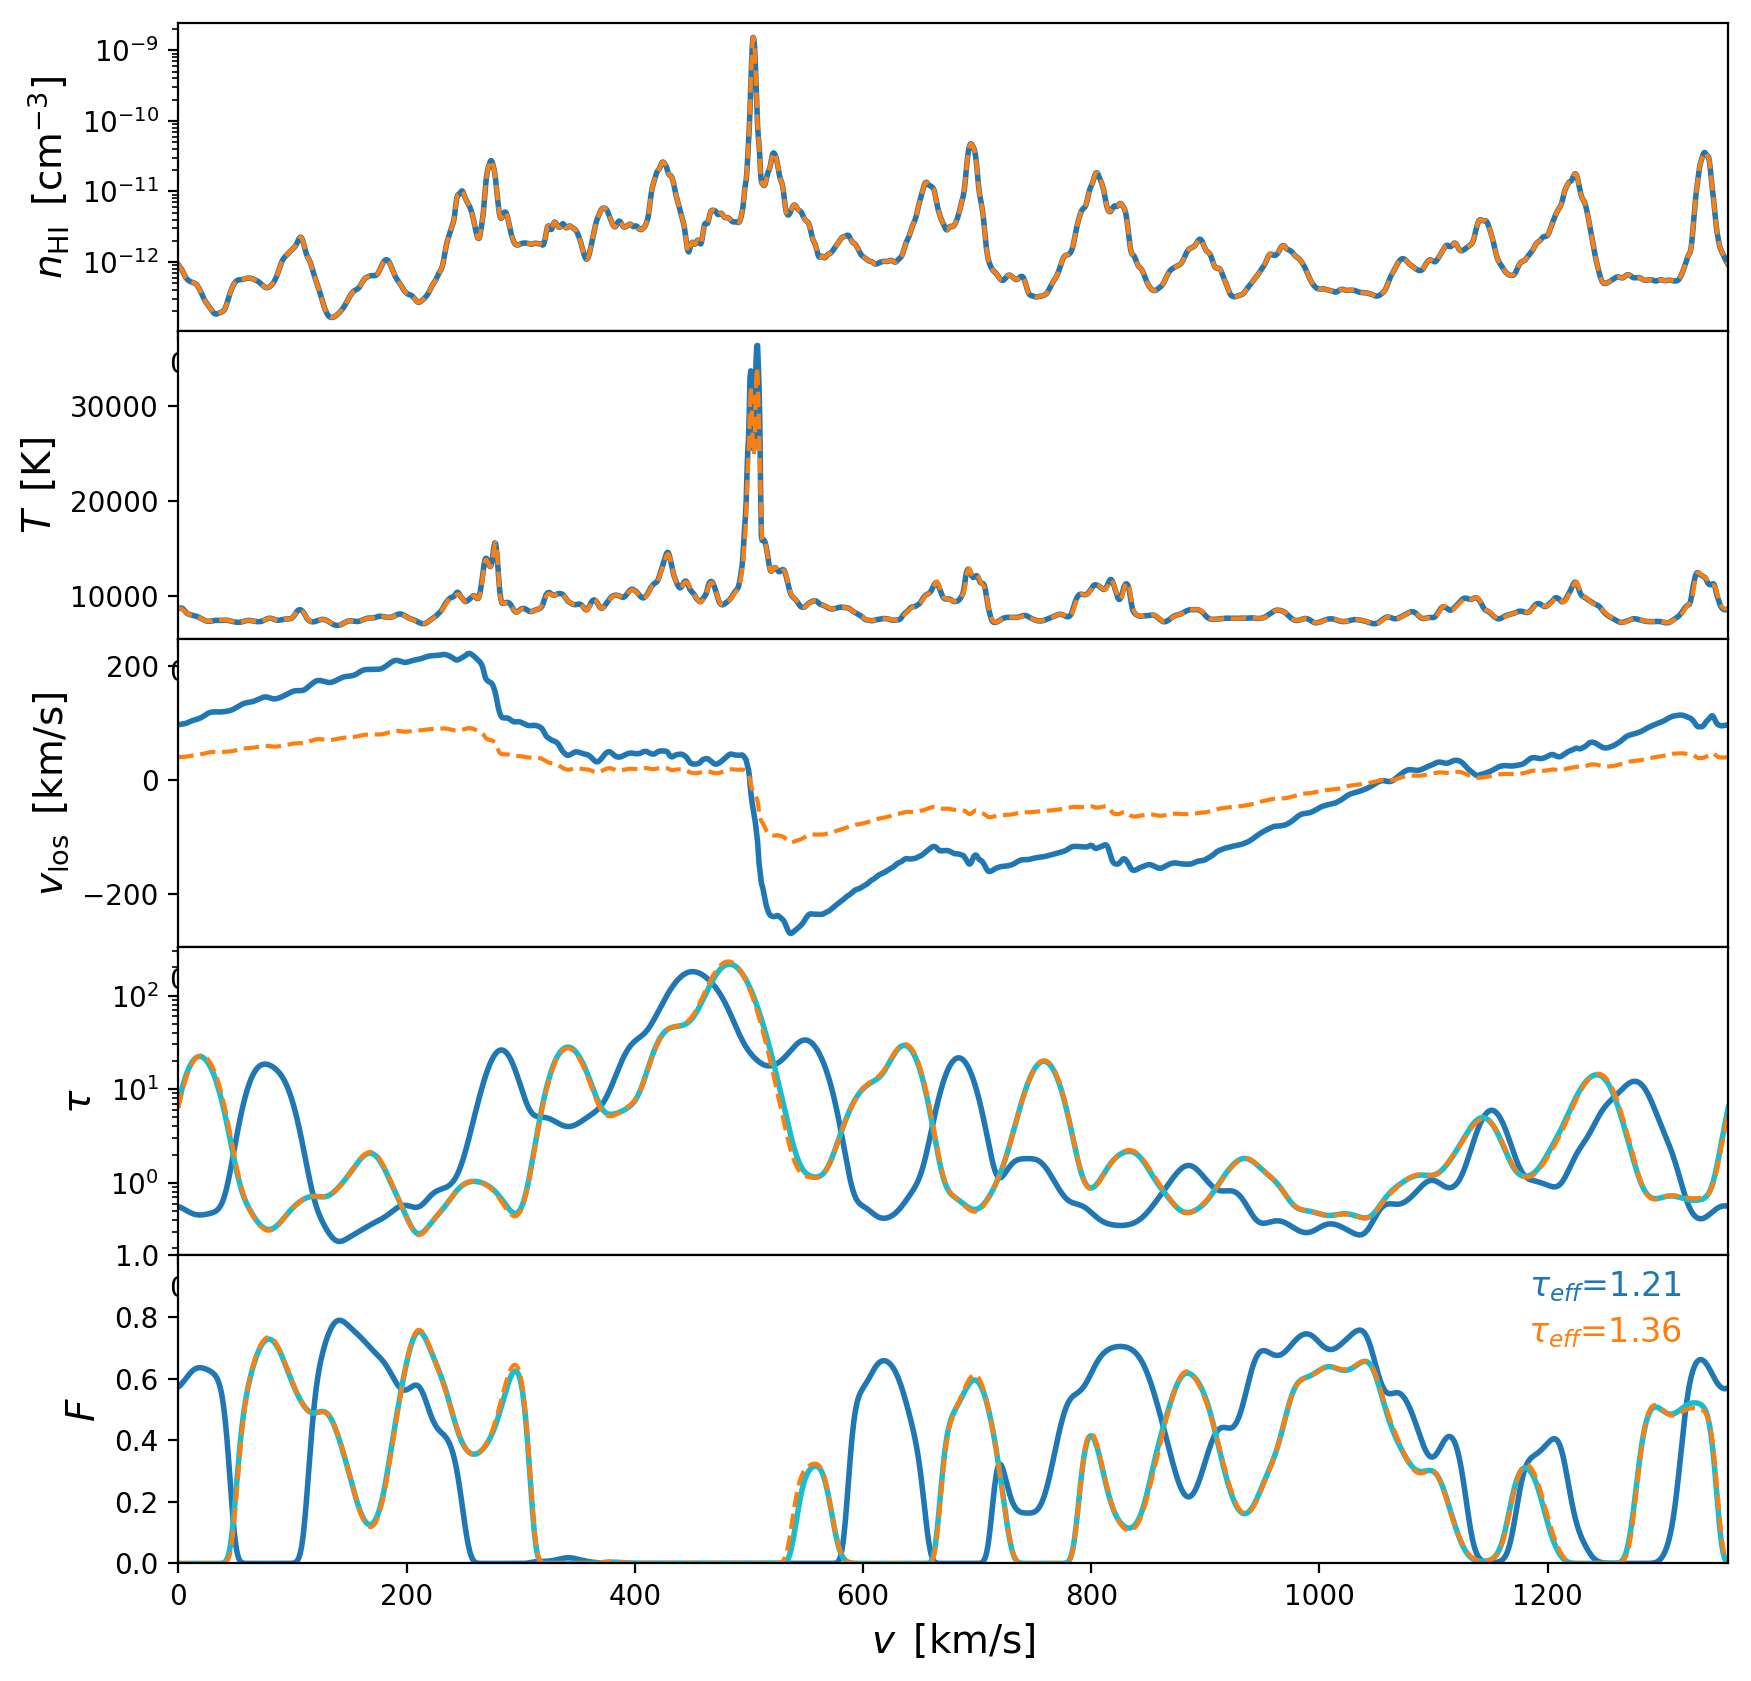
Here I compare the line of sight measurements for the first 5 skewers from the data set provided by Ewald Puchwein, the plots below show my measurements in blue lines and the measurements from Ewald in orange dashed lines. We obtain very similar results for the Neutral Hydrogen density and the gas temperature but our measurements of the Line of Sight Velovity are significantly different and this could explain why our measurements of the Effective Optical Depth are different.
The only difference is on the line of sight velocity, I measure significantly higher velocities. The way I am interpolating the particles velocities is following the next equation:
\[v(x)= \frac{\sum_{i=1}^{N} \rho_{i} v_i W\left(\left|\mathbf{r}\right|, h_{i}\right)}{ \sum_{i=1}^{N} \rho_{i} W\left(\left|\mathbf{r}\right|, h_{i}\right)}\]where \(r = \| x - x_i \|\) is the distance between the particle and the interpolation position.
On light blue I plot the Optical Depth and Transmitted flux computed using my measurements of \(n_{\mathrm{HI}}\) and \(T\) but Ewalds \(v_{\mathrm{los}}\) instead, just to show that we obtain the same \(\tau\) given the same velocities.
Additionally I measure the \(\tau_{eff}\) along the skewer and indeed the higher velocities result in lower measurements of \(\tau_{eff}\) for all the 5 skewers.
1
2
3
4
5