Optical Depth from SPH Puchwein Simulations
For the SPH simulation, the optical depth is computed from the neutral hydrogen density and temperature interpolated onto a grid ( \(512^3\) cells ). For the interpolation I used two different methods:
Gather 64: Measure the distance that encloses 64 neighboring particles and use that distance as the smoothing length when computing the kernel weights.
Scatter: Use the smoothing lengths of the neighboring particles when computing the kernel weights.
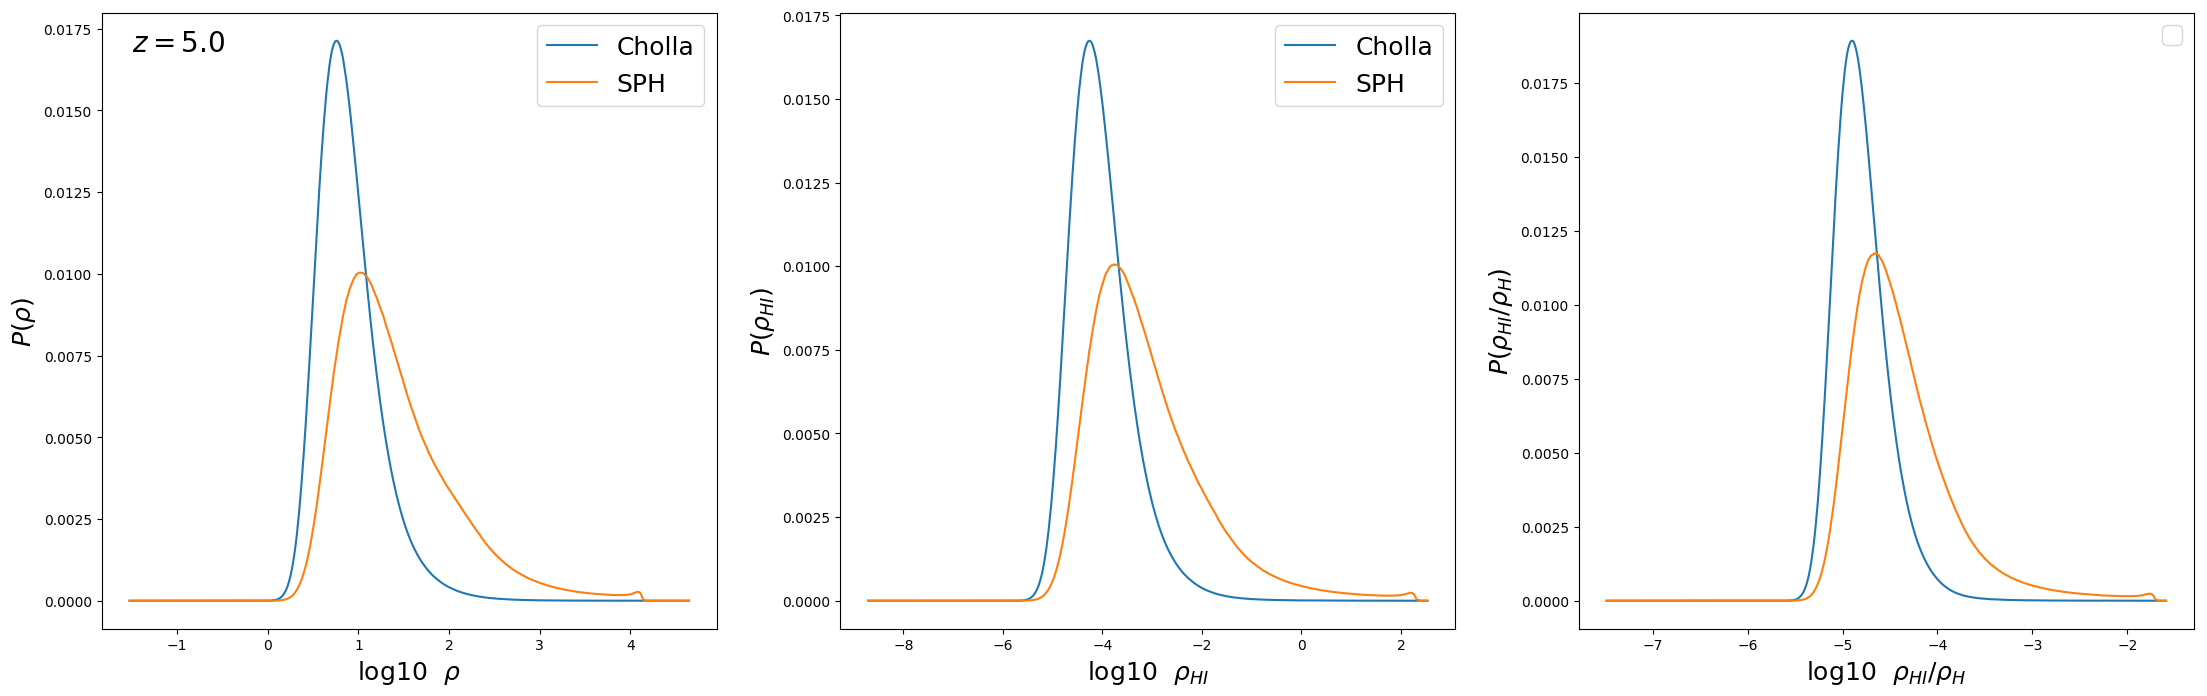
Density Distributions ( z = 5 )
First I measure the density distributions directly from the particles on the SPH simulations and compare to the distributions from the cells on the Cholla simulations.
Left Panel: Gas density distribution.
Center Panel: HI density distribution.
Right Panel: Neutral fraction distribution.
Now I compare the same thing but for the SPH simulation I measure the distributions on the data that I interpolated to the 512\(^3\) grid.
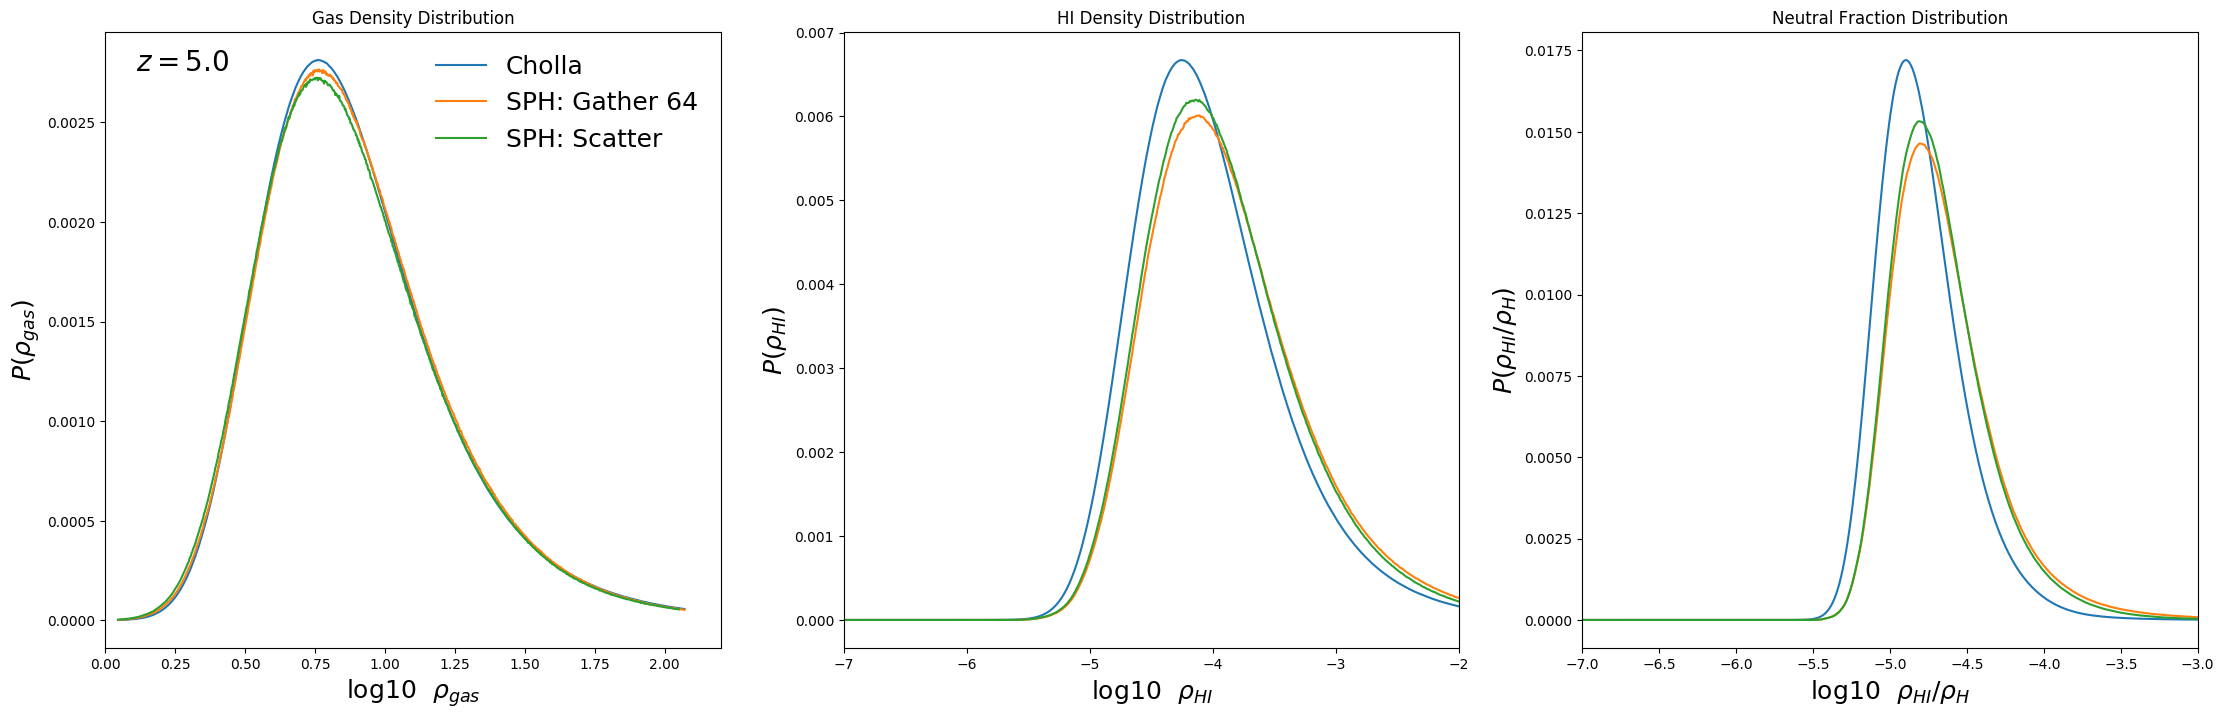
Seems like the gas density distribution on the grid SPH is very close to the Cholla simulation but this does not hold for the HI distribution, there is more HI on the SPH(Grid) data, this could explains why the optical depth is higher when measured on the SPH(Grid).
Optical Depth Comparison
Below I show the optical depth measured on the SPH(Grid) for the two interpolation methods and compare to the optical depth from the Cholla simulation
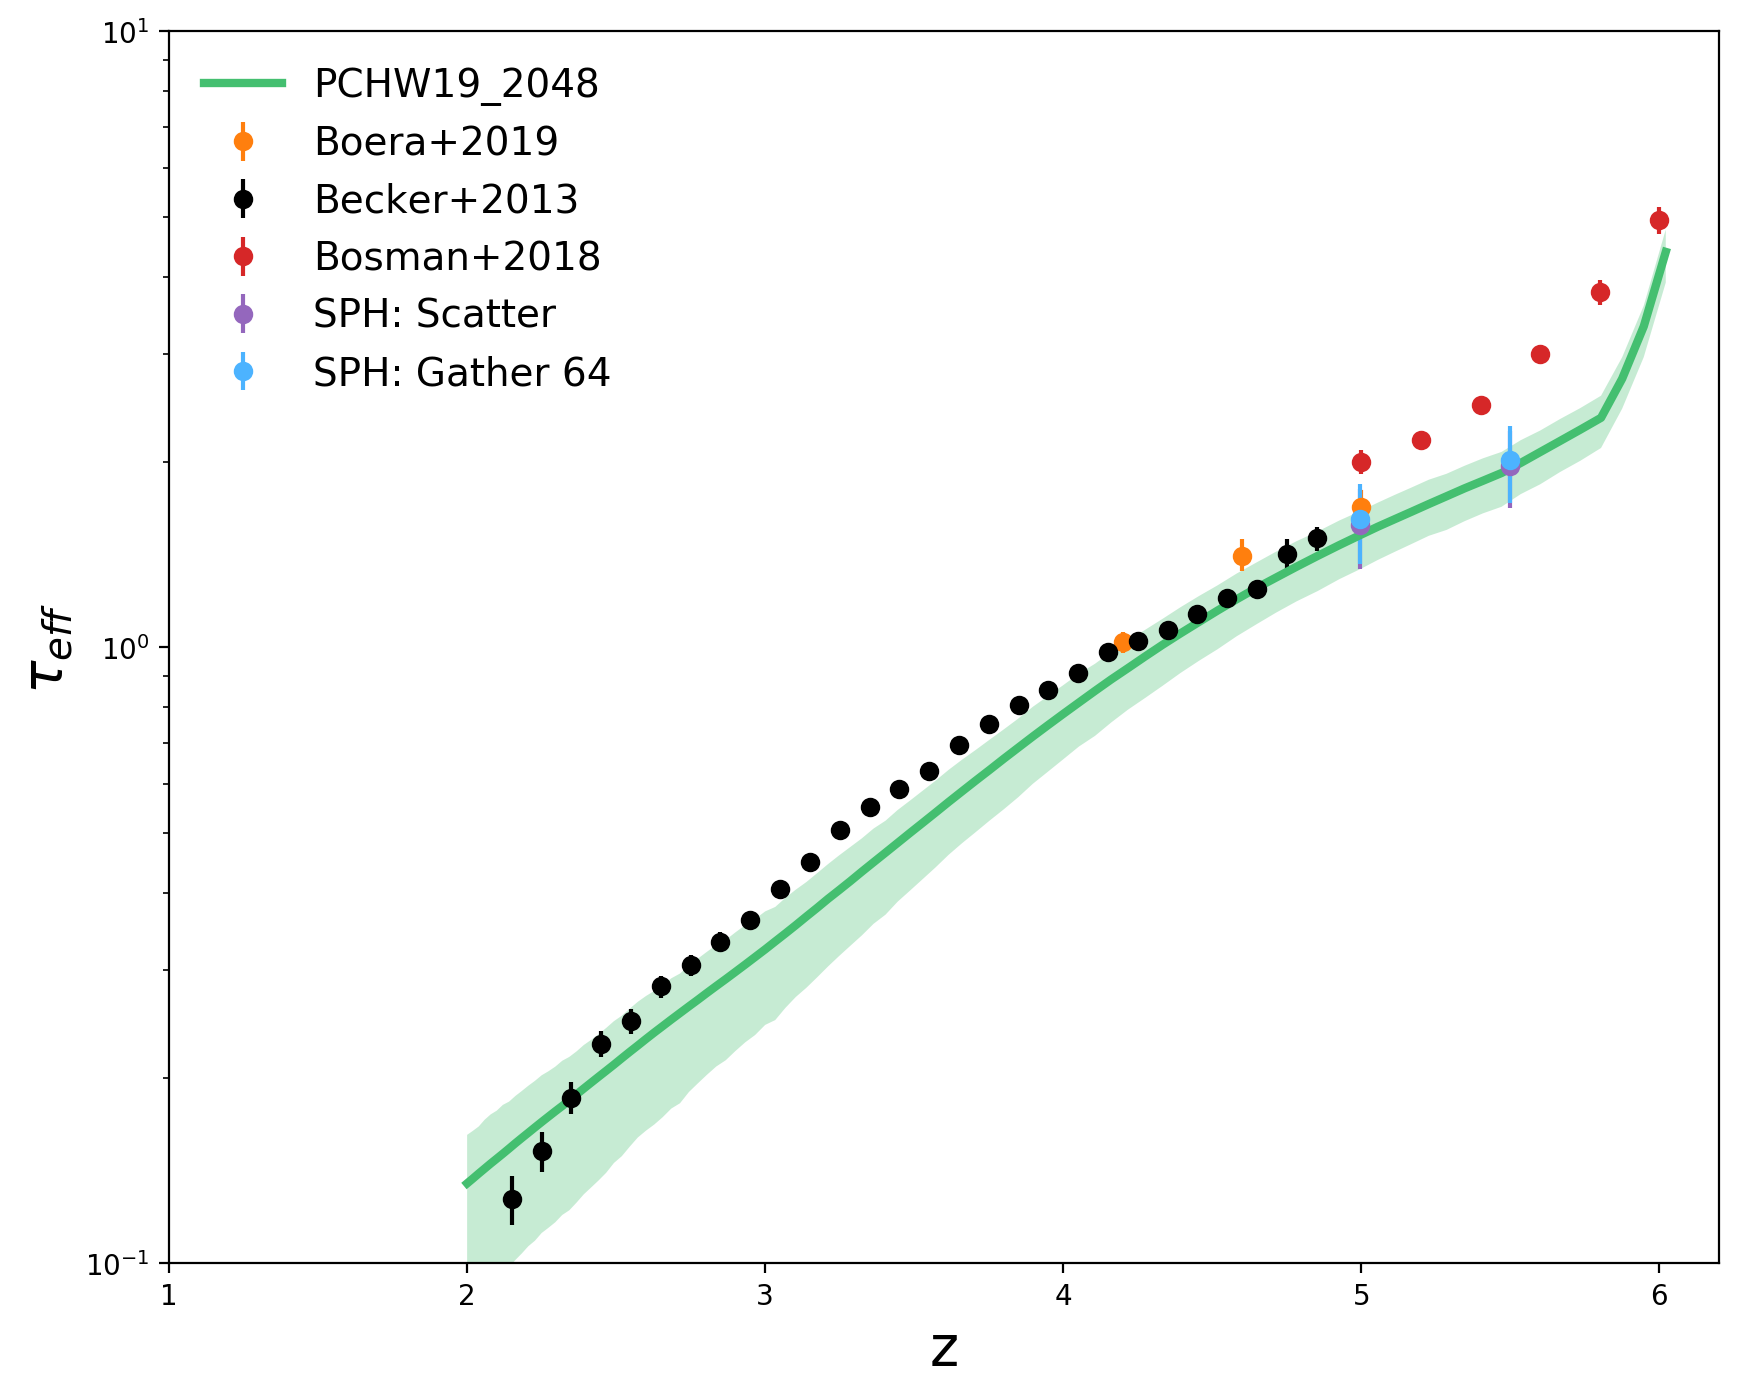
Surprisingly the optical depth that I measure from the SPH is only slightly higher that the one measured from the Ch olla simulation.